Cities with the Lowest Child Poverty Level Among Boys Under the Age of 16 in Iowa
RELATED REPORTS & OPTIONS
Lowest Poverty | Boys 0-16
Iowa
Compare Cities
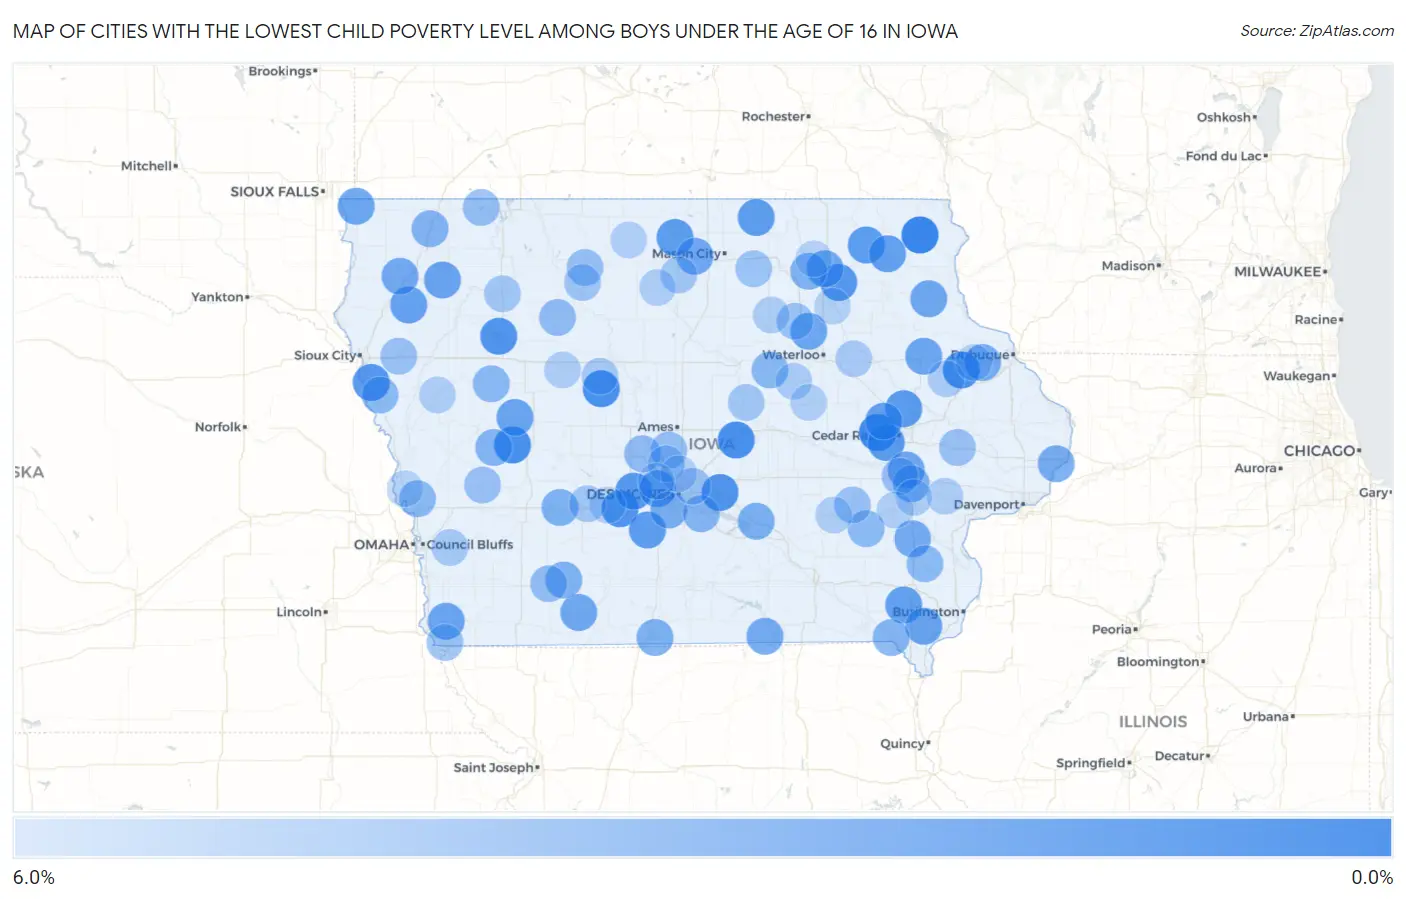
Map of Cities with the Lowest Child Poverty Level Among Boys Under the Age of 16 in Iowa
6.0%
0.0%
Cities with the Lowest Child Poverty Level Among Boys Under the Age of 16 in Iowa
| City | Child Poverty (Boys) | vs State | vs National | |
| 1. | Waukon | 0.67% | 13.4%(-12.7)#1 | 16.9%(-16.2)#72 |
| 2. | Atkins | 0.90% | 13.4%(-12.5)#2 | 16.9%(-16.0)#137 |
| 3. | Gowrie | 1.3% | 13.4%(-12.1)#3 | 16.9%(-15.6)#300 |
| 4. | Melbourne | 1.3% | 13.4%(-12.1)#4 | 16.9%(-15.6)#301 |
| 5. | Manning | 1.4% | 13.4%(-12.0)#5 | 16.9%(-15.5)#322 |
| 6. | Worthington | 1.4% | 13.4%(-12.0)#6 | 16.9%(-15.5)#325 |
| 7. | Earlham | 1.5% | 13.4%(-11.9)#7 | 16.9%(-15.4)#376 |
| 8. | Prairie City | 1.6% | 13.4%(-11.8)#8 | 16.9%(-15.3)#397 |
| 9. | Lakeside | 1.7% | 13.4%(-11.7)#9 | 16.9%(-15.2)#436 |
| 10. | Fredericksburg | 1.8% | 13.4%(-11.6)#10 | 16.9%(-15.1)#514 |
| 11. | Salix | 1.8% | 13.4%(-11.6)#11 | 16.9%(-15.1)#515 |
| 12. | Adel | 1.9% | 13.4%(-11.5)#12 | 16.9%(-15.0)#558 |
| 13. | Alburnett | 1.9% | 13.4%(-11.5)#13 | 16.9%(-15.0)#597 |
| 14. | Fairfax | 2.0% | 13.4%(-11.4)#14 | 16.9%(-14.9)#608 |
| 15. | Spillville | 2.0% | 13.4%(-11.4)#15 | 16.9%(-14.9)#655 |
| 16. | Patterson | 2.0% | 13.4%(-11.4)#16 | 16.9%(-14.9)#656 |
| 17. | Forest City | 2.1% | 13.4%(-11.3)#17 | 16.9%(-14.8)#690 |
| 18. | St Ansgar | 2.1% | 13.4%(-11.3)#18 | 16.9%(-14.8)#707 |
| 19. | Clive | 2.2% | 13.4%(-11.2)#19 | 16.9%(-14.7)#750 |
| 20. | Ossian | 2.3% | 13.4%(-11.1)#20 | 16.9%(-14.6)#817 |
| 21. | Palo | 2.3% | 13.4%(-11.1)#21 | 16.9%(-14.6)#826 |
| 22. | Salem | 2.3% | 13.4%(-11.1)#22 | 16.9%(-14.6)#832 |
| 23. | Remsen | 2.4% | 13.4%(-11.0)#23 | 16.9%(-14.5)#863 |
| 24. | West Point | 2.5% | 13.4%(-10.9)#24 | 16.9%(-14.4)#951 |
| 25. | Arcadia | 2.5% | 13.4%(-10.9)#25 | 16.9%(-14.4)#952 |
| 26. | Paullina | 2.6% | 13.4%(-10.8)#26 | 16.9%(-14.3)#972 |
| 27. | Sidney | 2.6% | 13.4%(-10.8)#27 | 16.9%(-14.3)#988 |
| 28. | New Hampton | 2.7% | 13.4%(-10.7)#28 | 16.9%(-14.2)#1,035 |
| 29. | Manchester | 2.7% | 13.4%(-10.7)#29 | 16.9%(-14.2)#1,036 |
| 30. | Janesville | 2.7% | 13.4%(-10.7)#30 | 16.9%(-14.2)#1,050 |
| 31. | Larchwood | 2.8% | 13.4%(-10.7)#31 | 16.9%(-14.2)#1,076 |
| 32. | Clearfield | 2.8% | 13.4%(-10.6)#32 | 16.9%(-14.1)#1,094 |
| 33. | North Liberty | 2.8% | 13.4%(-10.6)#33 | 16.9%(-14.1)#1,097 |
| 34. | Elkader | 2.8% | 13.4%(-10.6)#34 | 16.9%(-14.1)#1,101 |
| 35. | Orange City | 2.9% | 13.4%(-10.5)#35 | 16.9%(-14.0)#1,146 |
| 36. | Ventura | 2.9% | 13.4%(-10.5)#36 | 16.9%(-14.0)#1,166 |
| 37. | Exline | 3.0% | 13.4%(-10.4)#37 | 16.9%(-13.9)#1,258 |
| 38. | Epworth | 3.1% | 13.4%(-10.3)#38 | 16.9%(-13.8)#1,282 |
| 39. | Ainsworth | 3.1% | 13.4%(-10.3)#39 | 16.9%(-13.8)#1,286 |
| 40. | Camanche | 3.1% | 13.4%(-10.3)#40 | 16.9%(-13.8)#1,296 |
| 41. | Norwalk | 3.2% | 13.4%(-10.2)#41 | 16.9%(-13.7)#1,354 |
| 42. | Pella | 3.3% | 13.4%(-10.1)#42 | 16.9%(-13.6)#1,424 |
| 43. | University Heights | 3.3% | 13.4%(-10.1)#43 | 16.9%(-13.6)#1,429 |
| 44. | Adair | 3.3% | 13.4%(-10.1)#44 | 16.9%(-13.6)#1,444 |
| 45. | Davis City | 3.3% | 13.4%(-10.1)#45 | 16.9%(-13.6)#1,452 |
| 46. | Prescott | 3.4% | 13.4%(-9.96)#46 | 16.9%(-13.5)#1,519 |
| 47. | Ionia | 3.4% | 13.4%(-9.96)#47 | 16.9%(-13.5)#1,520 |
| 48. | Ashton | 3.5% | 13.4%(-9.90)#48 | 16.9%(-13.4)#1,552 |
| 49. | Manilla | 3.6% | 13.4%(-9.84)#49 | 16.9%(-13.3)#1,583 |
| 50. | Hartford | 3.7% | 13.4%(-9.70)#50 | 16.9%(-13.2)#1,659 |
| 51. | Farmington | 3.7% | 13.4%(-9.70)#51 | 16.9%(-13.2)#1,661 |
| 52. | Missouri Valley | 3.8% | 13.4%(-9.58)#52 | 16.9%(-13.1)#1,724 |
| 53. | Holland | 3.8% | 13.4%(-9.56)#53 | 16.9%(-13.1)#1,739 |
| 54. | Odebolt | 3.9% | 13.4%(-9.52)#54 | 16.9%(-13.0)#1,760 |
| 55. | Keota | 3.9% | 13.4%(-9.49)#55 | 16.9%(-13.0)#1,783 |
| 56. | Winfield | 3.9% | 13.4%(-9.47)#56 | 16.9%(-13.0)#1,791 |
| 57. | Sloan | 3.9% | 13.4%(-9.47)#57 | 16.9%(-13.0)#1,792 |
| 58. | Pocahontas | 4.1% | 13.4%(-9.31)#58 | 16.9%(-12.8)#1,876 |
| 59. | Woodward | 4.1% | 13.4%(-9.30)#59 | 16.9%(-12.8)#1,881 |
| 60. | Corning | 4.2% | 13.4%(-9.18)#60 | 16.9%(-12.7)#1,944 |
| 61. | Lake Park | 4.3% | 13.4%(-9.13)#61 | 16.9%(-12.6)#1,972 |
| 62. | Slater | 4.3% | 13.4%(-9.09)#62 | 16.9%(-12.6)#2,004 |
| 63. | Whittemore | 4.3% | 13.4%(-9.06)#63 | 16.9%(-12.6)#2,023 |
| 64. | Tiffin | 4.4% | 13.4%(-9.01)#64 | 16.9%(-12.5)#2,053 |
| 65. | North English | 4.4% | 13.4%(-9.01)#65 | 16.9%(-12.5)#2,055 |
| 66. | Altoona | 4.4% | 13.4%(-8.99)#66 | 16.9%(-12.5)#2,066 |
| 67. | Harlan | 4.4% | 13.4%(-8.98)#67 | 16.9%(-12.5)#2,070 |
| 68. | Stanwood | 4.4% | 13.4%(-8.96)#68 | 16.9%(-12.5)#2,079 |
| 69. | Moville | 4.5% | 13.4%(-8.95)#69 | 16.9%(-12.4)#2,087 |
| 70. | Hamburg | 4.5% | 13.4%(-8.93)#70 | 16.9%(-12.4)#2,103 |
| 71. | Shell Rock | 4.5% | 13.4%(-8.86)#71 | 16.9%(-12.4)#2,131 |
| 72. | Rockford | 4.6% | 13.4%(-8.81)#72 | 16.9%(-12.3)#2,163 |
| 73. | West Bend | 4.7% | 13.4%(-8.74)#73 | 16.9%(-12.2)#2,206 |
| 74. | Polk City | 4.8% | 13.4%(-8.65)#74 | 16.9%(-12.1)#2,242 |
| 75. | Menlo | 4.8% | 13.4%(-8.65)#75 | 16.9%(-12.1)#2,255 |
| 76. | Sioux Rapids | 4.8% | 13.4%(-8.61)#76 | 16.9%(-12.1)#2,275 |
| 77. | Klemme | 4.8% | 13.4%(-8.57)#77 | 16.9%(-12.1)#2,293 |
| 78. | Liscomb | 4.9% | 13.4%(-8.53)#78 | 16.9%(-12.0)#2,321 |
| 79. | Callender | 4.9% | 13.4%(-8.49)#79 | 16.9%(-12.0)#2,343 |
| 80. | Treynor | 5.0% | 13.4%(-8.44)#80 | 16.9%(-11.9)#2,367 |
| 81. | Jesup | 5.1% | 13.4%(-8.32)#81 | 16.9%(-11.8)#2,448 |
| 82. | Hopkinton | 5.2% | 13.4%(-8.24)#82 | 16.9%(-11.7)#2,506 |
| 83. | Reinbeck | 5.2% | 13.4%(-8.22)#83 | 16.9%(-11.7)#2,513 |
| 84. | West Liberty | 5.2% | 13.4%(-8.19)#84 | 16.9%(-11.7)#2,533 |
| 85. | Rockwell City | 5.2% | 13.4%(-8.17)#85 | 16.9%(-11.7)#2,550 |
| 86. | Allison | 5.3% | 13.4%(-8.15)#86 | 16.9%(-11.6)#2,563 |
| 87. | Kanawha | 5.3% | 13.4%(-8.15)#87 | 16.9%(-11.6)#2,564 |
| 88. | Danbury | 5.3% | 13.4%(-8.15)#88 | 16.9%(-11.6)#2,572 |
| 89. | Keswick | 5.3% | 13.4%(-8.15)#89 | 16.9%(-11.6)#2,573 |
| 90. | Kalona | 5.3% | 13.4%(-8.09)#90 | 16.9%(-11.6)#2,597 |
| 91. | Traer | 5.3% | 13.4%(-8.07)#91 | 16.9%(-11.6)#2,607 |
| 92. | Hills | 5.4% | 13.4%(-8.05)#92 | 16.9%(-11.5)#2,628 |
| 93. | Titonka | 5.4% | 13.4%(-8.00)#93 | 16.9%(-11.5)#2,663 |
| 94. | Ankeny | 5.4% | 13.4%(-7.97)#94 | 16.9%(-11.5)#2,684 |
| 95. | Grimes | 5.5% | 13.4%(-7.96)#95 | 16.9%(-11.5)#2,685 |
| 96. | Tripoli | 5.5% | 13.4%(-7.90)#96 | 16.9%(-11.4)#2,722 |
| 97. | Dexter | 5.6% | 13.4%(-7.85)#97 | 16.9%(-11.3)#2,748 |
| 98. | Modale | 5.6% | 13.4%(-7.85)#98 | 16.9%(-11.3)#2,756 |
| 99. | North Washington | 5.6% | 13.4%(-7.85)#99 | 16.9%(-11.3)#2,759 |
| 100. | Farley | 5.6% | 13.4%(-7.83)#100 | 16.9%(-11.3)#2,769 |
Common Questions
What are the Top 10 Cities with the Lowest Child Poverty Level Among Boys Under the Age of 16 in Iowa?
Top 10 Cities with the Lowest Child Poverty Level Among Boys Under the Age of 16 in Iowa are:
#1
0.67%
#2
0.90%
#3
1.3%
#4
1.3%
#5
1.4%
#6
1.4%
#7
1.5%
#8
1.6%
#9
1.7%
#10
1.8%
What city has the Lowest Child Poverty Level Among Boys Under the Age of 16 in Iowa?
Waukon has the Lowest Child Poverty Level Among Boys Under the Age of 16 in Iowa with 0.67%.
What is the Poverty Level Among Boys Under the Age of 16 in the State of Iowa?
Poverty Level Among Boys Under the Age of 16 in Iowa is 13.4%.
What is the Poverty Level Among Boys Under the Age of 16 in the United States?
Poverty Level Among Boys Under the Age of 16 in the United States is 16.9%.