Cities with the Lowest Child Poverty Level Among Boys Under the Age of 16 in Ohio
RELATED REPORTS & OPTIONS
Lowest Poverty | Boys 0-16
Ohio
Compare Cities
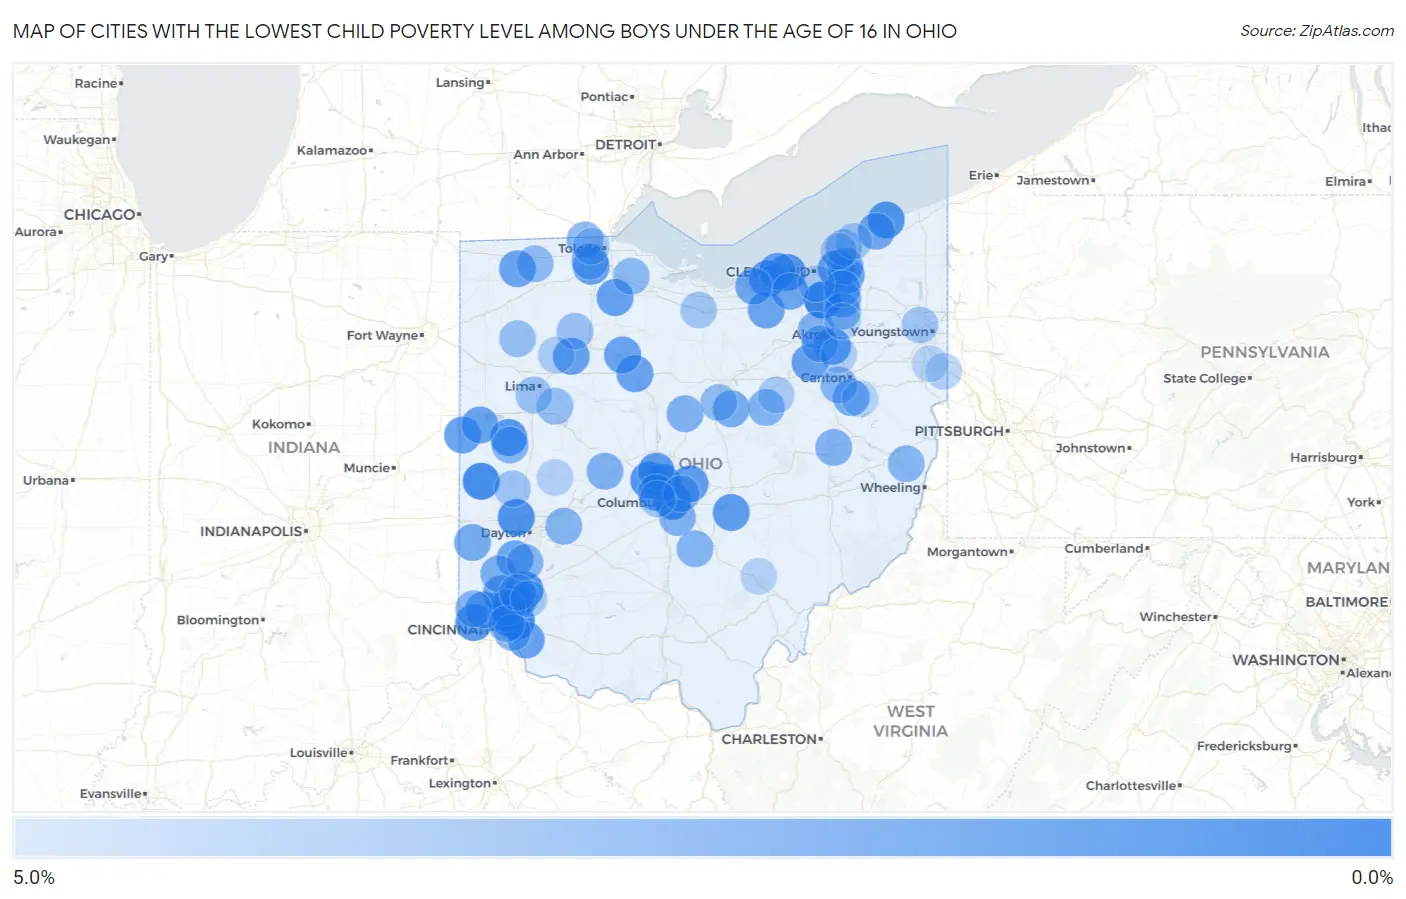
Map of Cities with the Lowest Child Poverty Level Among Boys Under the Age of 16 in Ohio
5.0%
0.0%
Cities with the Lowest Child Poverty Level Among Boys Under the Age of 16 in Ohio
| City | Child Poverty (Boys) | vs State | vs National | |
| 1. | Brecksville | 0.59% | 18.8%(-18.2)#1 | 16.9%(-16.3)#52 |
| 2. | Montgomery | 0.63% | 18.8%(-18.2)#2 | 16.9%(-16.3)#63 |
| 3. | Madeira | 0.70% | 18.8%(-18.1)#3 | 16.9%(-16.2)#81 |
| 4. | Terrace Park | 0.78% | 18.8%(-18.0)#4 | 16.9%(-16.1)#105 |
| 5. | Bexley | 0.98% | 18.8%(-17.8)#5 | 16.9%(-15.9)#163 |
| 6. | Greenville | 1.1% | 18.8%(-17.7)#6 | 16.9%(-15.8)#202 |
| 7. | Sixteen Mile Stand | 1.2% | 18.8%(-17.6)#7 | 16.9%(-15.7)#250 |
| 8. | South Lebanon | 1.3% | 18.8%(-17.5)#8 | 16.9%(-15.6)#287 |
| 9. | Worthington | 1.3% | 18.8%(-17.5)#9 | 16.9%(-15.6)#303 |
| 10. | Englewood | 1.4% | 18.8%(-17.5)#10 | 16.9%(-15.5)#315 |
| 11. | Lyndhurst | 1.5% | 18.8%(-17.3)#11 | 16.9%(-15.4)#359 |
| 12. | North Madison | 1.5% | 18.8%(-17.3)#12 | 16.9%(-15.4)#369 |
| 13. | Bay Village | 1.5% | 18.8%(-17.3)#13 | 16.9%(-15.4)#373 |
| 14. | Dublin | 1.6% | 18.8%(-17.3)#14 | 16.9%(-15.3)#390 |
| 15. | Sheffield | 1.6% | 18.8%(-17.2)#15 | 16.9%(-15.3)#407 |
| 16. | Mack | 1.6% | 18.8%(-17.2)#16 | 16.9%(-15.3)#414 |
| 17. | Minster | 1.6% | 18.8%(-17.2)#17 | 16.9%(-15.3)#420 |
| 18. | Powell | 1.7% | 18.8%(-17.1)#18 | 16.9%(-15.2)#478 |
| 19. | Portage Lakes | 1.8% | 18.8%(-17.0)#19 | 16.9%(-15.1)#502 |
| 20. | Thornville | 1.8% | 18.8%(-17.0)#20 | 16.9%(-15.1)#532 |
| 21. | New Albany | 1.9% | 18.8%(-16.9)#21 | 16.9%(-15.0)#562 |
| 22. | Mount Cory | 2.0% | 18.8%(-16.8)#22 | 16.9%(-14.9)#632 |
| 23. | Bradner | 2.0% | 18.8%(-16.8)#23 | 16.9%(-14.9)#640 |
| 24. | Fort Recovery | 2.0% | 18.8%(-16.8)#24 | 16.9%(-14.9)#650 |
| 25. | Hunting Valley | 2.0% | 18.8%(-16.8)#25 | 16.9%(-14.9)#652 |
| 26. | Evendale | 2.0% | 18.8%(-16.8)#26 | 16.9%(-14.9)#659 |
| 27. | Perrysburg | 2.1% | 18.8%(-16.7)#27 | 16.9%(-14.8)#676 |
| 28. | Marshallville | 2.1% | 18.8%(-16.7)#28 | 16.9%(-14.8)#708 |
| 29. | Avon Lake | 2.1% | 18.8%(-16.7)#29 | 16.9%(-14.8)#716 |
| 30. | Archbold | 2.2% | 18.8%(-16.7)#30 | 16.9%(-14.8)#724 |
| 31. | Upper Sandusky | 2.2% | 18.8%(-16.7)#31 | 16.9%(-14.7)#727 |
| 32. | Groesbeck | 2.2% | 18.8%(-16.7)#32 | 16.9%(-14.7)#735 |
| 33. | Carey | 2.2% | 18.8%(-16.6)#33 | 16.9%(-14.7)#745 |
| 34. | Amelia | 2.2% | 18.8%(-16.6)#34 | 16.9%(-14.7)#746 |
| 35. | Coldwater | 2.2% | 18.8%(-16.6)#35 | 16.9%(-14.7)#747 |
| 36. | Lagrange | 2.2% | 18.8%(-16.6)#36 | 16.9%(-14.7)#767 |
| 37. | Upper Arlington | 2.2% | 18.8%(-16.6)#37 | 16.9%(-14.7)#782 |
| 38. | Deer Park | 2.3% | 18.8%(-16.5)#38 | 16.9%(-14.6)#797 |
| 39. | Kenwood | 2.3% | 18.8%(-16.5)#39 | 16.9%(-14.6)#804 |
| 40. | Carlisle | 2.3% | 18.8%(-16.5)#40 | 16.9%(-14.6)#814 |
| 41. | Olmsted Falls | 2.3% | 18.8%(-16.5)#41 | 16.9%(-14.6)#819 |
| 42. | Perry | 2.4% | 18.8%(-16.4)#42 | 16.9%(-14.5)#864 |
| 43. | Beckett Ridge | 2.4% | 18.8%(-16.4)#43 | 16.9%(-14.5)#869 |
| 44. | Amherst | 2.4% | 18.8%(-16.4)#44 | 16.9%(-14.5)#871 |
| 45. | Twinsburg | 2.4% | 18.8%(-16.4)#45 | 16.9%(-14.5)#887 |
| 46. | East Sparta | 2.5% | 18.8%(-16.3)#46 | 16.9%(-14.4)#950 |
| 47. | Gates Mills | 2.6% | 18.8%(-16.3)#47 | 16.9%(-14.4)#957 |
| 48. | Butler | 2.6% | 18.8%(-16.2)#48 | 16.9%(-14.3)#1,017 |
| 49. | Lake Lakengren | 2.7% | 18.8%(-16.2)#49 | 16.9%(-14.2)#1,019 |
| 50. | Landen | 2.7% | 18.8%(-16.1)#50 | 16.9%(-14.2)#1,046 |
| 51. | Trenton | 2.8% | 18.8%(-16.0)#51 | 16.9%(-14.1)#1,127 |
| 52. | Woodstock | 2.9% | 18.8%(-15.9)#52 | 16.9%(-14.0)#1,190 |
| 53. | Blue Ash | 3.0% | 18.8%(-15.9)#53 | 16.9%(-14.0)#1,192 |
| 54. | Mount Gilead | 3.0% | 18.8%(-15.9)#54 | 16.9%(-13.9)#1,196 |
| 55. | Pigeon Creek | 3.0% | 18.8%(-15.9)#55 | 16.9%(-13.9)#1,199 |
| 56. | Norton | 3.0% | 18.8%(-15.9)#56 | 16.9%(-13.9)#1,200 |
| 57. | Port Washington | 3.0% | 18.8%(-15.8)#57 | 16.9%(-13.9)#1,227 |
| 58. | Hudson | 3.1% | 18.8%(-15.8)#58 | 16.9%(-13.8)#1,273 |
| 59. | Groveport | 3.1% | 18.8%(-15.7)#59 | 16.9%(-13.8)#1,293 |
| 60. | Nashville | 3.1% | 18.8%(-15.7)#60 | 16.9%(-13.8)#1,298 |
| 61. | Sylvania | 3.1% | 18.8%(-15.7)#61 | 16.9%(-13.8)#1,308 |
| 62. | Taylor Creek | 3.1% | 18.8%(-15.7)#62 | 16.9%(-13.8)#1,312 |
| 63. | Amanda | 3.1% | 18.8%(-15.7)#63 | 16.9%(-13.8)#1,317 |
| 64. | Yellow Springs | 3.2% | 18.8%(-15.7)#64 | 16.9%(-13.8)#1,332 |
| 65. | Fort Loramie | 3.2% | 18.8%(-15.7)#65 | 16.9%(-13.7)#1,336 |
| 66. | Gahanna | 3.2% | 18.8%(-15.6)#66 | 16.9%(-13.7)#1,346 |
| 67. | Springboro | 3.2% | 18.8%(-15.6)#67 | 16.9%(-13.7)#1,355 |
| 68. | Richville | 3.2% | 18.8%(-15.6)#68 | 16.9%(-13.7)#1,369 |
| 69. | Adena | 3.2% | 18.8%(-15.6)#69 | 16.9%(-13.7)#1,373 |
| 70. | Solon | 3.3% | 18.8%(-15.5)#70 | 16.9%(-13.6)#1,427 |
| 71. | Maumee | 3.3% | 18.8%(-15.5)#71 | 16.9%(-13.6)#1,437 |
| 72. | Forestville | 3.3% | 18.8%(-15.5)#72 | 16.9%(-13.6)#1,458 |
| 73. | Elmore | 3.3% | 18.8%(-15.5)#73 | 16.9%(-13.6)#1,459 |
| 74. | Wauseon | 3.4% | 18.8%(-15.4)#74 | 16.9%(-13.5)#1,477 |
| 75. | Fairfax | 3.6% | 18.8%(-15.3)#75 | 16.9%(-13.4)#1,570 |
| 76. | Bellville | 3.6% | 18.8%(-15.3)#76 | 16.9%(-13.3)#1,573 |
| 77. | Waynesfield | 3.7% | 18.8%(-15.2)#77 | 16.9%(-13.2)#1,635 |
| 78. | Eastlake | 3.7% | 18.8%(-15.1)#78 | 16.9%(-13.2)#1,641 |
| 79. | Dupont | 3.7% | 18.8%(-15.1)#79 | 16.9%(-13.2)#1,663 |
| 80. | Mccomb | 3.7% | 18.8%(-15.1)#80 | 16.9%(-13.2)#1,676 |
| 81. | Mason | 3.8% | 18.8%(-15.0)#81 | 16.9%(-13.1)#1,701 |
| 82. | Fort Shawnee | 3.8% | 18.8%(-15.0)#82 | 16.9%(-13.1)#1,723 |
| 83. | Pleasant Hill | 3.9% | 18.8%(-14.9)#83 | 16.9%(-13.0)#1,776 |
| 84. | Mineral Ridge | 4.0% | 18.8%(-14.8)#84 | 16.9%(-12.9)#1,839 |
| 85. | Monroeville | 4.0% | 18.8%(-14.8)#85 | 16.9%(-12.9)#1,854 |
| 86. | Marble Cliff | 4.1% | 18.8%(-14.7)#86 | 16.9%(-12.8)#1,871 |
| 87. | Mentor | 4.2% | 18.8%(-14.7)#87 | 16.9%(-12.7)#1,893 |
| 88. | Maineville | 4.2% | 18.8%(-14.6)#88 | 16.9%(-12.7)#1,959 |
| 89. | Willowick | 4.3% | 18.8%(-14.6)#89 | 16.9%(-12.6)#1,967 |
| 90. | Shreve | 4.3% | 18.8%(-14.5)#90 | 16.9%(-12.6)#1,999 |
| 91. | Brooklyn Heights | 4.3% | 18.8%(-14.5)#91 | 16.9%(-12.6)#2,005 |
| 92. | Ottawa Hills | 4.3% | 18.8%(-14.5)#92 | 16.9%(-12.6)#2,014 |
| 93. | Pandora | 4.4% | 18.8%(-14.4)#93 | 16.9%(-12.5)#2,042 |
| 94. | East Palestine | 4.5% | 18.8%(-14.3)#94 | 16.9%(-12.4)#2,119 |
| 95. | St Paris | 4.6% | 18.8%(-14.3)#95 | 16.9%(-12.3)#2,152 |
| 96. | Green | 4.6% | 18.8%(-14.2)#96 | 16.9%(-12.3)#2,155 |
| 97. | Stow | 4.6% | 18.8%(-14.2)#97 | 16.9%(-12.3)#2,174 |
| 98. | Magnolia | 4.6% | 18.8%(-14.2)#98 | 16.9%(-12.3)#2,179 |
| 99. | Buchtel | 4.7% | 18.8%(-14.2)#99 | 16.9%(-12.3)#2,197 |
| 100. | Columbiana | 4.7% | 18.8%(-14.1)#100 | 16.9%(-12.2)#2,222 |
Common Questions
What are the Top 10 Cities with the Lowest Child Poverty Level Among Boys Under the Age of 16 in Ohio?
Top 10 Cities with the Lowest Child Poverty Level Among Boys Under the Age of 16 in Ohio are:
#1
0.59%
#2
0.63%
#3
0.70%
#4
0.78%
#5
0.98%
#6
1.1%
#7
1.2%
#8
1.3%
#9
1.3%
#10
1.4%
What city has the Lowest Child Poverty Level Among Boys Under the Age of 16 in Ohio?
Brecksville has the Lowest Child Poverty Level Among Boys Under the Age of 16 in Ohio with 0.59%.
What is the Poverty Level Among Boys Under the Age of 16 in the State of Ohio?
Poverty Level Among Boys Under the Age of 16 in Ohio is 18.8%.
What is the Poverty Level Among Boys Under the Age of 16 in the United States?
Poverty Level Among Boys Under the Age of 16 in the United States is 16.9%.