Cities with the Lowest Child Poverty Level Among Boys Under the Age of 16 in Massachusetts
RELATED REPORTS & OPTIONS
Lowest Poverty | Boys 0-16
Massachusetts
Compare Cities
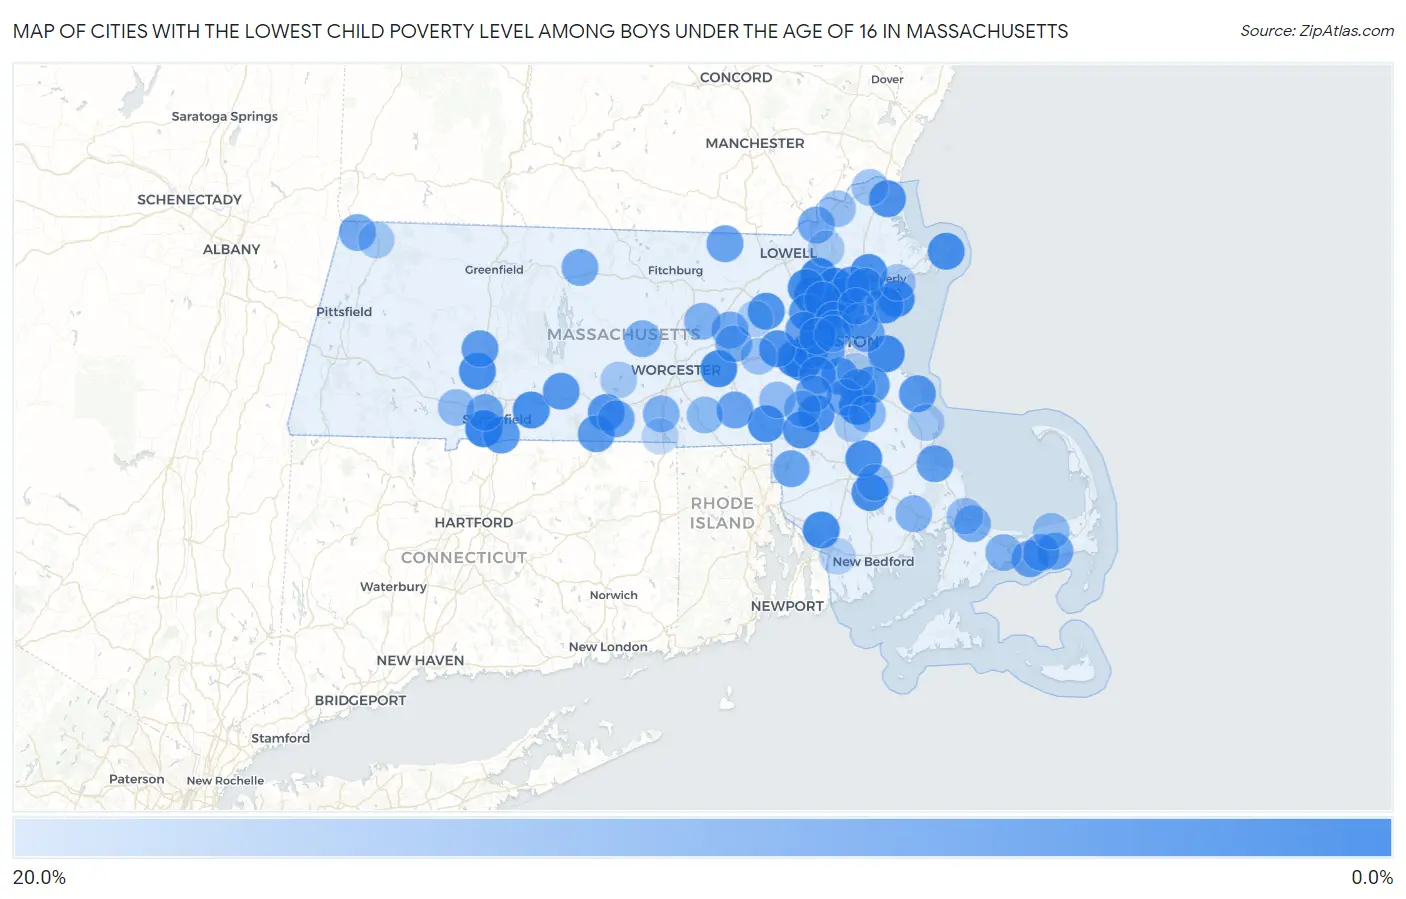
Map of Cities with the Lowest Child Poverty Level Among Boys Under the Age of 16 in Massachusetts
20.0%
0.0%
Cities with the Lowest Child Poverty Level Among Boys Under the Age of 16 in Massachusetts
| City | Child Poverty (Boys) | vs State | vs National | |
| 1. | Needham | 0.83% | 12.1%(-11.3)#1 | 16.9%(-16.1)#120 |
| 2. | Wilmington | 1.1% | 12.1%(-11.0)#2 | 16.9%(-15.8)#201 |
| 3. | Agawam Town | 1.2% | 12.1%(-10.9)#3 | 16.9%(-15.7)#264 |
| 4. | Holbrook | 1.3% | 12.1%(-10.8)#4 | 16.9%(-15.6)#307 |
| 5. | Reading | 1.9% | 12.1%(-10.2)#5 | 16.9%(-15.0)#564 |
| 6. | Marblehead | 1.9% | 12.1%(-10.2)#6 | 16.9%(-15.0)#602 |
| 7. | Winchester | 2.0% | 12.1%(-10.2)#7 | 16.9%(-14.9)#612 |
| 8. | Burlington | 2.0% | 12.1%(-10.1)#8 | 16.9%(-14.9)#635 |
| 9. | Westborough | 2.1% | 12.1%(-10.0)#9 | 16.9%(-14.8)#692 |
| 10. | Belmont | 2.1% | 12.1%(-10.0)#10 | 16.9%(-14.8)#696 |
| 11. | Somerset | 2.3% | 12.1%(-9.81)#11 | 16.9%(-14.6)#827 |
| 12. | Swampscott | 2.4% | 12.1%(-9.73)#12 | 16.9%(-14.5)#873 |
| 13. | Hull | 2.4% | 12.1%(-9.72)#13 | 16.9%(-14.5)#878 |
| 14. | Franklin Town | 2.9% | 12.1%(-9.27)#14 | 16.9%(-14.0)#1,132 |
| 15. | Stoneham | 2.9% | 12.1%(-9.24)#15 | 16.9%(-14.0)#1,157 |
| 16. | Wellesley | 2.9% | 12.1%(-9.23)#16 | 16.9%(-14.0)#1,162 |
| 17. | Wilbraham | 2.9% | 12.1%(-9.19)#17 | 16.9%(-14.0)#1,178 |
| 18. | North Lakeville | 3.0% | 12.1%(-9.14)#18 | 16.9%(-13.9)#1,219 |
| 19. | Arlington | 3.0% | 12.1%(-9.12)#19 | 16.9%(-13.9)#1,229 |
| 20. | Pinehurst | 3.1% | 12.1%(-9.05)#20 | 16.9%(-13.8)#1,278 |
| 21. | Rockport | 3.2% | 12.1%(-8.95)#21 | 16.9%(-13.7)#1,342 |
| 22. | Easthampton Town | 3.2% | 12.1%(-8.90)#22 | 16.9%(-13.7)#1,367 |
| 23. | Bridgewater Town | 3.2% | 12.1%(-8.90)#23 | 16.9%(-13.7)#1,368 |
| 24. | Newton | 3.2% | 12.1%(-8.89)#24 | 16.9%(-13.7)#1,382 |
| 25. | Danvers | 3.2% | 12.1%(-8.87)#25 | 16.9%(-13.7)#1,393 |
| 26. | Sharon | 3.3% | 12.1%(-8.84)#26 | 16.9%(-13.6)#1,412 |
| 27. | Melrose | 3.3% | 12.1%(-8.80)#27 | 16.9%(-13.6)#1,439 |
| 28. | Wakefield | 3.5% | 12.1%(-8.62)#28 | 16.9%(-13.4)#1,545 |
| 29. | Cochituate | 3.7% | 12.1%(-8.43)#29 | 16.9%(-13.2)#1,649 |
| 30. | Newburyport | 3.8% | 12.1%(-8.30)#30 | 16.9%(-13.1)#1,721 |
| 31. | West Concord | 3.9% | 12.1%(-8.17)#31 | 16.9%(-13.0)#1,797 |
| 32. | Foxborough | 4.1% | 12.1%(-8.00)#32 | 16.9%(-12.8)#1,885 |
| 33. | Milton | 4.2% | 12.1%(-7.90)#33 | 16.9%(-12.7)#1,942 |
| 34. | Fiskdale | 4.7% | 12.1%(-7.44)#34 | 16.9%(-12.2)#2,209 |
| 35. | Lexington | 4.7% | 12.1%(-7.42)#35 | 16.9%(-12.2)#2,221 |
| 36. | Scituate | 4.8% | 12.1%(-7.29)#36 | 16.9%(-12.1)#2,286 |
| 37. | Palmer Town | 5.0% | 12.1%(-7.14)#37 | 16.9%(-11.9)#2,373 |
| 38. | Weymouth Town | 5.0% | 12.1%(-7.08)#38 | 16.9%(-11.9)#2,421 |
| 39. | Longmeadow | 5.2% | 12.1%(-6.93)#39 | 16.9%(-11.7)#2,516 |
| 40. | Lynnfield | 5.2% | 12.1%(-6.87)#40 | 16.9%(-11.7)#2,554 |
| 41. | Amherst | 5.3% | 12.1%(-6.82)#41 | 16.9%(-11.6)#2,589 |
| 42. | Brookline | 5.5% | 12.1%(-6.63)#42 | 16.9%(-11.4)#2,718 |
| 43. | Holland | 5.6% | 12.1%(-6.57)#43 | 16.9%(-11.3)#2,745 |
| 44. | North Attleborough | 5.6% | 12.1%(-6.56)#44 | 16.9%(-11.3)#2,762 |
| 45. | Northampton | 5.9% | 12.1%(-6.19)#45 | 16.9%(-11.0)#2,972 |
| 46. | Plymouth | 6.2% | 12.1%(-5.87)#46 | 16.9%(-10.7)#3,139 |
| 47. | West Yarmouth | 6.5% | 12.1%(-5.58)#47 | 16.9%(-10.4)#3,342 |
| 48. | Woburn | 6.7% | 12.1%(-5.41)#48 | 16.9%(-10.2)#3,437 |
| 49. | Dedham | 6.8% | 12.1%(-5.27)#49 | 16.9%(-10.1)#3,519 |
| 50. | Waltham | 6.9% | 12.1%(-5.27)#50 | 16.9%(-10.0)#3,523 |
| 51. | Hopedale | 7.0% | 12.1%(-5.13)#51 | 16.9%(-9.91)#3,598 |
| 52. | Braintree Town | 7.0% | 12.1%(-5.08)#52 | 16.9%(-9.87)#3,625 |
| 53. | Peabody | 7.1% | 12.1%(-5.03)#53 | 16.9%(-9.81)#3,661 |
| 54. | Pepperell | 7.1% | 12.1%(-5.02)#54 | 16.9%(-9.81)#3,663 |
| 55. | Attleboro | 7.1% | 12.1%(-4.97)#55 | 16.9%(-9.75)#3,712 |
| 56. | Medford | 7.3% | 12.1%(-4.80)#56 | 16.9%(-9.58)#3,800 |
| 57. | West Springfield Town | 7.5% | 12.1%(-4.66)#57 | 16.9%(-9.44)#3,876 |
| 58. | Dennis Port | 7.5% | 12.1%(-4.62)#58 | 16.9%(-9.40)#3,890 |
| 59. | Sturbridge | 7.7% | 12.1%(-4.47)#59 | 16.9%(-9.25)#3,968 |
| 60. | Randolph Town | 7.7% | 12.1%(-4.43)#60 | 16.9%(-9.21)#4,030 |
| 61. | Hudson | 8.0% | 12.1%(-4.09)#61 | 16.9%(-8.88)#4,200 |
| 62. | Norwood | 8.1% | 12.1%(-4.04)#62 | 16.9%(-8.82)#4,225 |
| 63. | South Yarmouth | 8.1% | 12.1%(-4.01)#63 | 16.9%(-8.79)#4,243 |
| 64. | Methuen Town | 8.2% | 12.1%(-3.92)#64 | 16.9%(-8.70)#4,289 |
| 65. | Winthrop Town | 8.4% | 12.1%(-3.68)#65 | 16.9%(-8.46)#4,454 |
| 66. | Williamstown | 8.5% | 12.1%(-3.62)#66 | 16.9%(-8.41)#4,484 |
| 67. | Athol | 8.8% | 12.1%(-3.37)#67 | 16.9%(-8.15)#4,639 |
| 68. | Marlborough | 8.8% | 12.1%(-3.28)#68 | 16.9%(-8.07)#4,691 |
| 69. | Sandwich | 9.1% | 12.1%(-3.03)#69 | 16.9%(-7.81)#4,795 |
| 70. | Rutland | 9.6% | 12.1%(-2.50)#70 | 16.9%(-7.28)#5,131 |
| 71. | Clinton | 9.9% | 12.1%(-2.19)#71 | 16.9%(-6.97)#5,282 |
| 72. | Oxford | 10.0% | 12.1%(-2.12)#72 | 16.9%(-6.90)#5,314 |
| 73. | Barnstable Town | 10.3% | 12.1%(-1.83)#73 | 16.9%(-6.62)#5,490 |
| 74. | West Wareham | 10.6% | 12.1%(-1.48)#74 | 16.9%(-6.27)#5,681 |
| 75. | Somerville | 10.7% | 12.1%(-1.38)#75 | 16.9%(-6.16)#5,742 |
| 76. | Walpole | 11.0% | 12.1%(-1.12)#76 | 16.9%(-5.91)#5,857 |
| 77. | Watertown Town | 11.1% | 12.1%(-1.05)#77 | 16.9%(-5.83)#5,880 |
| 78. | Whitinsville | 11.5% | 12.1%(-0.615)#78 | 16.9%(-5.40)#6,103 |
| 79. | Abington | 11.5% | 12.1%(-0.586)#79 | 16.9%(-5.37)#6,112 |
| 80. | Westfield | 11.8% | 12.1%(-0.358)#80 | 16.9%(-5.14)#6,228 |
| 81. | Millis Clicquot | 12.2% | 12.1%(+0.036)#81 | 16.9%(-4.75)#6,448 |
| 82. | Revere | 12.3% | 12.1%(+0.172)#82 | 16.9%(-4.61)#6,509 |
| 83. | East Dennis | 12.3% | 12.1%(+0.217)#83 | 16.9%(-4.57)#6,529 |
| 84. | Middleborough Center | 12.4% | 12.1%(+0.271)#84 | 16.9%(-4.51)#6,554 |
| 85. | Saugus | 12.6% | 12.1%(+0.452)#85 | 16.9%(-4.33)#6,680 |
| 86. | Sagamore | 12.9% | 12.1%(+0.770)#86 | 16.9%(-4.01)#6,821 |
| 87. | Haverhill | 12.9% | 12.1%(+0.792)#87 | 16.9%(-3.99)#6,834 |
| 88. | Cambridge | 13.0% | 12.1%(+0.897)#88 | 16.9%(-3.89)#6,869 |
| 89. | Amesbury Town | 13.2% | 12.1%(+1.05)#89 | 16.9%(-3.73)#6,960 |
| 90. | Framingham | 13.4% | 12.1%(+1.28)#90 | 16.9%(-3.50)#7,079 |
| 91. | Beverly | 14.2% | 12.1%(+2.04)#91 | 16.9%(-2.74)#7,446 |
| 92. | Marshfield | 14.5% | 12.1%(+2.33)#92 | 16.9%(-2.45)#7,601 |
| 93. | Andover | 14.5% | 12.1%(+2.37)#93 | 16.9%(-2.41)#7,619 |
| 94. | East Brookfield | 14.6% | 12.1%(+2.44)#94 | 16.9%(-2.34)#7,655 |
| 95. | Brockton | 14.6% | 12.1%(+2.49)#95 | 16.9%(-2.30)#7,680 |
| 96. | North Adams | 14.7% | 12.1%(+2.55)#96 | 16.9%(-2.23)#7,711 |
| 97. | Maynard | 15.6% | 12.1%(+3.48)#97 | 16.9%(-1.30)#8,126 |
| 98. | North Westport | 16.2% | 12.1%(+4.08)#98 | 16.9%(-0.704)#8,416 |
| 99. | Quincy | 16.3% | 12.1%(+4.16)#99 | 16.9%(-0.624)#8,464 |
| 100. | Webster | 17.0% | 12.1%(+4.83)#100 | 16.9%(+0.052)#8,774 |
Common Questions
What are the Top 10 Cities with the Lowest Child Poverty Level Among Boys Under the Age of 16 in Massachusetts?
Top 10 Cities with the Lowest Child Poverty Level Among Boys Under the Age of 16 in Massachusetts are:
#1
0.83%
#2
1.1%
#3
1.2%
#4
1.3%
#5
1.9%
#6
1.9%
#7
2.0%
#8
2.0%
#9
2.1%
#10
2.1%
What city has the Lowest Child Poverty Level Among Boys Under the Age of 16 in Massachusetts?
Needham has the Lowest Child Poverty Level Among Boys Under the Age of 16 in Massachusetts with 0.83%.
What is the Poverty Level Among Boys Under the Age of 16 in the State of Massachusetts?
Poverty Level Among Boys Under the Age of 16 in Massachusetts is 12.1%.
What is the Poverty Level Among Boys Under the Age of 16 in the United States?
Poverty Level Among Boys Under the Age of 16 in the United States is 16.9%.