Cities with the Lowest Child Poverty Level Among Boys Under the Age of 16 in Oklahoma
RELATED REPORTS & OPTIONS
Lowest Poverty | Boys 0-16
Oklahoma
Compare Cities
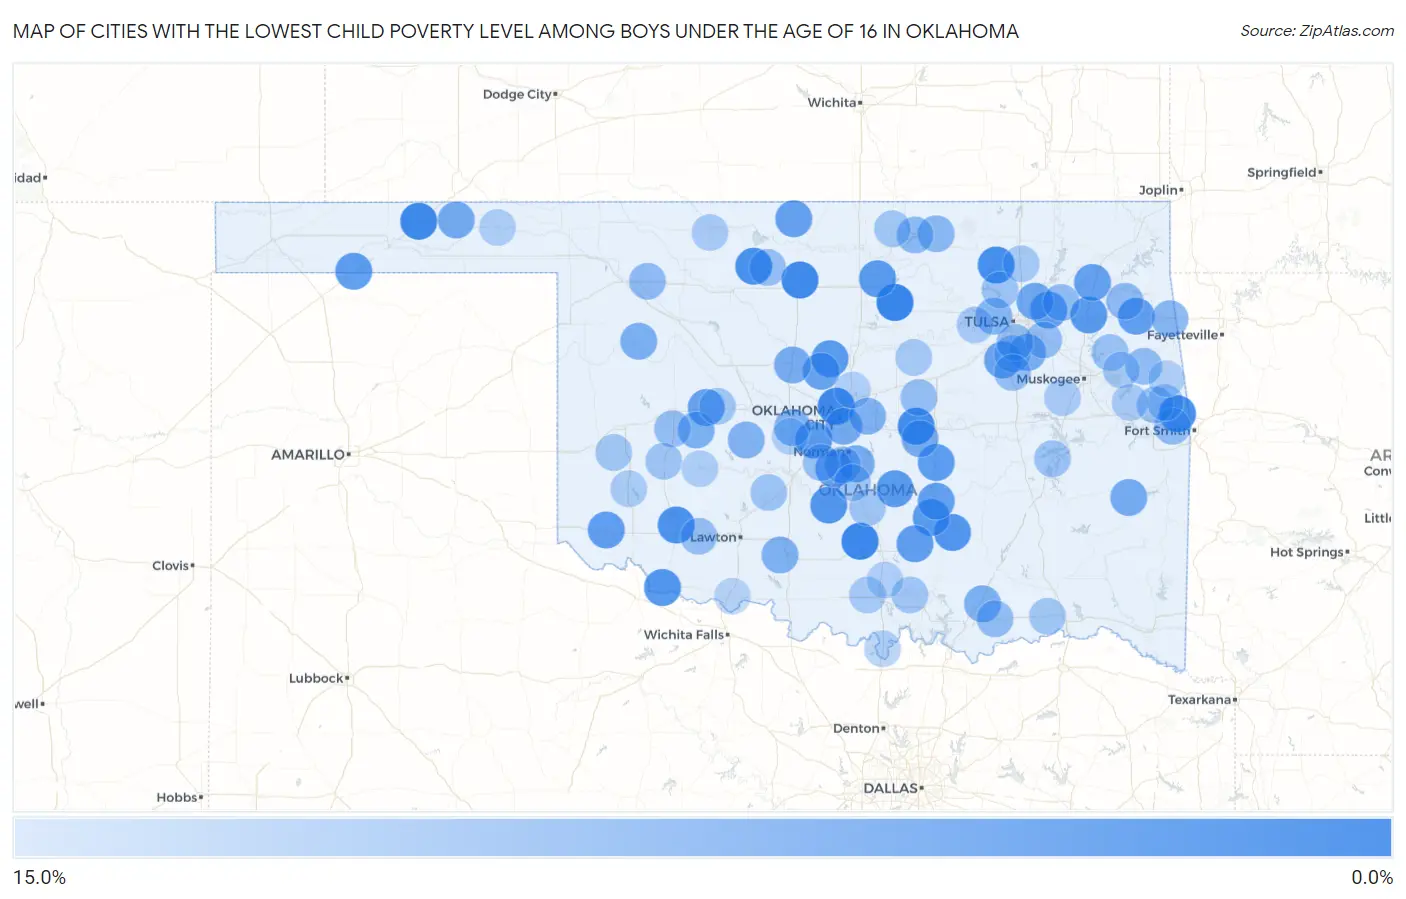
Map of Cities with the Lowest Child Poverty Level Among Boys Under the Age of 16 in Oklahoma
15.0%
0.0%
Cities with the Lowest Child Poverty Level Among Boys Under the Age of 16 in Oklahoma
| City | Child Poverty (Boys) | vs State | vs National | |
| 1. | Morrison | 0.96% | 20.6%(-19.6)#1 | 16.9%(-15.9)#154 |
| 2. | Katie | 1.4% | 20.6%(-19.2)#2 | 16.9%(-15.5)#348 |
| 3. | Hooker | 1.6% | 20.6%(-19.0)#3 | 16.9%(-15.3)#386 |
| 4. | North Enid | 1.7% | 20.6%(-18.9)#4 | 16.9%(-15.2)#452 |
| 5. | Nichols Hills | 1.8% | 20.6%(-18.8)#5 | 16.9%(-15.1)#523 |
| 6. | Johnson | 2.0% | 20.6%(-18.6)#6 | 16.9%(-14.9)#653 |
| 7. | Barnsdall | 2.1% | 20.6%(-18.5)#7 | 16.9%(-14.8)#693 |
| 8. | Long | 2.4% | 20.6%(-18.2)#8 | 16.9%(-14.5)#882 |
| 9. | Helena | 2.5% | 20.6%(-18.1)#9 | 16.9%(-14.4)#923 |
| 10. | Mountain Park | 3.0% | 20.6%(-17.6)#10 | 16.9%(-13.9)#1,256 |
| 11. | Stonewall | 3.3% | 20.6%(-17.3)#11 | 16.9%(-13.6)#1,448 |
| 12. | Rocky Point | 3.5% | 20.6%(-17.1)#12 | 16.9%(-13.4)#1,539 |
| 13. | Lindsay | 3.5% | 20.6%(-17.1)#13 | 16.9%(-13.4)#1,562 |
| 14. | Davidson | 3.6% | 20.6%(-17.0)#14 | 16.9%(-13.3)#1,593 |
| 15. | Tuttle | 4.0% | 20.6%(-16.6)#15 | 16.9%(-12.9)#1,850 |
| 16. | Wanette | 4.2% | 20.6%(-16.4)#16 | 16.9%(-12.7)#1,913 |
| 17. | Red Rock | 4.2% | 20.6%(-16.4)#17 | 16.9%(-12.7)#1,914 |
| 18. | Cimarron City | 4.2% | 20.6%(-16.4)#18 | 16.9%(-12.7)#1,916 |
| 19. | Latta | 4.2% | 20.6%(-16.4)#19 | 16.9%(-12.7)#1,930 |
| 20. | Chouteau | 4.2% | 20.6%(-16.4)#20 | 16.9%(-12.7)#1,958 |
| 21. | Bowlegs | 4.3% | 20.6%(-16.3)#21 | 16.9%(-12.6)#2,026 |
| 22. | Texhoma | 4.4% | 20.6%(-16.2)#22 | 16.9%(-12.5)#2,063 |
| 23. | Leach | 4.7% | 20.6%(-16.0)#23 | 16.9%(-12.3)#2,199 |
| 24. | East Duke | 4.8% | 20.6%(-15.8)#24 | 16.9%(-12.1)#2,256 |
| 25. | Hickory | 4.8% | 20.6%(-15.8)#25 | 16.9%(-12.1)#2,263 |
| 26. | Verdigris | 4.9% | 20.6%(-15.7)#26 | 16.9%(-12.0)#2,359 |
| 27. | Adair | 5.1% | 20.6%(-15.6)#27 | 16.9%(-11.9)#2,425 |
| 28. | Byng | 5.1% | 20.6%(-15.5)#28 | 16.9%(-11.8)#2,485 |
| 29. | Wakita | 5.3% | 20.6%(-15.3)#29 | 16.9%(-11.6)#2,570 |
| 30. | Weatherford | 5.3% | 20.6%(-15.3)#30 | 16.9%(-11.6)#2,599 |
| 31. | Cole | 5.4% | 20.6%(-15.3)#31 | 16.9%(-11.5)#2,629 |
| 32. | Cashion | 5.5% | 20.6%(-15.1)#32 | 16.9%(-11.4)#2,706 |
| 33. | Mounds | 5.5% | 20.6%(-15.1)#33 | 16.9%(-11.4)#2,730 |
| 34. | Owasso | 6.1% | 20.6%(-14.6)#34 | 16.9%(-10.8)#3,036 |
| 35. | Turpin | 6.5% | 20.6%(-14.1)#35 | 16.9%(-10.4)#3,312 |
| 36. | Valley Brook | 6.7% | 20.6%(-13.9)#36 | 16.9%(-10.2)#3,403 |
| 37. | Le Flore | 6.7% | 20.6%(-13.9)#37 | 16.9%(-10.2)#3,423 |
| 38. | Earlsboro | 6.9% | 20.6%(-13.7)#38 | 16.9%(-10.0)#3,545 |
| 39. | Bixby | 6.9% | 20.6%(-13.7)#39 | 16.9%(-9.98)#3,565 |
| 40. | Kingfisher | 6.9% | 20.6%(-13.7)#40 | 16.9%(-9.96)#3,574 |
| 41. | Noble | 6.9% | 20.6%(-13.7)#41 | 16.9%(-9.95)#3,580 |
| 42. | Camargo | 7.4% | 20.6%(-13.2)#42 | 16.9%(-9.50)#3,850 |
| 43. | Corn | 7.5% | 20.6%(-13.1)#43 | 16.9%(-9.44)#3,875 |
| 44. | Caddo | 7.6% | 20.6%(-13.0)#44 | 16.9%(-9.31)#3,940 |
| 45. | Union City | 7.7% | 20.6%(-13.0)#45 | 16.9%(-9.25)#3,966 |
| 46. | Choctaw | 7.8% | 20.6%(-12.8)#46 | 16.9%(-9.14)#4,049 |
| 47. | Empire City | 7.8% | 20.6%(-12.8)#47 | 16.9%(-9.09)#4,074 |
| 48. | Binger | 8.0% | 20.6%(-12.6)#48 | 16.9%(-8.90)#4,179 |
| 49. | Sand Springs | 8.3% | 20.6%(-12.3)#49 | 16.9%(-8.56)#4,407 |
| 50. | West Siloam Springs | 8.5% | 20.6%(-12.1)#50 | 16.9%(-8.38)#4,501 |
| 51. | Shidler | 8.8% | 20.6%(-11.8)#51 | 16.9%(-8.13)#4,649 |
| 52. | Kaw City | 9.1% | 20.6%(-11.5)#52 | 16.9%(-7.81)#4,830 |
| 53. | Goldsby | 9.2% | 20.6%(-11.4)#53 | 16.9%(-7.68)#4,922 |
| 54. | Kenwood | 9.3% | 20.6%(-11.3)#54 | 16.9%(-7.59)#4,975 |
| 55. | Mooreland | 9.3% | 20.6%(-11.3)#55 | 16.9%(-7.56)#4,989 |
| 56. | Caney | 9.4% | 20.6%(-11.2)#56 | 16.9%(-7.47)#5,038 |
| 57. | Glenpool | 9.5% | 20.6%(-11.1)#57 | 16.9%(-7.42)#5,056 |
| 58. | Bokchito | 9.5% | 20.6%(-11.1)#58 | 16.9%(-7.38)#5,080 |
| 59. | Justice | 9.7% | 20.6%(-11.0)#59 | 16.9%(-7.25)#5,144 |
| 60. | Muldrow | 9.8% | 20.6%(-10.8)#60 | 16.9%(-7.12)#5,215 |
| 61. | Broken Arrow | 9.8% | 20.6%(-10.8)#61 | 16.9%(-7.10)#5,231 |
| 62. | Jenks | 9.9% | 20.6%(-10.7)#62 | 16.9%(-6.95)#5,291 |
| 63. | Winchester | 10.0% | 20.6%(-10.6)#63 | 16.9%(-6.90)#5,335 |
| 64. | Indiahoma | 10.0% | 20.6%(-10.6)#64 | 16.9%(-6.90)#5,347 |
| 65. | Goltry | 10.0% | 20.6%(-10.6)#65 | 16.9%(-6.90)#5,349 |
| 66. | Bessie | 10.0% | 20.6%(-10.6)#66 | 16.9%(-6.90)#5,352 |
| 67. | Sparks | 10.0% | 20.6%(-10.6)#67 | 16.9%(-6.90)#5,364 |
| 68. | Blanchard | 10.2% | 20.6%(-10.4)#68 | 16.9%(-6.72)#5,439 |
| 69. | Hulbert | 10.3% | 20.6%(-10.3)#69 | 16.9%(-6.56)#5,519 |
| 70. | Brushy | 10.4% | 20.6%(-10.2)#70 | 16.9%(-6.50)#5,543 |
| 71. | Purcell | 10.5% | 20.6%(-10.1)#71 | 16.9%(-6.44)#5,586 |
| 72. | Cement | 10.5% | 20.6%(-10.1)#72 | 16.9%(-6.38)#5,620 |
| 73. | Canadian | 10.5% | 20.6%(-10.1)#73 | 16.9%(-6.38)#5,631 |
| 74. | Skiatook | 10.5% | 20.6%(-10.1)#74 | 16.9%(-6.37)#5,635 |
| 75. | Rocky | 10.7% | 20.6%(-9.89)#75 | 16.9%(-6.19)#5,733 |
| 76. | Shady Grove Cdp Cherokee County | 10.8% | 20.6%(-9.80)#76 | 16.9%(-6.09)#5,773 |
| 77. | Paoli | 10.8% | 20.6%(-9.76)#77 | 16.9%(-6.06)#5,790 |
| 78. | Mannsville | 10.9% | 20.6%(-9.70)#78 | 16.9%(-5.99)#5,820 |
| 79. | Soper | 11.1% | 20.6%(-9.50)#79 | 16.9%(-5.79)#5,933 |
| 80. | Stoney Point | 11.1% | 20.6%(-9.50)#80 | 16.9%(-5.79)#5,937 |
| 81. | Carter | 11.1% | 20.6%(-9.50)#81 | 16.9%(-5.79)#5,939 |
| 82. | Kildare | 11.1% | 20.6%(-9.50)#82 | 16.9%(-5.79)#5,944 |
| 83. | Hydro | 11.2% | 20.6%(-9.40)#83 | 16.9%(-5.70)#5,968 |
| 84. | Lone Grove | 11.5% | 20.6%(-9.13)#84 | 16.9%(-5.42)#6,090 |
| 85. | Ramona | 11.5% | 20.6%(-9.07)#85 | 16.9%(-5.37)#6,118 |
| 86. | Agra | 11.5% | 20.6%(-9.07)#86 | 16.9%(-5.37)#6,120 |
| 87. | Zeb | 11.5% | 20.6%(-9.07)#87 | 16.9%(-5.37)#6,122 |
| 88. | Alva | 11.7% | 20.6%(-8.91)#88 | 16.9%(-5.20)#6,205 |
| 89. | Mannford | 11.7% | 20.6%(-8.88)#89 | 16.9%(-5.18)#6,213 |
| 90. | Box | 11.8% | 20.6%(-8.84)#90 | 16.9%(-5.14)#6,261 |
| 91. | Wainwright | 11.8% | 20.6%(-8.84)#91 | 16.9%(-5.14)#6,262 |
| 92. | Granite | 11.9% | 20.6%(-8.67)#92 | 16.9%(-4.96)#6,341 |
| 93. | Beaver | 12.1% | 20.6%(-8.47)#93 | 16.9%(-4.77)#6,442 |
| 94. | Mountain View | 12.2% | 20.6%(-8.41)#94 | 16.9%(-4.71)#6,469 |
| 95. | Thackerville | 12.2% | 20.6%(-8.41)#95 | 16.9%(-4.71)#6,471 |
| 96. | Cherry Tree | 12.2% | 20.6%(-8.39)#96 | 16.9%(-4.68)#6,487 |
| 97. | Minco | 12.4% | 20.6%(-8.21)#97 | 16.9%(-4.50)#6,561 |
| 98. | Springer | 12.5% | 20.6%(-8.11)#98 | 16.9%(-4.40)#6,612 |
| 99. | Edmond | 12.6% | 20.6%(-8.01)#99 | 16.9%(-4.30)#6,688 |
| 100. | Randlett | 12.9% | 20.6%(-7.70)#100 | 16.9%(-4.00)#6,831 |
Common Questions
What are the Top 10 Cities with the Lowest Child Poverty Level Among Boys Under the Age of 16 in Oklahoma?
Top 10 Cities with the Lowest Child Poverty Level Among Boys Under the Age of 16 in Oklahoma are:
#1
0.96%
#2
1.4%
#3
1.6%
#4
1.7%
#5
1.8%
#6
2.0%
#7
2.1%
#8
2.4%
#9
2.5%
#10
3.0%
What city has the Lowest Child Poverty Level Among Boys Under the Age of 16 in Oklahoma?
Morrison has the Lowest Child Poverty Level Among Boys Under the Age of 16 in Oklahoma with 0.96%.
What is the Poverty Level Among Boys Under the Age of 16 in the State of Oklahoma?
Poverty Level Among Boys Under the Age of 16 in Oklahoma is 20.6%.
What is the Poverty Level Among Boys Under the Age of 16 in the United States?
Poverty Level Among Boys Under the Age of 16 in the United States is 16.9%.