Cities with the Lowest Child Poverty Level Among Boys Under the Age of 16 in Louisiana
RELATED REPORTS & OPTIONS
Lowest Poverty | Boys 0-16
Louisiana
Compare Cities
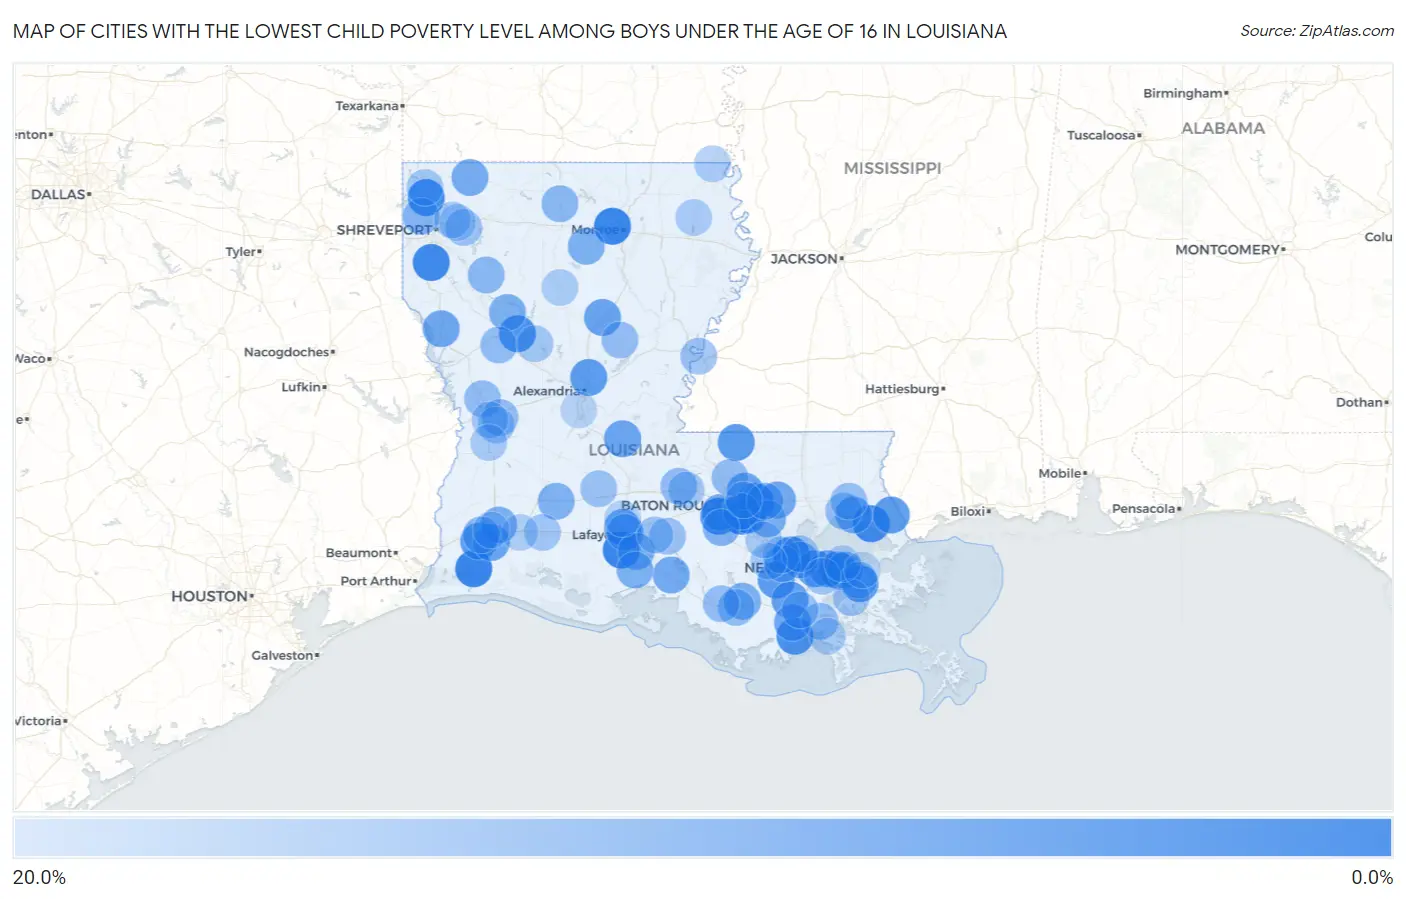
Map of Cities with the Lowest Child Poverty Level Among Boys Under the Age of 16 in Louisiana
20.0%
0.0%
Cities with the Lowest Child Poverty Level Among Boys Under the Age of 16 in Louisiana
| City | Child Poverty (Boys) | vs State | vs National | |
| 1. | Hackberry | 0.85% | 26.5%(-25.7)#1 | 16.9%(-16.1)#123 |
| 2. | Maurice | 1.3% | 26.5%(-25.3)#2 | 16.9%(-15.6)#288 |
| 3. | Claiborne | 1.3% | 26.5%(-25.2)#3 | 16.9%(-15.6)#293 |
| 4. | Lacombe | 2.1% | 26.5%(-24.4)#4 | 16.9%(-14.8)#704 |
| 5. | Garyville | 2.1% | 26.5%(-24.4)#5 | 16.9%(-14.8)#718 |
| 6. | Stonewall | 2.2% | 26.5%(-24.3)#6 | 16.9%(-14.7)#753 |
| 7. | Oak Hills Place | 2.3% | 26.5%(-24.3)#7 | 16.9%(-14.6)#789 |
| 8. | Addis | 2.3% | 26.5%(-24.2)#8 | 16.9%(-14.6)#838 |
| 9. | Belcher | 2.6% | 26.5%(-24.0)#9 | 16.9%(-14.3)#977 |
| 10. | Denham Springs | 3.3% | 26.5%(-23.2)#10 | 16.9%(-13.6)#1,434 |
| 11. | Chauvin | 4.0% | 26.5%(-22.5)#11 | 16.9%(-12.9)#1,852 |
| 12. | Vienna Bend | 4.5% | 26.5%(-22.1)#12 | 16.9%(-12.4)#2,095 |
| 13. | Village St George | 4.7% | 26.5%(-21.8)#13 | 16.9%(-12.2)#2,219 |
| 14. | Old Jefferson | 4.9% | 26.5%(-21.7)#14 | 16.9%(-12.0)#2,304 |
| 15. | Harahan | 5.4% | 26.5%(-21.2)#15 | 16.9%(-11.5)#2,637 |
| 16. | Belle Chasse | 5.7% | 26.5%(-20.9)#16 | 16.9%(-11.2)#2,810 |
| 17. | Wilson | 5.8% | 26.5%(-20.7)#17 | 16.9%(-11.1)#2,894 |
| 18. | Ball | 6.1% | 26.5%(-20.5)#18 | 16.9%(-10.8)#3,035 |
| 19. | Hahnville | 6.1% | 26.5%(-20.5)#19 | 16.9%(-10.8)#3,038 |
| 20. | Carlyss | 6.2% | 26.5%(-20.4)#20 | 16.9%(-10.7)#3,096 |
| 21. | Chackbay | 6.3% | 26.5%(-20.2)#21 | 16.9%(-10.6)#3,219 |
| 22. | Pearl River | 6.5% | 26.5%(-20.1)#22 | 16.9%(-10.4)#3,300 |
| 23. | River Ridge | 7.4% | 26.5%(-19.1)#23 | 16.9%(-9.51)#3,831 |
| 24. | Raceland | 7.4% | 26.5%(-19.1)#24 | 16.9%(-9.49)#3,853 |
| 25. | Urania | 7.9% | 26.5%(-18.6)#25 | 16.9%(-9.01)#4,114 |
| 26. | St Rose | 8.2% | 26.5%(-18.4)#26 | 16.9%(-8.73)#4,268 |
| 27. | Ossun | 8.3% | 26.5%(-18.3)#27 | 16.9%(-8.65)#4,309 |
| 28. | Evergreen | 8.3% | 26.5%(-18.2)#28 | 16.9%(-8.57)#4,388 |
| 29. | Prien | 8.4% | 26.5%(-18.2)#29 | 16.9%(-8.54)#4,412 |
| 30. | Central | 8.4% | 26.5%(-18.2)#30 | 16.9%(-8.53)#4,416 |
| 31. | Converse | 8.9% | 26.5%(-17.6)#31 | 16.9%(-8.01)#4,715 |
| 32. | Livingston | 9.2% | 26.5%(-17.4)#32 | 16.9%(-7.74)#4,880 |
| 33. | Bourg | 9.2% | 26.5%(-17.3)#33 | 16.9%(-7.72)#4,893 |
| 34. | Jeanerette | 9.4% | 26.5%(-17.1)#34 | 16.9%(-7.49)#5,027 |
| 35. | Mandeville | 9.6% | 26.5%(-16.9)#35 | 16.9%(-7.28)#5,132 |
| 36. | Scott | 9.7% | 26.5%(-16.8)#36 | 16.9%(-7.18)#5,174 |
| 37. | Port Vincent | 10.0% | 26.5%(-16.5)#37 | 16.9%(-6.90)#5,333 |
| 38. | Sarepta | 10.2% | 26.5%(-16.3)#38 | 16.9%(-6.68)#5,467 |
| 39. | Brusly | 10.5% | 26.5%(-16.0)#39 | 16.9%(-6.36)#5,639 |
| 40. | Youngsville | 10.6% | 26.5%(-15.9)#40 | 16.9%(-6.30)#5,659 |
| 41. | Inniswold | 10.7% | 26.5%(-15.8)#41 | 16.9%(-6.22)#5,708 |
| 42. | Bayou L Ourse | 10.8% | 26.5%(-15.7)#42 | 16.9%(-6.07)#5,782 |
| 43. | Jefferson | 10.9% | 26.5%(-15.6)#43 | 16.9%(-6.01)#5,811 |
| 44. | Moss Bluff | 11.0% | 26.5%(-15.6)#44 | 16.9%(-5.95)#5,842 |
| 45. | Campti | 11.0% | 26.5%(-15.5)#45 | 16.9%(-5.91)#5,856 |
| 46. | Delcambre | 11.0% | 26.5%(-15.5)#46 | 16.9%(-5.86)#5,869 |
| 47. | Eros | 11.1% | 26.5%(-15.4)#47 | 16.9%(-5.79)#5,929 |
| 48. | Elton | 11.3% | 26.5%(-15.2)#48 | 16.9%(-5.58)#6,014 |
| 49. | Plaquemine | 11.8% | 26.5%(-14.8)#49 | 16.9%(-5.14)#6,232 |
| 50. | Walker | 12.1% | 26.5%(-14.4)#50 | 16.9%(-4.79)#6,430 |
| 51. | Blanchard | 12.1% | 26.5%(-14.4)#51 | 16.9%(-4.79)#6,432 |
| 52. | Edgard | 12.3% | 26.5%(-14.2)#52 | 16.9%(-4.61)#6,512 |
| 53. | Sulphur | 12.4% | 26.5%(-14.2)#53 | 16.9%(-4.53)#6,542 |
| 54. | Dubach | 12.8% | 26.5%(-13.8)#54 | 16.9%(-4.14)#6,751 |
| 55. | Hall Summit | 12.8% | 26.5%(-13.7)#55 | 16.9%(-4.08)#6,786 |
| 56. | North Vacherie | 13.1% | 26.5%(-13.4)#56 | 16.9%(-3.78)#6,928 |
| 57. | Timberlane | 13.3% | 26.5%(-13.3)#57 | 16.9%(-3.65)#6,988 |
| 58. | Fordoche | 13.8% | 26.5%(-12.8)#58 | 16.9%(-3.15)#7,254 |
| 59. | Larose | 13.8% | 26.5%(-12.7)#59 | 16.9%(-3.08)#7,296 |
| 60. | Anacoco | 14.0% | 26.5%(-12.5)#60 | 16.9%(-2.89)#7,384 |
| 61. | Zachary | 14.1% | 26.5%(-12.5)#61 | 16.9%(-2.84)#7,407 |
| 62. | Fort Polk North | 14.1% | 26.5%(-12.5)#62 | 16.9%(-2.84)#7,409 |
| 63. | Madisonville | 14.1% | 26.5%(-12.4)#63 | 16.9%(-2.82)#7,420 |
| 64. | Amelia | 14.2% | 26.5%(-12.4)#64 | 16.9%(-2.74)#7,445 |
| 65. | Provencal | 14.3% | 26.5%(-12.2)#65 | 16.9%(-2.62)#7,531 |
| 66. | Jena | 14.4% | 26.5%(-12.1)#66 | 16.9%(-2.50)#7,587 |
| 67. | Berwick | 14.6% | 26.5%(-12.0)#67 | 16.9%(-2.33)#7,663 |
| 68. | Covington | 14.8% | 26.5%(-11.7)#68 | 16.9%(-2.11)#7,756 |
| 69. | Vidalia | 15.2% | 26.5%(-11.4)#69 | 16.9%(-1.74)#7,927 |
| 70. | Catahoula | 15.2% | 26.5%(-11.4)#70 | 16.9%(-1.73)#7,933 |
| 71. | Haughton | 15.3% | 26.5%(-11.3)#71 | 16.9%(-1.65)#7,973 |
| 72. | Lockport Heights | 15.3% | 26.5%(-11.3)#72 | 16.9%(-1.63)#7,981 |
| 73. | Chataignier | 15.4% | 26.5%(-11.1)#73 | 16.9%(-1.52)#8,041 |
| 74. | Parks | 15.5% | 26.5%(-11.0)#74 | 16.9%(-1.39)#8,095 |
| 75. | Lutcher | 15.7% | 26.5%(-10.8)#75 | 16.9%(-1.16)#8,191 |
| 76. | Reserve | 16.1% | 26.5%(-10.4)#76 | 16.9%(-0.810)#8,369 |
| 77. | Fort Polk South | 16.1% | 26.5%(-10.4)#77 | 16.9%(-0.809)#8,371 |
| 78. | Welsh | 16.3% | 26.5%(-10.2)#78 | 16.9%(-0.602)#8,471 |
| 79. | Jean Lafitte | 16.3% | 26.5%(-10.2)#79 | 16.9%(-0.588)#8,475 |
| 80. | Luling | 16.4% | 26.5%(-10.1)#80 | 16.9%(-0.493)#8,526 |
| 81. | Livonia | 16.5% | 26.5%(-10.1)#81 | 16.9%(-0.433)#8,547 |
| 82. | Monticello | 16.6% | 26.5%(-9.95)#82 | 16.9%(-0.327)#8,590 |
| 83. | Montgomery | 16.7% | 26.5%(-9.86)#83 | 16.9%(-0.237)#8,624 |
| 84. | Gilliam | 16.7% | 26.5%(-9.86)#84 | 16.9%(-0.237)#8,679 |
| 85. | Convent | 16.8% | 26.5%(-9.71)#85 | 16.9%(-0.081)#8,726 |
| 86. | New Llano | 17.2% | 26.5%(-9.36)#86 | 16.9%(+0.268)#8,851 |
| 87. | Rosepine | 17.2% | 26.5%(-9.31)#87 | 16.9%(+0.318)#8,866 |
| 88. | Sorrento | 17.4% | 26.5%(-9.16)#88 | 16.9%(+0.465)#8,943 |
| 89. | Eastwood | 17.5% | 26.5%(-9.07)#89 | 16.9%(+0.556)#8,991 |
| 90. | Epps | 17.6% | 26.5%(-8.96)#90 | 16.9%(+0.664)#9,049 |
| 91. | Kilbourne | 17.6% | 26.5%(-8.88)#91 | 16.9%(+0.743)#9,087 |
| 92. | Galliano | 17.7% | 26.5%(-8.80)#92 | 16.9%(+0.823)#9,119 |
| 93. | Red Chute | 17.8% | 26.5%(-8.68)#93 | 16.9%(+0.943)#9,156 |
| 94. | Dodson | 17.9% | 26.5%(-8.67)#94 | 16.9%(+0.953)#9,169 |
| 95. | Iowa | 18.1% | 26.5%(-8.40)#95 | 16.9%(+1.22)#9,260 |
| 96. | Metairie | 18.4% | 26.5%(-8.16)#96 | 16.9%(+1.47)#9,394 |
| 97. | Westlake | 18.9% | 26.5%(-7.65)#97 | 16.9%(+1.98)#9,613 |
| 98. | Cankton | 19.0% | 26.5%(-7.48)#98 | 16.9%(+2.14)#9,674 |
| 99. | Woodworth | 19.3% | 26.5%(-7.24)#99 | 16.9%(+2.38)#9,783 |
| 100. | Arabi | 19.4% | 26.5%(-7.13)#100 | 16.9%(+2.49)#9,831 |
Common Questions
What are the Top 10 Cities with the Lowest Child Poverty Level Among Boys Under the Age of 16 in Louisiana?
Top 10 Cities with the Lowest Child Poverty Level Among Boys Under the Age of 16 in Louisiana are:
#1
0.85%
#2
1.3%
#3
1.3%
#4
2.1%
#5
2.1%
#6
2.2%
#7
2.3%
#8
2.3%
#9
2.6%
#10
3.3%
What city has the Lowest Child Poverty Level Among Boys Under the Age of 16 in Louisiana?
Hackberry has the Lowest Child Poverty Level Among Boys Under the Age of 16 in Louisiana with 0.85%.
What is the Poverty Level Among Boys Under the Age of 16 in the State of Louisiana?
Poverty Level Among Boys Under the Age of 16 in Louisiana is 26.5%.
What is the Poverty Level Among Boys Under the Age of 16 in the United States?
Poverty Level Among Boys Under the Age of 16 in the United States is 16.9%.