Cities with the Lowest Child Poverty Level Among Boys Under the Age of 16 in Alabama
RELATED REPORTS & OPTIONS
Lowest Poverty | Boys 0-16
Alabama
Compare Cities
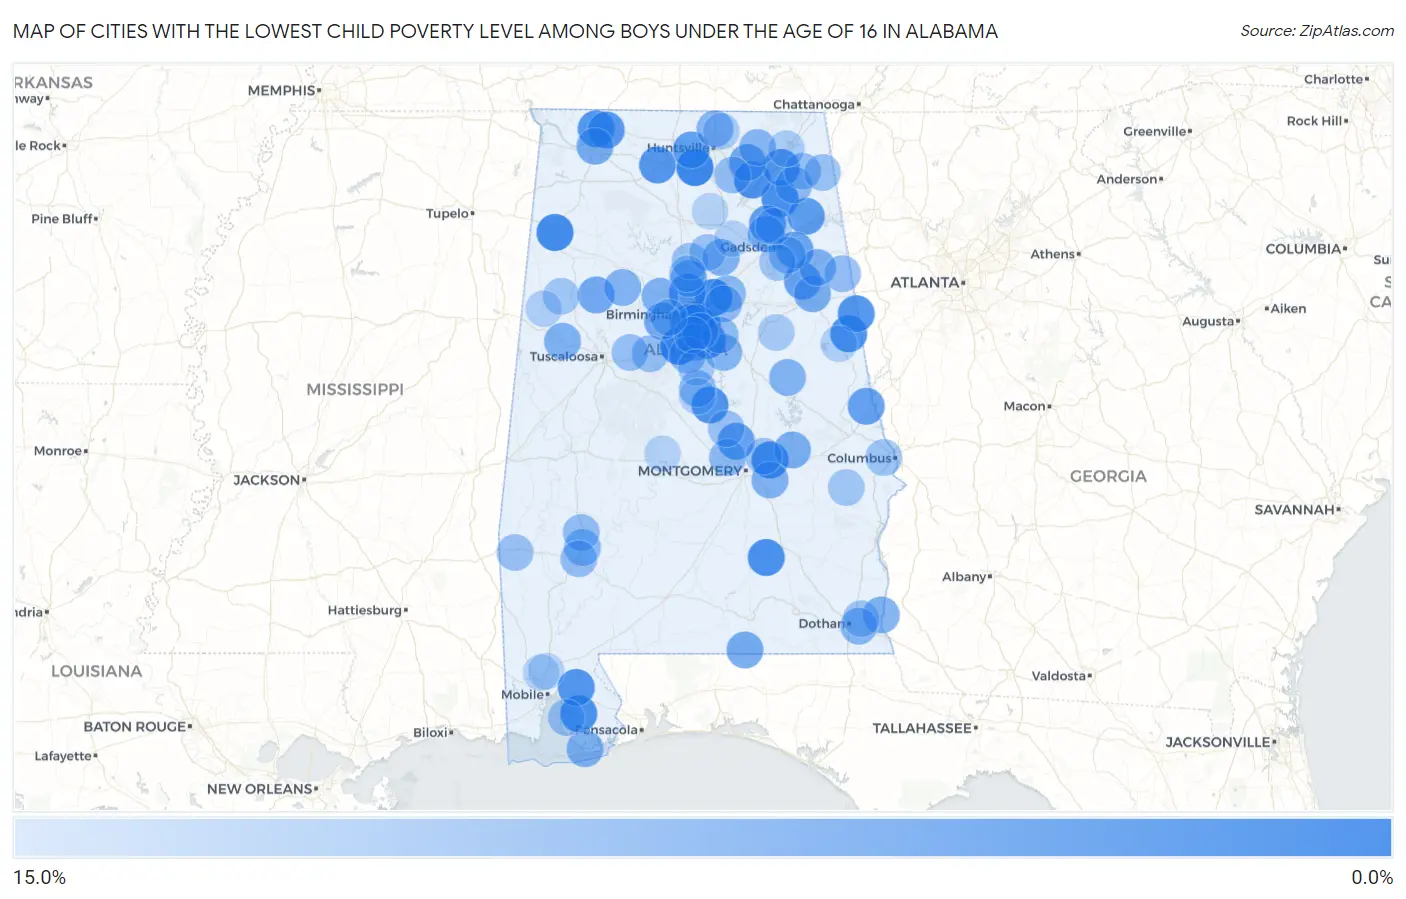
Map of Cities with the Lowest Child Poverty Level Among Boys Under the Age of 16 in Alabama
15.0%
0.0%
Cities with the Lowest Child Poverty Level Among Boys Under the Age of 16 in Alabama
| City | Child Poverty (Boys) | vs State | vs National | |
| 1. | Helena | 0.18% | 22.4%(-22.2)#1 | 16.9%(-16.7)#4 |
| 2. | Mountain Brook | 0.24% | 22.4%(-22.1)#2 | 16.9%(-16.7)#7 |
| 3. | Triana | 0.50% | 22.4%(-21.9)#3 | 16.9%(-16.4)#39 |
| 4. | Trussville | 0.88% | 22.4%(-21.5)#4 | 16.9%(-16.0)#126 |
| 5. | Hamilton | 1.1% | 22.4%(-21.2)#5 | 16.9%(-15.8)#213 |
| 6. | Geraldine | 1.5% | 22.4%(-20.9)#6 | 16.9%(-15.4)#367 |
| 7. | Emerald Mountain | 1.5% | 22.4%(-20.9)#7 | 16.9%(-15.4)#368 |
| 8. | Goshen | 1.5% | 22.4%(-20.8)#8 | 16.9%(-15.4)#378 |
| 9. | Chelsea | 1.7% | 22.4%(-20.7)#9 | 16.9%(-15.2)#454 |
| 10. | Silverhill | 1.9% | 22.4%(-20.5)#10 | 16.9%(-15.1)#548 |
| 11. | Grant | 2.0% | 22.4%(-20.3)#11 | 16.9%(-14.9)#645 |
| 12. | Woodland | 2.1% | 22.4%(-20.3)#12 | 16.9%(-14.8)#694 |
| 13. | Ranburne | 2.3% | 22.4%(-20.1)#13 | 16.9%(-14.6)#798 |
| 14. | Clanton | 2.3% | 22.4%(-20.1)#14 | 16.9%(-14.6)#808 |
| 15. | Stapleton | 2.3% | 22.4%(-20.1)#15 | 16.9%(-14.6)#824 |
| 16. | Gardendale | 2.3% | 22.4%(-20.0)#16 | 16.9%(-14.6)#840 |
| 17. | St Florian | 2.5% | 22.4%(-19.9)#17 | 16.9%(-14.4)#928 |
| 18. | Section | 2.7% | 22.4%(-19.7)#18 | 16.9%(-14.2)#1,051 |
| 19. | Trinity | 2.7% | 22.4%(-19.6)#19 | 16.9%(-14.2)#1,073 |
| 20. | Killen | 2.9% | 22.4%(-19.5)#20 | 16.9%(-14.0)#1,148 |
| 21. | Mccalla | 3.0% | 22.4%(-19.4)#21 | 16.9%(-13.9)#1,203 |
| 22. | Brook Highland | 3.1% | 22.4%(-19.2)#22 | 16.9%(-13.8)#1,328 |
| 23. | Homewood | 3.2% | 22.4%(-19.1)#23 | 16.9%(-13.7)#1,392 |
| 24. | Vestavia Hills | 3.3% | 22.4%(-19.1)#24 | 16.9%(-13.6)#1,414 |
| 25. | Sand Rock | 3.4% | 22.4%(-19.0)#25 | 16.9%(-13.5)#1,476 |
| 26. | Sardis City | 3.4% | 22.4%(-19.0)#26 | 16.9%(-13.5)#1,491 |
| 27. | Madison | 3.7% | 22.4%(-18.7)#27 | 16.9%(-13.2)#1,668 |
| 28. | Deatsville | 3.8% | 22.4%(-18.5)#28 | 16.9%(-13.1)#1,718 |
| 29. | Huguley | 3.9% | 22.4%(-18.5)#29 | 16.9%(-13.0)#1,775 |
| 30. | Weaver | 4.2% | 22.4%(-18.2)#30 | 16.9%(-12.7)#1,897 |
| 31. | Hokes Bluff | 4.3% | 22.4%(-18.1)#31 | 16.9%(-12.6)#1,991 |
| 32. | Woodville | 4.8% | 22.4%(-17.5)#32 | 16.9%(-12.1)#2,282 |
| 33. | Concord | 4.8% | 22.4%(-17.5)#33 | 16.9%(-12.1)#2,285 |
| 34. | Berry | 4.9% | 22.4%(-17.5)#34 | 16.9%(-12.0)#2,316 |
| 35. | Carlisle Rockledge | 5.0% | 22.4%(-17.3)#35 | 16.9%(-11.9)#2,420 |
| 36. | Florala | 5.1% | 22.4%(-17.3)#36 | 16.9%(-11.8)#2,436 |
| 37. | Muscle Shoals | 5.4% | 22.4%(-16.9)#37 | 16.9%(-11.5)#2,677 |
| 38. | Choccolocco | 5.6% | 22.4%(-16.7)#38 | 16.9%(-11.3)#2,798 |
| 39. | Tallassee | 5.7% | 22.4%(-16.7)#39 | 16.9%(-11.2)#2,825 |
| 40. | Kimberly | 5.8% | 22.4%(-16.5)#40 | 16.9%(-11.1)#2,914 |
| 41. | Columbia | 5.9% | 22.4%(-16.4)#41 | 16.9%(-11.0)#2,971 |
| 42. | Nances Creek | 6.1% | 22.4%(-16.2)#42 | 16.9%(-10.8)#3,083 |
| 43. | Gulf Shores | 6.2% | 22.4%(-16.2)#43 | 16.9%(-10.8)#3,092 |
| 44. | Gordo | 6.2% | 22.4%(-16.2)#44 | 16.9%(-10.7)#3,103 |
| 45. | Pike Road | 6.2% | 22.4%(-16.2)#45 | 16.9%(-10.7)#3,106 |
| 46. | West Jefferson | 6.2% | 22.4%(-16.1)#46 | 16.9%(-10.7)#3,153 |
| 47. | Oneonta | 6.4% | 22.4%(-16.0)#47 | 16.9%(-10.5)#3,262 |
| 48. | Oakman | 6.5% | 22.4%(-15.9)#48 | 16.9%(-10.4)#3,311 |
| 49. | Hackneyville | 6.6% | 22.4%(-15.8)#49 | 16.9%(-10.3)#3,364 |
| 50. | Meridianville | 6.6% | 22.4%(-15.7)#50 | 16.9%(-10.3)#3,389 |
| 51. | Wilsonville | 6.7% | 22.4%(-15.6)#51 | 16.9%(-10.2)#3,446 |
| 52. | Cowarts | 6.8% | 22.4%(-15.6)#52 | 16.9%(-10.1)#3,477 |
| 53. | Pleasant Groves | 6.8% | 22.4%(-15.5)#53 | 16.9%(-10.1)#3,503 |
| 54. | Pelham | 6.8% | 22.4%(-15.5)#54 | 16.9%(-10.1)#3,517 |
| 55. | Glencoe | 7.1% | 22.4%(-15.3)#55 | 16.9%(-9.83)#3,646 |
| 56. | Jemison | 7.1% | 22.4%(-15.3)#56 | 16.9%(-9.82)#3,650 |
| 57. | Margaret | 7.1% | 22.4%(-15.2)#57 | 16.9%(-9.78)#3,678 |
| 58. | Fulton | 7.2% | 22.4%(-15.1)#58 | 16.9%(-9.66)#3,763 |
| 59. | Prattville | 7.3% | 22.4%(-15.1)#59 | 16.9%(-9.60)#3,788 |
| 60. | Shiloh | 7.3% | 22.4%(-15.0)#60 | 16.9%(-9.59)#3,799 |
| 61. | Moody | 7.4% | 22.4%(-14.9)#61 | 16.9%(-9.46)#3,864 |
| 62. | Westover | 7.6% | 22.4%(-14.8)#62 | 16.9%(-9.32)#3,930 |
| 63. | Alabaster | 7.6% | 22.4%(-14.7)#63 | 16.9%(-9.26)#3,963 |
| 64. | Thomasville | 7.7% | 22.4%(-14.6)#64 | 16.9%(-9.16)#4,047 |
| 65. | Sylvania | 7.8% | 22.4%(-14.6)#65 | 16.9%(-9.13)#4,058 |
| 66. | Grove Hill | 7.9% | 22.4%(-14.4)#66 | 16.9%(-8.98)#4,136 |
| 67. | Woodstock | 8.0% | 22.4%(-14.4)#67 | 16.9%(-8.93)#4,160 |
| 68. | Edwardsville | 8.0% | 22.4%(-14.4)#68 | 16.9%(-8.90)#4,188 |
| 69. | New Hope | 8.0% | 22.4%(-14.4)#69 | 16.9%(-8.90)#4,192 |
| 70. | Brookwood | 8.1% | 22.4%(-14.3)#70 | 16.9%(-8.80)#4,237 |
| 71. | Hayden | 8.2% | 22.4%(-14.2)#71 | 16.9%(-8.69)#4,294 |
| 72. | Meadowbrook | 8.2% | 22.4%(-14.1)#72 | 16.9%(-8.67)#4,305 |
| 73. | Marbury | 8.3% | 22.4%(-14.1)#73 | 16.9%(-8.64)#4,316 |
| 74. | Hoover | 8.3% | 22.4%(-14.0)#74 | 16.9%(-8.58)#4,342 |
| 75. | Silas | 8.3% | 22.4%(-14.0)#75 | 16.9%(-8.57)#4,379 |
| 76. | Valley Head | 8.4% | 22.4%(-13.9)#76 | 16.9%(-8.47)#4,449 |
| 77. | Fairhope | 8.5% | 22.4%(-13.9)#77 | 16.9%(-8.45)#4,470 |
| 78. | Nectar | 8.5% | 22.4%(-13.9)#78 | 16.9%(-8.39)#4,497 |
| 79. | Pleasant Grove | 8.6% | 22.4%(-13.8)#79 | 16.9%(-8.34)#4,526 |
| 80. | Ladonia | 8.6% | 22.4%(-13.7)#80 | 16.9%(-8.26)#4,569 |
| 81. | Webb | 8.7% | 22.4%(-13.7)#81 | 16.9%(-8.23)#4,583 |
| 82. | Redland | 8.7% | 22.4%(-13.7)#82 | 16.9%(-8.21)#4,593 |
| 83. | Hurtsboro | 9.1% | 22.4%(-13.3)#83 | 16.9%(-7.81)#4,817 |
| 84. | Belk | 9.1% | 22.4%(-13.3)#84 | 16.9%(-7.81)#4,826 |
| 85. | Southside | 9.1% | 22.4%(-13.3)#85 | 16.9%(-7.80)#4,854 |
| 86. | Warrior | 9.2% | 22.4%(-13.2)#86 | 16.9%(-7.72)#4,892 |
| 87. | Whitesboro | 9.3% | 22.4%(-13.1)#87 | 16.9%(-7.60)#4,962 |
| 88. | Calera | 9.3% | 22.4%(-13.1)#88 | 16.9%(-7.60)#4,971 |
| 89. | Waldo | 9.5% | 22.4%(-12.8)#89 | 16.9%(-7.38)#5,085 |
| 90. | Eagle Point | 9.6% | 22.4%(-12.8)#90 | 16.9%(-7.34)#5,098 |
| 91. | Moores Mill | 9.6% | 22.4%(-12.7)#91 | 16.9%(-7.26)#5,139 |
| 92. | Hollywood | 9.8% | 22.4%(-12.5)#92 | 16.9%(-7.07)#5,246 |
| 93. | Millport | 10.1% | 22.4%(-12.2)#93 | 16.9%(-6.78)#5,419 |
| 94. | Wedowee | 10.3% | 22.4%(-12.1)#94 | 16.9%(-6.61)#5,496 |
| 95. | Thorsby | 10.3% | 22.4%(-12.0)#95 | 16.9%(-6.56)#5,513 |
| 96. | Susan Moore | 10.5% | 22.4%(-11.9)#96 | 16.9%(-6.43)#5,592 |
| 97. | Baileyton | 10.6% | 22.4%(-11.7)#97 | 16.9%(-6.27)#5,684 |
| 98. | Valley Grande | 10.7% | 22.4%(-11.7)#98 | 16.9%(-6.25)#5,694 |
| 99. | Satsuma | 10.7% | 22.4%(-11.7)#99 | 16.9%(-6.24)#5,698 |
| 100. | Saraland | 10.8% | 22.4%(-11.6)#100 | 16.9%(-6.13)#5,757 |
Common Questions
What are the Top 10 Cities with the Lowest Child Poverty Level Among Boys Under the Age of 16 in Alabama?
Top 10 Cities with the Lowest Child Poverty Level Among Boys Under the Age of 16 in Alabama are:
#1
0.18%
#2
0.24%
#3
0.50%
#4
0.88%
#5
1.1%
#6
1.5%
#7
1.5%
#8
1.5%
#9
1.7%
#10
1.9%
What city has the Lowest Child Poverty Level Among Boys Under the Age of 16 in Alabama?
Helena has the Lowest Child Poverty Level Among Boys Under the Age of 16 in Alabama with 0.18%.
What is the Poverty Level Among Boys Under the Age of 16 in the State of Alabama?
Poverty Level Among Boys Under the Age of 16 in Alabama is 22.4%.
What is the Poverty Level Among Boys Under the Age of 16 in the United States?
Poverty Level Among Boys Under the Age of 16 in the United States is 16.9%.