Cities with the Lowest Child Poverty Level Among Boys Under the Age of 16 in Tennessee
RELATED REPORTS & OPTIONS
Lowest Poverty | Boys 0-16
Tennessee
Compare Cities
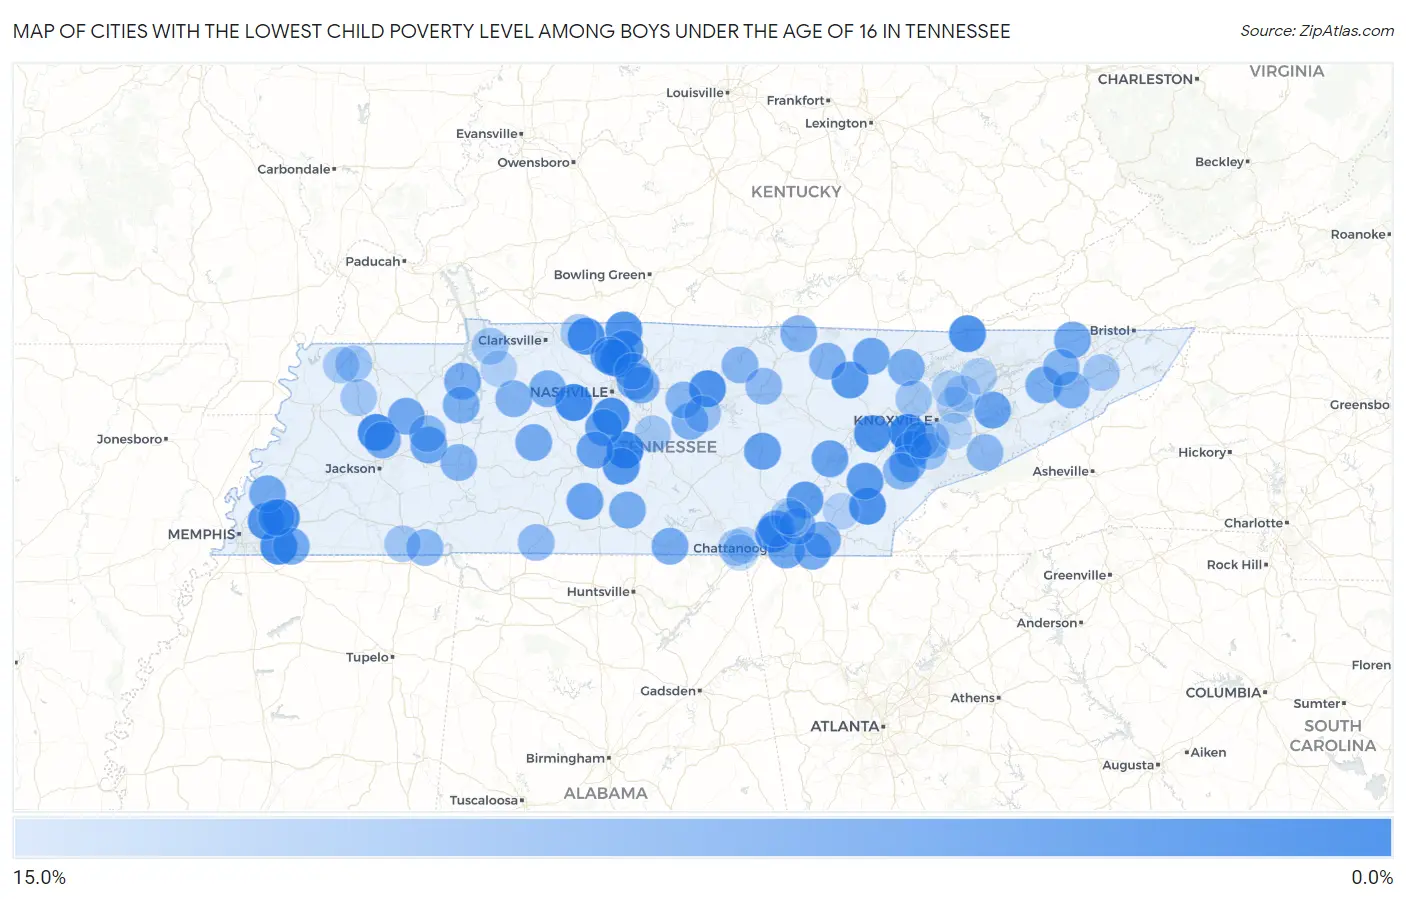
Map of Cities with the Lowest Child Poverty Level Among Boys Under the Age of 16 in Tennessee
15.0%
0.0%
Cities with the Lowest Child Poverty Level Among Boys Under the Age of 16 in Tennessee
| City | Child Poverty (Boys) | vs State | vs National | |
| 1. | Farragut | 0.46% | 19.7%(-19.3)#1 | 16.9%(-16.4)#31 |
| 2. | Eagleville | 0.76% | 19.7%(-19.0)#2 | 16.9%(-16.1)#101 |
| 3. | Kingston Springs | 1.5% | 19.7%(-18.2)#3 | 16.9%(-15.4)#361 |
| 4. | Collierville | 1.6% | 19.7%(-18.1)#4 | 16.9%(-15.3)#419 |
| 5. | Gibson | 1.9% | 19.7%(-17.9)#5 | 16.9%(-15.1)#549 |
| 6. | Signal Mountain | 2.0% | 19.7%(-17.7)#6 | 16.9%(-14.9)#637 |
| 7. | Brentwood | 2.1% | 19.7%(-17.6)#7 | 16.9%(-14.8)#684 |
| 8. | Millersville | 2.2% | 19.7%(-17.5)#8 | 16.9%(-14.7)#765 |
| 9. | Cedar Hill | 2.2% | 19.7%(-17.5)#9 | 16.9%(-14.7)#775 |
| 10. | Arlington | 2.3% | 19.7%(-17.4)#10 | 16.9%(-14.6)#834 |
| 11. | Kingston | 2.4% | 19.7%(-17.3)#11 | 16.9%(-14.5)#874 |
| 12. | Harrogate | 2.7% | 19.7%(-17.0)#12 | 16.9%(-14.2)#1,062 |
| 13. | Etowah | 2.7% | 19.7%(-17.0)#13 | 16.9%(-14.2)#1,066 |
| 14. | Gordonsville | 2.7% | 19.7%(-17.0)#14 | 16.9%(-14.2)#1,069 |
| 15. | Bartlett | 2.8% | 19.7%(-17.0)#15 | 16.9%(-14.1)#1,083 |
| 16. | Orlinda | 2.9% | 19.7%(-16.8)#16 | 16.9%(-14.0)#1,185 |
| 17. | White House | 3.1% | 19.7%(-16.7)#17 | 16.9%(-13.8)#1,267 |
| 18. | Karns | 3.1% | 19.7%(-16.6)#18 | 16.9%(-13.8)#1,326 |
| 19. | Chapel Hill | 3.4% | 19.7%(-16.3)#19 | 16.9%(-13.5)#1,512 |
| 20. | Sunbright | 3.6% | 19.7%(-16.1)#20 | 16.9%(-13.3)#1,617 |
| 21. | Sale Creek | 4.1% | 19.7%(-15.7)#21 | 16.9%(-12.8)#1,856 |
| 22. | Niota | 4.2% | 19.7%(-15.6)#22 | 16.9%(-12.7)#1,904 |
| 23. | Franklin | 4.5% | 19.7%(-15.3)#23 | 16.9%(-12.4)#2,086 |
| 24. | Spencer | 4.9% | 19.7%(-14.8)#24 | 16.9%(-12.0)#2,314 |
| 25. | Greenbrier | 4.9% | 19.7%(-14.8)#25 | 16.9%(-12.0)#2,348 |
| 26. | Spring City | 5.1% | 19.7%(-14.6)#26 | 16.9%(-11.8)#2,467 |
| 27. | Spring Hill | 5.2% | 19.7%(-14.6)#27 | 16.9%(-11.7)#2,500 |
| 28. | Ridgeside | 5.2% | 19.7%(-14.5)#28 | 16.9%(-11.7)#2,548 |
| 29. | Dandridge | 5.3% | 19.7%(-14.5)#29 | 16.9%(-11.6)#2,559 |
| 30. | Lynnville | 5.3% | 19.7%(-14.5)#30 | 16.9%(-11.6)#2,569 |
| 31. | Parker S Crossroads | 5.4% | 19.7%(-14.3)#31 | 16.9%(-11.5)#2,659 |
| 32. | Apison | 5.6% | 19.7%(-14.1)#32 | 16.9%(-11.3)#2,804 |
| 33. | Huntsville | 5.7% | 19.7%(-14.1)#33 | 16.9%(-11.2)#2,812 |
| 34. | Friendsville | 5.7% | 19.7%(-14.0)#34 | 16.9%(-11.2)#2,842 |
| 35. | Mclemoresville | 5.9% | 19.7%(-13.8)#35 | 16.9%(-11.0)#2,953 |
| 36. | Fairmount | 5.9% | 19.7%(-13.8)#36 | 16.9%(-11.0)#2,979 |
| 37. | Green Hill | 6.0% | 19.7%(-13.7)#37 | 16.9%(-10.9)#3,016 |
| 38. | Atoka | 6.2% | 19.7%(-13.5)#38 | 16.9%(-10.7)#3,115 |
| 39. | Piperton | 6.2% | 19.7%(-13.5)#39 | 16.9%(-10.7)#3,116 |
| 40. | Medina | 6.2% | 19.7%(-13.5)#40 | 16.9%(-10.7)#3,124 |
| 41. | Ridgetop | 6.2% | 19.7%(-13.5)#41 | 16.9%(-10.7)#3,141 |
| 42. | Church Hill | 6.3% | 19.7%(-13.4)#42 | 16.9%(-10.6)#3,206 |
| 43. | Greenback | 6.3% | 19.7%(-13.4)#43 | 16.9%(-10.6)#3,224 |
| 44. | South Cleveland | 6.4% | 19.7%(-13.3)#44 | 16.9%(-10.5)#3,255 |
| 45. | Huntland | 6.5% | 19.7%(-13.2)#45 | 16.9%(-10.4)#3,310 |
| 46. | Mount Juliet | 6.5% | 19.7%(-13.2)#46 | 16.9%(-10.4)#3,321 |
| 47. | Centerville | 6.5% | 19.7%(-13.2)#47 | 16.9%(-10.4)#3,345 |
| 48. | Petersburg | 6.7% | 19.7%(-13.1)#48 | 16.9%(-10.2)#3,410 |
| 49. | Big Sandy | 6.7% | 19.7%(-13.0)#49 | 16.9%(-10.2)#3,451 |
| 50. | Lakeland | 6.8% | 19.7%(-13.0)#50 | 16.9%(-10.1)#3,465 |
| 51. | Charlotte | 6.8% | 19.7%(-12.9)#51 | 16.9%(-10.1)#3,482 |
| 52. | Mosheim | 6.8% | 19.7%(-12.9)#52 | 16.9%(-10.1)#3,514 |
| 53. | Jacksboro | 6.9% | 19.7%(-12.9)#53 | 16.9%(-10.0)#3,532 |
| 54. | Camden | 6.9% | 19.7%(-12.8)#54 | 16.9%(-9.98)#3,566 |
| 55. | Powell | 7.1% | 19.7%(-12.7)#55 | 16.9%(-9.84)#3,643 |
| 56. | Auburntown | 7.1% | 19.7%(-12.6)#56 | 16.9%(-9.76)#3,703 |
| 57. | Lakesite | 7.2% | 19.7%(-12.5)#57 | 16.9%(-9.68)#3,744 |
| 58. | Tusculum | 7.2% | 19.7%(-12.5)#58 | 16.9%(-9.66)#3,760 |
| 59. | Byrdstown | 7.5% | 19.7%(-12.3)#59 | 16.9%(-9.44)#3,873 |
| 60. | Mcewen | 7.5% | 19.7%(-12.2)#60 | 16.9%(-9.40)#3,892 |
| 61. | Allardt | 7.6% | 19.7%(-12.1)#61 | 16.9%(-9.33)#3,927 |
| 62. | Parsons | 7.8% | 19.7%(-12.0)#62 | 16.9%(-9.14)#4,051 |
| 63. | Watertown | 7.9% | 19.7%(-11.9)#63 | 16.9%(-9.05)#4,095 |
| 64. | Baileyton | 7.9% | 19.7%(-11.8)#64 | 16.9%(-9.01)#4,117 |
| 65. | Gainesboro | 8.0% | 19.7%(-11.7)#65 | 16.9%(-8.90)#4,175 |
| 66. | Clarksburg | 8.3% | 19.7%(-11.5)#66 | 16.9%(-8.65)#4,311 |
| 67. | Vonore | 8.4% | 19.7%(-11.3)#67 | 16.9%(-8.52)#4,421 |
| 68. | Michie | 8.6% | 19.7%(-11.2)#68 | 16.9%(-8.33)#4,531 |
| 69. | Gatlinburg | 8.6% | 19.7%(-11.1)#69 | 16.9%(-8.28)#4,562 |
| 70. | Hendersonville | 8.6% | 19.7%(-11.1)#70 | 16.9%(-8.27)#4,565 |
| 71. | Algood | 8.7% | 19.7%(-11.1)#71 | 16.9%(-8.23)#4,585 |
| 72. | Loretto | 8.8% | 19.7%(-10.9)#72 | 16.9%(-8.08)#4,676 |
| 73. | Finley | 9.4% | 19.7%(-10.3)#73 | 16.9%(-7.48)#5,032 |
| 74. | Alcoa | 9.8% | 19.7%(-9.97)#74 | 16.9%(-7.15)#5,189 |
| 75. | Liberty | 9.8% | 19.7%(-9.97)#75 | 16.9%(-7.15)#5,200 |
| 76. | Maryville | 9.8% | 19.7%(-9.93)#76 | 16.9%(-7.10)#5,227 |
| 77. | Delano | 9.8% | 19.7%(-9.90)#77 | 16.9%(-7.08)#5,239 |
| 78. | Louisville | 9.9% | 19.7%(-9.84)#78 | 16.9%(-7.02)#5,263 |
| 79. | Lynchburg | 9.9% | 19.7%(-9.84)#79 | 16.9%(-7.02)#5,266 |
| 80. | Dover | 10.0% | 19.7%(-9.72)#80 | 16.9%(-6.90)#5,320 |
| 81. | Rives | 10.0% | 19.7%(-9.72)#81 | 16.9%(-6.90)#5,357 |
| 82. | Clinton | 10.1% | 19.7%(-9.61)#82 | 16.9%(-6.79)#5,410 |
| 83. | Jonesborough | 10.4% | 19.7%(-9.32)#83 | 16.9%(-6.50)#5,545 |
| 84. | Murfreesboro | 10.5% | 19.7%(-9.21)#84 | 16.9%(-6.39)#5,606 |
| 85. | Adams | 10.5% | 19.7%(-9.20)#85 | 16.9%(-6.38)#5,617 |
| 86. | Ramer | 10.5% | 19.7%(-9.20)#86 | 16.9%(-6.38)#5,627 |
| 87. | Rutherford | 10.6% | 19.7%(-9.14)#87 | 16.9%(-6.32)#5,656 |
| 88. | Kimball | 10.8% | 19.7%(-8.97)#88 | 16.9%(-6.15)#5,743 |
| 89. | Troy | 11.1% | 19.7%(-8.61)#89 | 16.9%(-5.79)#5,897 |
| 90. | Mascot | 11.6% | 19.7%(-8.10)#90 | 16.9%(-5.28)#6,159 |
| 91. | Soddy Daisy | 11.7% | 19.7%(-7.99)#91 | 16.9%(-5.17)#6,215 |
| 92. | Blaine | 11.8% | 19.7%(-7.96)#92 | 16.9%(-5.14)#6,233 |
| 93. | Mowbray Mountain | 11.9% | 19.7%(-7.87)#93 | 16.9%(-5.05)#6,300 |
| 94. | Tennessee Ridge | 11.9% | 19.7%(-7.87)#94 | 16.9%(-5.05)#6,301 |
| 95. | Rutledge | 11.9% | 19.7%(-7.80)#95 | 16.9%(-4.98)#6,337 |
| 96. | Calhoun | 12.0% | 19.7%(-7.72)#96 | 16.9%(-4.90)#6,379 |
| 97. | Plainview | 12.0% | 19.7%(-7.71)#97 | 16.9%(-4.88)#6,392 |
| 98. | Seymour | 12.3% | 19.7%(-7.47)#98 | 16.9%(-4.65)#6,496 |
| 99. | Jasper | 12.5% | 19.7%(-7.26)#99 | 16.9%(-4.44)#6,580 |
| 100. | New Hope | 12.5% | 19.7%(-7.22)#100 | 16.9%(-4.40)#6,607 |
Common Questions
What are the Top 10 Cities with the Lowest Child Poverty Level Among Boys Under the Age of 16 in Tennessee?
Top 10 Cities with the Lowest Child Poverty Level Among Boys Under the Age of 16 in Tennessee are:
#1
0.46%
#2
0.76%
#3
1.5%
#4
1.6%
#5
1.9%
#6
2.0%
#7
2.1%
#8
2.2%
#9
2.2%
#10
2.3%
What city has the Lowest Child Poverty Level Among Boys Under the Age of 16 in Tennessee?
Farragut has the Lowest Child Poverty Level Among Boys Under the Age of 16 in Tennessee with 0.46%.
What is the Poverty Level Among Boys Under the Age of 16 in the State of Tennessee?
Poverty Level Among Boys Under the Age of 16 in Tennessee is 19.7%.
What is the Poverty Level Among Boys Under the Age of 16 in the United States?
Poverty Level Among Boys Under the Age of 16 in the United States is 16.9%.