Cities with the Lowest Child Poverty Level Among Boys Under the Age of 16 in Montana
RELATED REPORTS & OPTIONS
Lowest Poverty | Boys 0-16
Montana
Compare Cities
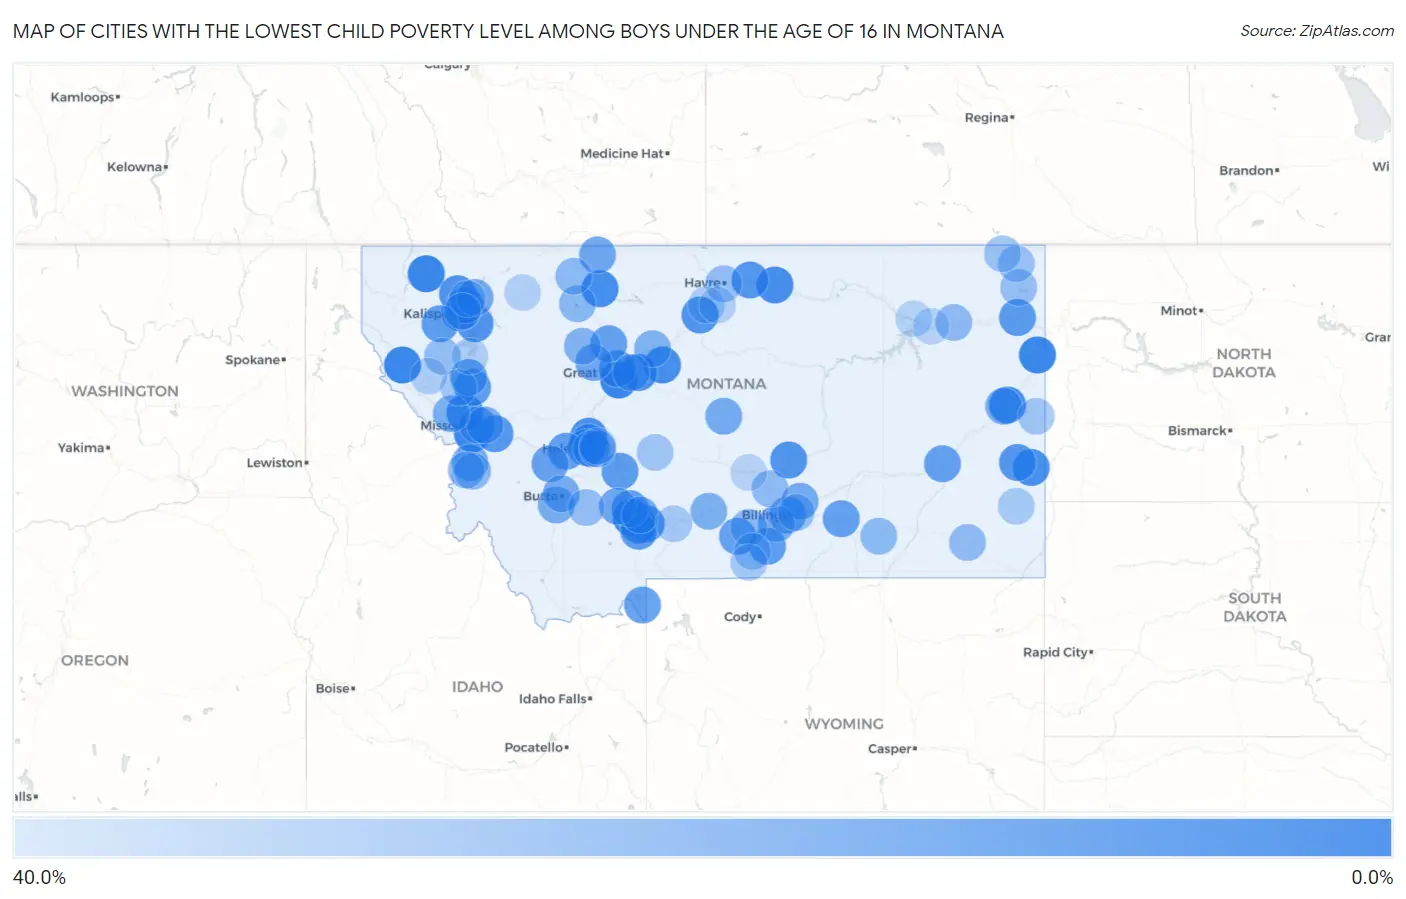
Map of Cities with the Lowest Child Poverty Level Among Boys Under the Age of 16 in Montana
40.0%
0.0%
Cities with the Lowest Child Poverty Level Among Boys Under the Age of 16 in Montana
| City | Child Poverty (Boys) | vs State | vs National | |
| 1. | Ulm | 1.1% | 15.4%(-14.3)#1 | 16.9%(-15.8)#196 |
| 2. | Churchill | 1.1% | 15.4%(-14.2)#2 | 16.9%(-15.8)#215 |
| 3. | Thompson Falls | 1.6% | 15.4%(-13.8)#3 | 16.9%(-15.3)#399 |
| 4. | Trego | 1.7% | 15.4%(-13.7)#4 | 16.9%(-15.3)#429 |
| 5. | Sidney | 1.7% | 15.4%(-13.7)#5 | 16.9%(-15.2)#451 |
| 6. | Lolo | 2.3% | 15.4%(-13.0)#6 | 16.9%(-14.6)#839 |
| 7. | Glendive | 3.7% | 15.4%(-11.6)#7 | 16.9%(-13.2)#1,677 |
| 8. | Frenchtown | 4.1% | 15.4%(-11.3)#8 | 16.9%(-12.8)#1,865 |
| 9. | Shelby | 4.2% | 15.4%(-11.1)#9 | 16.9%(-12.7)#1,938 |
| 10. | Highwood | 4.5% | 15.4%(-10.8)#10 | 16.9%(-12.4)#2,142 |
| 11. | Harlem | 4.8% | 15.4%(-10.5)#11 | 16.9%(-12.1)#2,288 |
| 12. | Malmstrom Afb | 5.3% | 15.4%(-10.1)#12 | 16.9%(-11.6)#2,584 |
| 13. | Helena Valley Northwest | 5.3% | 15.4%(-10.0)#13 | 16.9%(-11.6)#2,616 |
| 14. | Baker | 5.8% | 15.4%(-9.55)#14 | 16.9%(-11.1)#2,907 |
| 15. | Helena Valley West Central | 6.5% | 15.4%(-8.90)#15 | 16.9%(-10.4)#3,296 |
| 16. | Roundup | 6.5% | 15.4%(-8.88)#16 | 16.9%(-10.4)#3,305 |
| 17. | Bigfork | 6.9% | 15.4%(-8.45)#17 | 16.9%(-10.00)#3,561 |
| 18. | Big Sandy | 6.9% | 15.4%(-8.42)#18 | 16.9%(-9.96)#3,577 |
| 19. | Bozeman | 7.0% | 15.4%(-8.36)#19 | 16.9%(-9.91)#3,600 |
| 20. | Four Corners | 7.0% | 15.4%(-8.32)#20 | 16.9%(-9.86)#3,627 |
| 21. | Kalispell | 7.0% | 15.4%(-8.32)#21 | 16.9%(-9.86)#3,634 |
| 22. | Whitefish | 7.1% | 15.4%(-8.30)#22 | 16.9%(-9.84)#3,641 |
| 23. | Helena Flats | 7.4% | 15.4%(-7.99)#23 | 16.9%(-9.54)#3,819 |
| 24. | Chinook | 7.6% | 15.4%(-7.75)#24 | 16.9%(-9.29)#3,952 |
| 25. | Plevna | 7.9% | 15.4%(-7.43)#25 | 16.9%(-8.97)#4,143 |
| 26. | Clinton | 8.3% | 15.4%(-7.03)#26 | 16.9%(-8.57)#4,362 |
| 27. | Helena West Side | 8.9% | 15.4%(-6.47)#27 | 16.9%(-8.01)#4,711 |
| 28. | Culbertson | 9.3% | 15.4%(-6.06)#28 | 16.9%(-7.60)#4,966 |
| 29. | Fromberg | 9.5% | 15.4%(-5.84)#29 | 16.9%(-7.38)#5,081 |
| 30. | St Ignatius | 9.6% | 15.4%(-5.72)#30 | 16.9%(-7.27)#5,137 |
| 31. | Gallatin Gateway | 9.7% | 15.4%(-5.68)#31 | 16.9%(-7.23)#5,157 |
| 32. | Marion | 10.0% | 15.4%(-5.36)#32 | 16.9%(-6.90)#5,323 |
| 33. | Townsend | 10.3% | 15.4%(-5.09)#33 | 16.9%(-6.63)#5,484 |
| 34. | Manhattan | 10.4% | 15.4%(-4.93)#34 | 16.9%(-6.47)#5,563 |
| 35. | Vaughn | 10.5% | 15.4%(-4.90)#35 | 16.9%(-6.44)#5,584 |
| 36. | Elliston | 10.5% | 15.4%(-4.84)#36 | 16.9%(-6.38)#5,629 |
| 37. | Charlo | 11.1% | 15.4%(-4.25)#37 | 16.9%(-5.79)#5,925 |
| 38. | Absarokee | 11.8% | 15.4%(-3.60)#38 | 16.9%(-5.14)#6,239 |
| 39. | Dutton | 11.8% | 15.4%(-3.60)#39 | 16.9%(-5.14)#6,255 |
| 40. | Miles City | 11.9% | 15.4%(-3.49)#40 | 16.9%(-5.03)#6,314 |
| 41. | Hardin | 12.0% | 15.4%(-3.40)#41 | 16.9%(-4.94)#6,352 |
| 42. | West Yellowstone | 12.0% | 15.4%(-3.36)#42 | 16.9%(-4.90)#6,373 |
| 43. | Deer Lodge | 12.2% | 15.4%(-3.14)#43 | 16.9%(-4.68)#6,485 |
| 44. | Helena | 13.7% | 15.4%(-1.62)#44 | 16.9%(-3.17)#7,247 |
| 45. | Billings | 14.1% | 15.4%(-1.30)#45 | 16.9%(-2.84)#7,412 |
| 46. | Sunburst | 14.3% | 15.4%(-1.08)#46 | 16.9%(-2.62)#7,518 |
| 47. | Three Forks | 14.5% | 15.4%(-0.837)#47 | 16.9%(-2.38)#7,633 |
| 48. | Missoula | 14.7% | 15.4%(-0.628)#48 | 16.9%(-2.17)#7,735 |
| 49. | Fairfield | 14.8% | 15.4%(-0.589)#49 | 16.9%(-2.13)#7,752 |
| 50. | Hungry Horse | 15.1% | 15.4%(-0.308)#50 | 16.9%(-1.85)#7,884 |
| 51. | Belgrade | 15.5% | 15.4%(+0.097)#51 | 16.9%(-1.45)#8,071 |
| 52. | Shepherd | 15.7% | 15.4%(+0.341)#52 | 16.9%(-1.20)#8,176 |
| 53. | Moore | 15.8% | 15.4%(+0.428)#53 | 16.9%(-1.11)#8,225 |
| 54. | Butte Silver Bow Balance | 16.1% | 15.4%(+0.780)#54 | 16.9%(-0.762)#8,387 |
| 55. | Laurel | 16.2% | 15.4%(+0.815)#55 | 16.9%(-0.727)#8,403 |
| 56. | West Glendive | 16.3% | 15.4%(+0.930)#56 | 16.9%(-0.612)#8,467 |
| 57. | Victor | 16.3% | 15.4%(+0.978)#57 | 16.9%(-0.564)#8,487 |
| 58. | Walkerville | 16.4% | 15.4%(+1.00)#58 | 16.9%(-0.540)#8,499 |
| 59. | Bonner West Riverside | 17.6% | 15.4%(+2.20)#59 | 16.9%(+0.653)#9,045 |
| 60. | Alberton | 17.6% | 15.4%(+2.21)#60 | 16.9%(+0.664)#9,050 |
| 61. | Big Timber | 17.8% | 15.4%(+2.47)#61 | 16.9%(+0.931)#9,148 |
| 62. | Carter | 18.2% | 15.4%(+2.82)#62 | 16.9%(+1.28)#9,330 |
| 63. | Great Falls | 18.8% | 15.4%(+3.39)#63 | 16.9%(+1.85)#9,569 |
| 64. | Choteau | 18.9% | 15.4%(+3.50)#64 | 16.9%(+1.95)#9,602 |
| 65. | East Helena | 19.1% | 15.4%(+3.73)#65 | 16.9%(+2.19)#9,698 |
| 66. | Corvallis | 20.6% | 15.4%(+5.23)#66 | 16.9%(+3.68)#10,303 |
| 67. | Valier | 20.7% | 15.4%(+5.33)#67 | 16.9%(+3.79)#10,350 |
| 68. | Cut Bank | 21.2% | 15.4%(+5.80)#68 | 16.9%(+4.26)#10,524 |
| 69. | Busby | 21.4% | 15.4%(+6.07)#69 | 16.9%(+4.52)#10,621 |
| 70. | Wolf Point | 21.8% | 15.4%(+6.41)#70 | 16.9%(+4.87)#10,735 |
| 71. | Columbus | 21.9% | 15.4%(+6.54)#71 | 16.9%(+4.99)#10,774 |
| 72. | Broadus | 22.2% | 15.4%(+6.86)#72 | 16.9%(+5.32)#10,884 |
| 73. | Broadview | 22.2% | 15.4%(+6.86)#73 | 16.9%(+5.32)#10,895 |
| 74. | Pinesdale | 22.5% | 15.4%(+7.15)#74 | 16.9%(+5.61)#11,003 |
| 75. | Lonepine | 23.1% | 15.4%(+7.72)#75 | 16.9%(+6.17)#11,193 |
| 76. | Havre | 23.3% | 15.4%(+7.98)#76 | 16.9%(+6.44)#11,271 |
| 77. | Whitehall | 23.5% | 15.4%(+8.17)#77 | 16.9%(+6.63)#11,318 |
| 78. | Lockwood | 23.7% | 15.4%(+8.33)#78 | 16.9%(+6.79)#11,396 |
| 79. | Medicine Lake | 24.0% | 15.4%(+8.64)#79 | 16.9%(+7.10)#11,503 |
| 80. | Plentywood | 24.4% | 15.4%(+9.01)#80 | 16.9%(+7.47)#11,619 |
| 81. | Roberts | 25.0% | 15.4%(+9.64)#81 | 16.9%(+8.10)#11,850 |
| 82. | Outlook | 25.0% | 15.4%(+9.64)#82 | 16.9%(+8.10)#11,899 |
| 83. | Helena Valley Southeast | 25.5% | 15.4%(+10.1)#83 | 16.9%(+8.55)#12,005 |
| 84. | Wibaux | 25.8% | 15.4%(+10.4)#84 | 16.9%(+8.90)#12,124 |
| 85. | White Sulphur Springs | 26.5% | 15.4%(+11.2)#85 | 16.9%(+9.63)#12,357 |
| 86. | Dixon | 26.9% | 15.4%(+11.6)#86 | 16.9%(+10.0)#12,494 |
| 87. | Columbia Falls | 27.0% | 15.4%(+11.7)#87 | 16.9%(+10.1)#12,517 |
| 88. | Livingston | 27.6% | 15.4%(+12.2)#88 | 16.9%(+10.7)#12,681 |
| 89. | Pine Creek | 27.7% | 15.4%(+12.3)#89 | 16.9%(+10.8)#12,700 |
| 90. | Red Lodge | 27.8% | 15.4%(+12.4)#90 | 16.9%(+10.9)#12,730 |
| 91. | Ekalaka | 27.8% | 15.4%(+12.4)#91 | 16.9%(+10.9)#12,749 |
| 92. | Evergreen | 28.4% | 15.4%(+13.0)#92 | 16.9%(+11.5)#12,945 |
| 93. | Rocky Boy West | 28.8% | 15.4%(+13.5)#93 | 16.9%(+11.9)#13,066 |
| 94. | Plains | 29.4% | 15.4%(+14.0)#94 | 16.9%(+12.5)#13,202 |
| 95. | Polson | 30.1% | 15.4%(+14.7)#95 | 16.9%(+13.2)#13,392 |
| 96. | East Glacier Park Village | 30.4% | 15.4%(+15.1)#96 | 16.9%(+13.5)#13,470 |
| 97. | Azure | 30.6% | 15.4%(+15.2)#97 | 16.9%(+13.7)#13,505 |
| 98. | Nashua | 31.2% | 15.4%(+15.9)#98 | 16.9%(+14.3)#13,697 |
| 99. | Frazer | 31.3% | 15.4%(+16.0)#99 | 16.9%(+14.4)#13,716 |
| 100. | Ryegate | 31.6% | 15.4%(+16.2)#100 | 16.9%(+14.7)#13,786 |
Common Questions
What are the Top 10 Cities with the Lowest Child Poverty Level Among Boys Under the Age of 16 in Montana?
Top 10 Cities with the Lowest Child Poverty Level Among Boys Under the Age of 16 in Montana are:
#1
1.1%
#2
1.1%
#3
1.6%
#4
1.7%
#5
1.7%
#6
2.3%
#7
3.7%
#8
4.1%
#9
4.2%
#10
4.5%
What city has the Lowest Child Poverty Level Among Boys Under the Age of 16 in Montana?
Ulm has the Lowest Child Poverty Level Among Boys Under the Age of 16 in Montana with 1.1%.
What is the Poverty Level Among Boys Under the Age of 16 in the State of Montana?
Poverty Level Among Boys Under the Age of 16 in Montana is 15.4%.
What is the Poverty Level Among Boys Under the Age of 16 in the United States?
Poverty Level Among Boys Under the Age of 16 in the United States is 16.9%.