Cities with the Lowest Child Poverty Level Among Boys Under the Age of 16 in Idaho
RELATED REPORTS & OPTIONS
Lowest Poverty | Boys 0-16
Idaho
Compare Cities
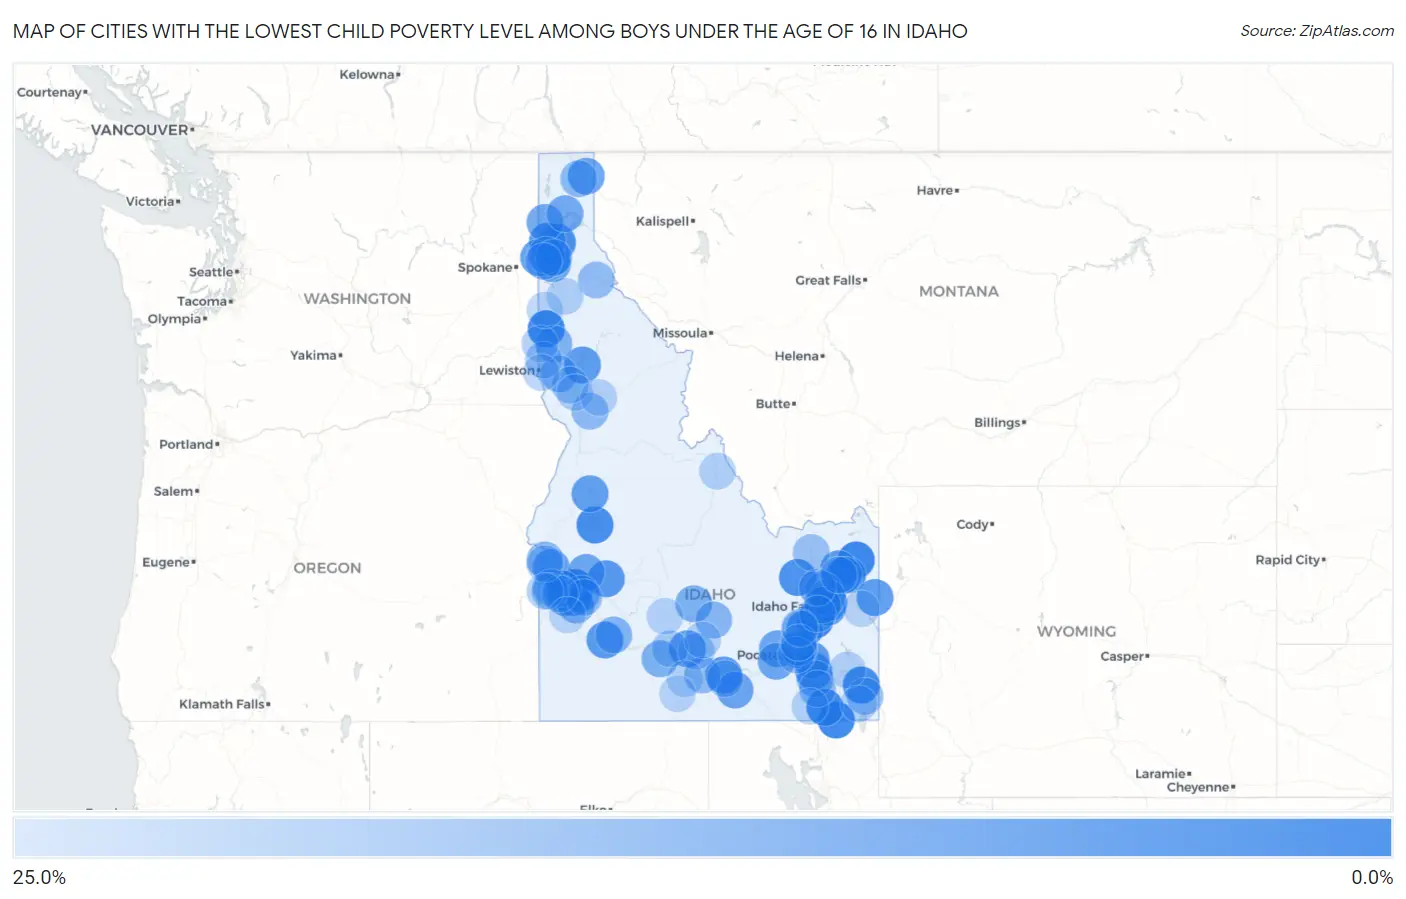
Map of Cities with the Lowest Child Poverty Level Among Boys Under the Age of 16 in Idaho
25.0%
0.0%
Cities with the Lowest Child Poverty Level Among Boys Under the Age of 16 in Idaho
| City | Child Poverty (Boys) | vs State | vs National | |
| 1. | Firth | 1.1% | 13.4%(-12.3)#1 | 16.9%(-15.8)#206 |
| 2. | Ashton | 1.7% | 13.4%(-11.7)#2 | 16.9%(-15.2)#468 |
| 3. | Potlatch | 1.9% | 13.4%(-11.5)#3 | 16.9%(-15.0)#573 |
| 4. | Franklin | 1.9% | 13.4%(-11.5)#4 | 16.9%(-15.0)#583 |
| 5. | Star | 2.2% | 13.4%(-11.2)#5 | 16.9%(-14.7)#776 |
| 6. | Eagle | 2.4% | 13.4%(-11.0)#6 | 16.9%(-14.5)#888 |
| 7. | Clifton | 2.6% | 13.4%(-10.8)#7 | 16.9%(-14.3)#974 |
| 8. | Iona | 3.1% | 13.4%(-10.3)#8 | 16.9%(-13.8)#1,279 |
| 9. | Georgetown | 3.2% | 13.4%(-10.2)#9 | 16.9%(-13.7)#1,372 |
| 10. | Cascade | 3.5% | 13.4%(-9.86)#10 | 16.9%(-13.4)#1,563 |
| 11. | Hayden | 3.6% | 13.4%(-9.78)#11 | 16.9%(-13.3)#1,613 |
| 12. | Mud Lake | 4.2% | 13.4%(-9.18)#12 | 16.9%(-12.7)#1,947 |
| 13. | Athol | 4.3% | 13.4%(-9.15)#13 | 16.9%(-12.6)#1,963 |
| 14. | Newdale | 4.5% | 13.4%(-8.86)#14 | 16.9%(-12.4)#2,138 |
| 15. | Mccammon | 5.4% | 13.4%(-8.00)#15 | 16.9%(-11.5)#2,656 |
| 16. | Spirit Lake | 5.6% | 13.4%(-7.78)#16 | 16.9%(-11.3)#2,790 |
| 17. | Blackfoot | 5.6% | 13.4%(-7.77)#17 | 16.9%(-11.3)#2,801 |
| 18. | Idaho City | 5.9% | 13.4%(-7.52)#18 | 16.9%(-11.0)#2,940 |
| 19. | Paul | 6.3% | 13.4%(-7.10)#19 | 16.9%(-10.6)#3,191 |
| 20. | Mountain Home Afb | 6.5% | 13.4%(-6.94)#20 | 16.9%(-10.4)#3,295 |
| 21. | Victor | 6.7% | 13.4%(-6.68)#21 | 16.9%(-10.2)#3,441 |
| 22. | Meridian | 6.8% | 13.4%(-6.60)#22 | 16.9%(-10.1)#3,486 |
| 23. | Orofino | 6.8% | 13.4%(-6.58)#23 | 16.9%(-10.1)#3,496 |
| 24. | Inkom | 6.8% | 13.4%(-6.58)#24 | 16.9%(-10.1)#3,500 |
| 25. | Parker | 6.9% | 13.4%(-6.46)#25 | 16.9%(-9.96)#3,578 |
| 26. | Teton | 7.1% | 13.4%(-6.32)#26 | 16.9%(-9.82)#3,658 |
| 27. | Shoshone | 7.3% | 13.4%(-6.08)#27 | 16.9%(-9.59)#3,795 |
| 28. | Mccall | 7.6% | 13.4%(-5.78)#28 | 16.9%(-9.28)#3,954 |
| 29. | Hauser | 7.7% | 13.4%(-5.71)#29 | 16.9%(-9.21)#3,989 |
| 30. | New Plymouth | 8.0% | 13.4%(-5.44)#30 | 16.9%(-8.94)#4,159 |
| 31. | Ammon | 8.2% | 13.4%(-5.24)#31 | 16.9%(-8.74)#4,260 |
| 32. | Chubbuck | 8.3% | 13.4%(-5.10)#32 | 16.9%(-8.60)#4,334 |
| 33. | Albion | 8.5% | 13.4%(-4.89)#33 | 16.9%(-8.39)#4,499 |
| 34. | Moyie Springs | 8.6% | 13.4%(-4.81)#34 | 16.9%(-8.31)#4,547 |
| 35. | Coeur D Alene | 8.7% | 13.4%(-4.67)#35 | 16.9%(-8.18)#4,629 |
| 36. | Aberdeen | 9.1% | 13.4%(-4.31)#36 | 16.9%(-7.81)#4,796 |
| 37. | Lewisville | 9.2% | 13.4%(-4.17)#37 | 16.9%(-7.67)#4,931 |
| 38. | American Falls | 9.3% | 13.4%(-4.09)#38 | 16.9%(-7.59)#4,972 |
| 39. | Horseshoe Bend | 9.6% | 13.4%(-3.81)#39 | 16.9%(-7.31)#5,109 |
| 40. | Priest River | 9.7% | 13.4%(-3.72)#40 | 16.9%(-7.23)#5,151 |
| 41. | Ucon | 10.1% | 13.4%(-3.32)#41 | 16.9%(-6.83)#5,396 |
| 42. | Sandpoint | 10.2% | 13.4%(-3.25)#42 | 16.9%(-6.75)#5,427 |
| 43. | Nampa | 10.2% | 13.4%(-3.24)#43 | 16.9%(-6.74)#5,428 |
| 44. | Idaho Falls | 10.7% | 13.4%(-2.69)#44 | 16.9%(-6.20)#5,715 |
| 45. | Roberts | 10.9% | 13.4%(-2.46)#45 | 16.9%(-5.97)#5,838 |
| 46. | Rathdrum | 11.3% | 13.4%(-2.12)#46 | 16.9%(-5.62)#6,002 |
| 47. | Hagerman | 11.8% | 13.4%(-1.64)#47 | 16.9%(-5.14)#6,237 |
| 48. | Hailey | 11.9% | 13.4%(-1.52)#48 | 16.9%(-5.03)#6,315 |
| 49. | Troy | 12.2% | 13.4%(-1.24)#49 | 16.9%(-4.74)#6,450 |
| 50. | Garden City | 12.9% | 13.4%(-0.526)#50 | 16.9%(-4.03)#6,814 |
| 51. | Mountain Home | 13.0% | 13.4%(-0.449)#51 | 16.9%(-3.95)#6,845 |
| 52. | Arimo | 13.0% | 13.4%(-0.439)#52 | 16.9%(-3.94)#6,854 |
| 53. | Payette | 13.0% | 13.4%(-0.358)#53 | 16.9%(-3.86)#6,877 |
| 54. | Culdesac | 13.2% | 13.4%(-0.244)#54 | 16.9%(-3.75)#6,955 |
| 55. | Carey | 13.5% | 13.4%(+0.135)#55 | 16.9%(-3.37)#7,143 |
| 56. | Kuna | 13.6% | 13.4%(+0.211)#56 | 16.9%(-3.29)#7,174 |
| 57. | Middleton | 13.8% | 13.4%(+0.425)#57 | 16.9%(-3.08)#7,299 |
| 58. | Bonners Ferry | 14.0% | 13.4%(+0.598)#58 | 16.9%(-2.90)#7,378 |
| 59. | Notus | 14.1% | 13.4%(+0.716)#59 | 16.9%(-2.79)#7,435 |
| 60. | Hayden Lake | 14.3% | 13.4%(+0.884)#60 | 16.9%(-2.62)#7,500 |
| 61. | Post Falls | 14.5% | 13.4%(+1.07)#61 | 16.9%(-2.43)#7,608 |
| 62. | Grangeville | 14.5% | 13.4%(+1.08)#62 | 16.9%(-2.42)#7,615 |
| 63. | Hazelton | 14.6% | 13.4%(+1.20)#63 | 16.9%(-2.31)#7,676 |
| 64. | Downey | 14.7% | 13.4%(+1.28)#64 | 16.9%(-2.22)#7,713 |
| 65. | Tyhee | 14.7% | 13.4%(+1.29)#65 | 16.9%(-2.21)#7,715 |
| 66. | Montpelier | 14.9% | 13.4%(+1.53)#66 | 16.9%(-1.97)#7,836 |
| 67. | Osburn | 15.2% | 13.4%(+1.75)#67 | 16.9%(-1.75)#7,919 |
| 68. | Moreland | 15.2% | 13.4%(+1.75)#68 | 16.9%(-1.75)#7,920 |
| 69. | Craigmont | 15.7% | 13.4%(+2.28)#69 | 16.9%(-1.22)#8,167 |
| 70. | Boise City | 15.7% | 13.4%(+2.35)#70 | 16.9%(-1.15)#8,193 |
| 71. | Dubois | 16.0% | 13.4%(+2.60)#71 | 16.9%(-0.904)#8,321 |
| 72. | Greenleaf | 16.7% | 13.4%(+3.26)#72 | 16.9%(-0.237)#8,622 |
| 73. | Caldwell | 16.9% | 13.4%(+3.46)#73 | 16.9%(-0.046)#8,739 |
| 74. | Heyburn | 17.1% | 13.4%(+3.74)#74 | 16.9%(+0.233)#8,835 |
| 75. | Genesee | 17.3% | 13.4%(+3.94)#75 | 16.9%(+0.437)#8,926 |
| 76. | Sugar City | 17.4% | 13.4%(+3.95)#76 | 16.9%(+0.446)#8,935 |
| 77. | Dietrich | 17.5% | 13.4%(+4.10)#77 | 16.9%(+0.596)#9,016 |
| 78. | Gooding | 17.7% | 13.4%(+4.26)#78 | 16.9%(+0.761)#9,108 |
| 79. | Fruitland | 18.0% | 13.4%(+4.59)#79 | 16.9%(+1.09)#9,214 |
| 80. | Pocatello | 18.1% | 13.4%(+4.74)#80 | 16.9%(+1.24)#9,265 |
| 81. | Moscow | 18.6% | 13.4%(+5.16)#81 | 16.9%(+1.65)#9,479 |
| 82. | Wilder | 19.1% | 13.4%(+5.72)#82 | 16.9%(+2.21)#9,703 |
| 83. | St Maries | 19.2% | 13.4%(+5.81)#83 | 16.9%(+2.31)#9,745 |
| 84. | Soda Springs | 19.3% | 13.4%(+5.87)#84 | 16.9%(+2.36)#9,776 |
| 85. | Malad City | 19.6% | 13.4%(+6.20)#85 | 16.9%(+2.70)#9,901 |
| 86. | Lewiston | 19.7% | 13.4%(+6.30)#86 | 16.9%(+2.80)#9,932 |
| 87. | Paris | 19.7% | 13.4%(+6.31)#87 | 16.9%(+2.80)#9,938 |
| 88. | Richfield | 19.7% | 13.4%(+6.33)#88 | 16.9%(+2.83)#9,952 |
| 89. | Riverside | 19.8% | 13.4%(+6.37)#89 | 16.9%(+2.87)#9,969 |
| 90. | Salmon | 19.8% | 13.4%(+6.44)#90 | 16.9%(+2.93)#9,988 |
| 91. | Fairfield | 20.0% | 13.4%(+6.60)#91 | 16.9%(+3.10)#10,068 |
| 92. | Ferdinand | 20.0% | 13.4%(+6.60)#92 | 16.9%(+3.10)#10,102 |
| 93. | Stites | 20.0% | 13.4%(+6.60)#93 | 16.9%(+3.10)#10,105 |
| 94. | De Smet | 20.0% | 13.4%(+6.60)#94 | 16.9%(+3.10)#10,116 |
| 95. | Twin Falls | 20.4% | 13.4%(+6.99)#95 | 16.9%(+3.49)#10,254 |
| 96. | Fort Hall | 20.5% | 13.4%(+7.07)#96 | 16.9%(+3.57)#10,276 |
| 97. | Hollister | 20.5% | 13.4%(+7.11)#97 | 16.9%(+3.61)#10,289 |
| 98. | Shelley | 20.6% | 13.4%(+7.17)#98 | 16.9%(+3.67)#10,300 |
| 99. | Swan Valley | 20.6% | 13.4%(+7.19)#99 | 16.9%(+3.68)#10,309 |
| 100. | Melba | 20.7% | 13.4%(+7.25)#100 | 16.9%(+3.75)#10,334 |
Common Questions
What are the Top 10 Cities with the Lowest Child Poverty Level Among Boys Under the Age of 16 in Idaho?
Top 10 Cities with the Lowest Child Poverty Level Among Boys Under the Age of 16 in Idaho are:
What city has the Lowest Child Poverty Level Among Boys Under the Age of 16 in Idaho?
Firth has the Lowest Child Poverty Level Among Boys Under the Age of 16 in Idaho with 1.1%.
What is the Poverty Level Among Boys Under the Age of 16 in the State of Idaho?
Poverty Level Among Boys Under the Age of 16 in Idaho is 13.4%.
What is the Poverty Level Among Boys Under the Age of 16 in the United States?
Poverty Level Among Boys Under the Age of 16 in the United States is 16.9%.