Cities with the Lowest Child Poverty Level Among Boys Under the Age of 16 in Colorado
RELATED REPORTS & OPTIONS
Lowest Poverty | Boys 0-16
Colorado
Compare Cities
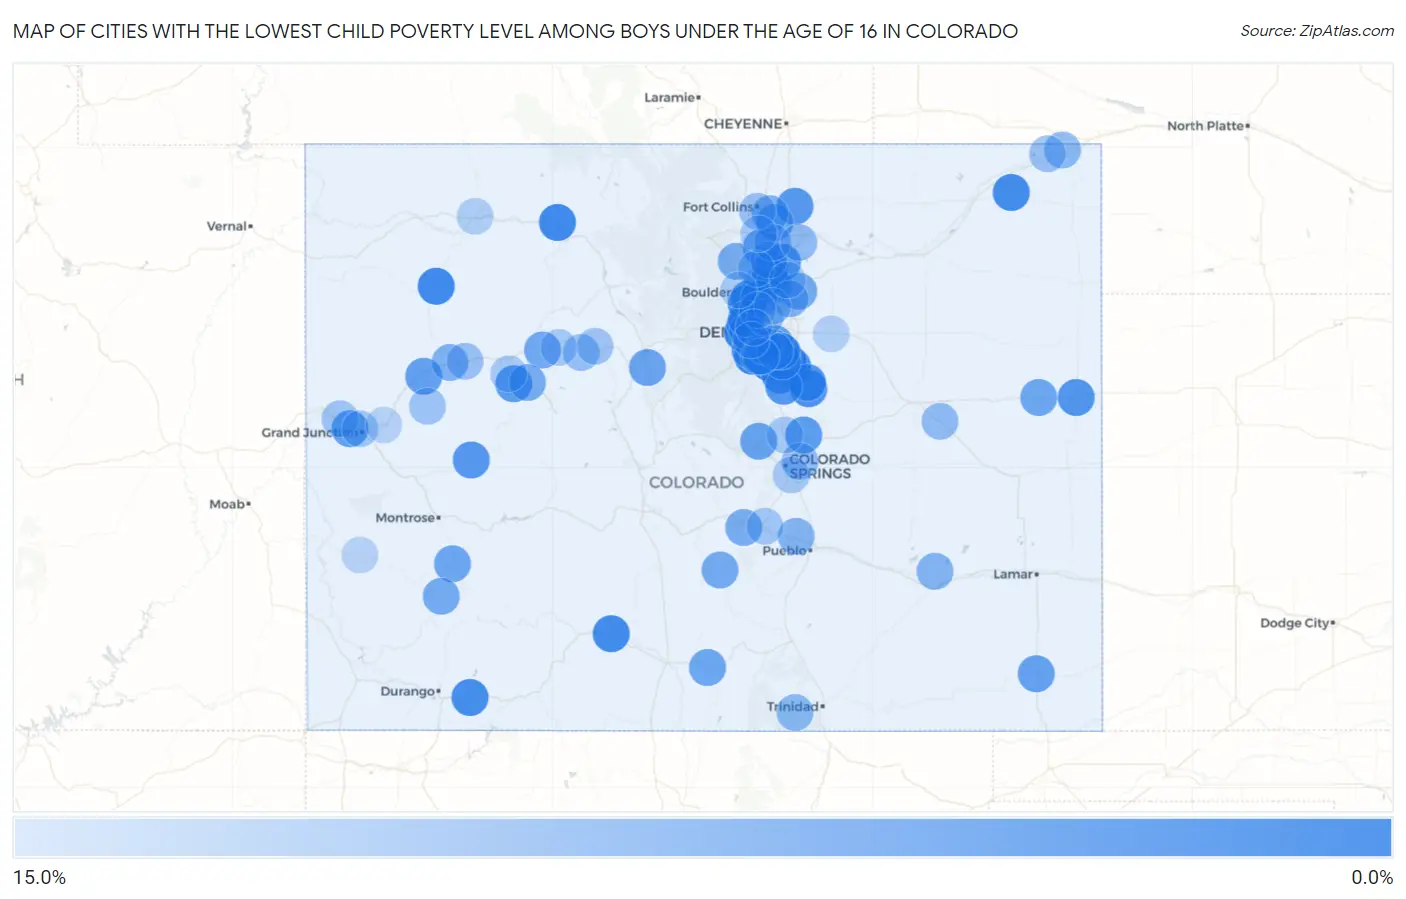
Map of Cities with the Lowest Child Poverty Level Among Boys Under the Age of 16 in Colorado
15.0%
0.0%
Cities with the Lowest Child Poverty Level Among Boys Under the Age of 16 in Colorado
| City | Child Poverty (Boys) | vs State | vs National | |
| 1. | Golden | 0.34% | 11.5%(-11.1)#1 | 16.9%(-16.6)#14 |
| 2. | Ken Caryl | 0.50% | 11.5%(-11.0)#2 | 16.9%(-16.4)#38 |
| 3. | Highlands Ranch | 0.58% | 11.5%(-10.9)#3 | 16.9%(-16.3)#50 |
| 4. | Firestone | 0.68% | 11.5%(-10.8)#4 | 16.9%(-16.2)#74 |
| 5. | Fairmount | 0.74% | 11.5%(-10.7)#5 | 16.9%(-16.2)#93 |
| 6. | Steamboat Springs | 1.0% | 11.5%(-10.4)#6 | 16.9%(-15.9)#187 |
| 7. | Meeker | 1.1% | 11.5%(-10.4)#7 | 16.9%(-15.8)#200 |
| 8. | Superior | 1.1% | 11.5%(-10.3)#8 | 16.9%(-15.8)#220 |
| 9. | Sterling Ranch | 1.3% | 11.5%(-10.2)#9 | 16.9%(-15.6)#278 |
| 10. | Fleming | 1.3% | 11.5%(-10.2)#10 | 16.9%(-15.6)#284 |
| 11. | Parker | 1.3% | 11.5%(-10.1)#11 | 16.9%(-15.6)#305 |
| 12. | Del Norte | 1.3% | 11.5%(-10.1)#12 | 16.9%(-15.6)#306 |
| 13. | Bayfield | 1.6% | 11.5%(-9.90)#13 | 16.9%(-15.3)#385 |
| 14. | Bow Mar | 1.6% | 11.5%(-9.90)#14 | 16.9%(-15.3)#388 |
| 15. | Stonegate | 1.9% | 11.5%(-9.60)#15 | 16.9%(-15.0)#551 |
| 16. | Castle Pines | 2.2% | 11.5%(-9.29)#16 | 16.9%(-14.7)#737 |
| 17. | Elizabeth | 2.2% | 11.5%(-9.26)#17 | 16.9%(-14.7)#762 |
| 18. | Centennial | 2.4% | 11.5%(-9.03)#18 | 16.9%(-14.5)#893 |
| 19. | Ponderosa Park | 2.5% | 11.5%(-8.98)#19 | 16.9%(-14.4)#918 |
| 20. | Burlington | 2.6% | 11.5%(-8.90)#20 | 16.9%(-14.3)#961 |
| 21. | Erie | 2.6% | 11.5%(-8.88)#21 | 16.9%(-14.3)#982 |
| 22. | Platteville | 2.9% | 11.5%(-8.58)#22 | 16.9%(-14.0)#1,149 |
| 23. | Paonia | 3.0% | 11.5%(-8.50)#23 | 16.9%(-13.9)#1,198 |
| 24. | Castle Rock | 3.0% | 11.5%(-8.43)#24 | 16.9%(-13.9)#1,247 |
| 25. | Meridian | 3.1% | 11.5%(-8.39)#25 | 16.9%(-13.8)#1,280 |
| 26. | Ault | 3.1% | 11.5%(-8.36)#26 | 16.9%(-13.8)#1,302 |
| 27. | Carbondale | 3.3% | 11.5%(-8.15)#27 | 16.9%(-13.6)#1,428 |
| 28. | Dakota Ridge | 3.4% | 11.5%(-8.10)#28 | 16.9%(-13.5)#1,462 |
| 29. | Applewood | 3.4% | 11.5%(-8.02)#29 | 16.9%(-13.5)#1,507 |
| 30. | Black Forest | 3.6% | 11.5%(-7.89)#30 | 16.9%(-13.3)#1,595 |
| 31. | Four Square Mile | 3.6% | 11.5%(-7.86)#31 | 16.9%(-13.3)#1,608 |
| 32. | Columbine | 3.8% | 11.5%(-7.69)#32 | 16.9%(-13.1)#1,693 |
| 33. | Louisville | 3.9% | 11.5%(-7.52)#33 | 16.9%(-13.0)#1,796 |
| 34. | Frederick | 4.0% | 11.5%(-7.43)#34 | 16.9%(-12.9)#1,837 |
| 35. | Redlands | 4.0% | 11.5%(-7.43)#35 | 16.9%(-12.9)#1,840 |
| 36. | Battlement Mesa | 4.2% | 11.5%(-7.24)#36 | 16.9%(-12.7)#1,939 |
| 37. | Holly Hills | 4.2% | 11.5%(-7.23)#37 | 16.9%(-12.7)#1,949 |
| 38. | Springfield | 4.3% | 11.5%(-7.18)#38 | 16.9%(-12.6)#1,978 |
| 39. | Berthoud | 4.6% | 11.5%(-6.85)#39 | 16.9%(-12.3)#2,170 |
| 40. | Cherry Hills Village | 4.6% | 11.5%(-6.85)#40 | 16.9%(-12.3)#2,171 |
| 41. | Woodland Park | 4.6% | 11.5%(-6.82)#41 | 16.9%(-12.3)#2,184 |
| 42. | Breckenridge | 4.9% | 11.5%(-6.54)#42 | 16.9%(-12.0)#2,345 |
| 43. | Windsor | 4.9% | 11.5%(-6.54)#43 | 16.9%(-12.0)#2,347 |
| 44. | Blanca | 5.0% | 11.5%(-6.46)#44 | 16.9%(-11.9)#2,393 |
| 45. | Dacono | 5.0% | 11.5%(-6.44)#45 | 16.9%(-11.9)#2,414 |
| 46. | Stratton | 5.1% | 11.5%(-6.35)#46 | 16.9%(-11.8)#2,456 |
| 47. | Ridgway | 5.1% | 11.5%(-6.33)#47 | 16.9%(-11.8)#2,474 |
| 48. | Englewood | 5.3% | 11.5%(-6.13)#48 | 16.9%(-11.6)#2,604 |
| 49. | Gypsum | 5.4% | 11.5%(-6.05)#49 | 16.9%(-11.5)#2,668 |
| 50. | Silver Cliff | 5.6% | 11.5%(-5.88)#50 | 16.9%(-11.3)#2,773 |
| 51. | Lochbuie | 5.7% | 11.5%(-5.73)#51 | 16.9%(-11.2)#2,858 |
| 52. | Mountain Village | 5.8% | 11.5%(-5.65)#52 | 16.9%(-11.1)#2,906 |
| 53. | Cherry Creek | 5.8% | 11.5%(-5.61)#53 | 16.9%(-11.1)#2,920 |
| 54. | Lyons | 5.9% | 11.5%(-5.52)#54 | 16.9%(-11.0)#2,977 |
| 55. | El Jebel | 6.0% | 11.5%(-5.44)#55 | 16.9%(-10.9)#3,014 |
| 56. | Sheridan | 6.1% | 11.5%(-5.34)#56 | 16.9%(-10.8)#3,075 |
| 57. | Greenwood Village | 6.2% | 11.5%(-5.24)#57 | 16.9%(-10.7)#3,130 |
| 58. | Brookside | 6.2% | 11.5%(-5.21)#58 | 16.9%(-10.7)#3,162 |
| 59. | Littleton | 6.4% | 11.5%(-5.09)#59 | 16.9%(-10.5)#3,239 |
| 60. | Timnath | 6.7% | 11.5%(-4.78)#60 | 16.9%(-10.2)#3,431 |
| 61. | Rifle | 6.9% | 11.5%(-4.60)#61 | 16.9%(-10.0)#3,524 |
| 62. | Pueblo West | 7.1% | 11.5%(-4.38)#62 | 16.9%(-9.82)#3,652 |
| 63. | Arvada | 7.1% | 11.5%(-4.38)#63 | 16.9%(-9.82)#3,654 |
| 64. | Cheraw | 7.1% | 11.5%(-4.32)#64 | 16.9%(-9.76)#3,708 |
| 65. | Brighton | 7.2% | 11.5%(-4.30)#65 | 16.9%(-9.74)#3,716 |
| 66. | Mead | 7.3% | 11.5%(-4.17)#66 | 16.9%(-9.61)#3,777 |
| 67. | Ovid | 7.7% | 11.5%(-3.77)#67 | 16.9%(-9.21)#4,014 |
| 68. | Segundo | 7.7% | 11.5%(-3.77)#68 | 16.9%(-9.21)#4,024 |
| 69. | Broomfield | 8.0% | 11.5%(-3.44)#69 | 16.9%(-8.88)#4,198 |
| 70. | Johnstown | 8.2% | 11.5%(-3.29)#70 | 16.9%(-8.73)#4,269 |
| 71. | La Salle | 8.2% | 11.5%(-3.24)#71 | 16.9%(-8.68)#4,302 |
| 72. | Sherrelwood | 8.3% | 11.5%(-3.15)#72 | 16.9%(-8.59)#4,337 |
| 73. | Hugo | 8.3% | 11.5%(-3.13)#73 | 16.9%(-8.57)#4,359 |
| 74. | Thornton | 8.5% | 11.5%(-2.98)#74 | 16.9%(-8.42)#4,482 |
| 75. | Cimarron Hills | 8.7% | 11.5%(-2.81)#75 | 16.9%(-8.25)#4,575 |
| 76. | Edwards | 8.7% | 11.5%(-2.80)#76 | 16.9%(-8.24)#4,582 |
| 77. | Westminster | 9.0% | 11.5%(-2.44)#77 | 16.9%(-7.89)#4,768 |
| 78. | Silt | 9.1% | 11.5%(-2.41)#78 | 16.9%(-7.85)#4,782 |
| 79. | Sedgwick | 9.1% | 11.5%(-2.37)#79 | 16.9%(-7.81)#4,842 |
| 80. | Fort Collins | 9.1% | 11.5%(-2.36)#80 | 16.9%(-7.81)#4,848 |
| 81. | Longmont | 9.2% | 11.5%(-2.30)#81 | 16.9%(-7.74)#4,878 |
| 82. | Fruita | 9.4% | 11.5%(-2.05)#82 | 16.9%(-7.49)#5,028 |
| 83. | Collbran | 9.5% | 11.5%(-1.94)#83 | 16.9%(-7.38)#5,078 |
| 84. | Avon | 9.6% | 11.5%(-1.88)#84 | 16.9%(-7.33)#5,102 |
| 85. | Penrose | 9.8% | 11.5%(-1.65)#85 | 16.9%(-7.09)#5,234 |
| 86. | Grand Junction | 9.9% | 11.5%(-1.53)#86 | 16.9%(-6.97)#5,285 |
| 87. | Stratmoor | 10.2% | 11.5%(-1.30)#87 | 16.9%(-6.74)#5,429 |
| 88. | Loveland | 10.4% | 11.5%(-1.09)#88 | 16.9%(-6.53)#5,531 |
| 89. | Eagle | 10.4% | 11.5%(-1.04)#89 | 16.9%(-6.49)#5,556 |
| 90. | Gleneagle | 10.4% | 11.5%(-1.02)#90 | 16.9%(-6.46)#5,570 |
| 91. | Cattle Creek | 10.4% | 11.5%(-1.01)#91 | 16.9%(-6.46)#5,577 |
| 92. | Twin Lakes Cdp Adams County | 10.5% | 11.5%(-0.991)#92 | 16.9%(-6.43)#5,588 |
| 93. | Boulder | 10.7% | 11.5%(-0.732)#93 | 16.9%(-6.17)#5,737 |
| 94. | Craig | 10.9% | 11.5%(-0.576)#94 | 16.9%(-6.02)#5,810 |
| 95. | Fort Lupton | 11.0% | 11.5%(-0.430)#95 | 16.9%(-5.87)#5,866 |
| 96. | Lakewood | 11.1% | 11.5%(-0.362)#96 | 16.9%(-5.80)#5,890 |
| 97. | Wheat Ridge | 11.2% | 11.5%(-0.233)#97 | 16.9%(-5.68)#5,977 |
| 98. | Bennett | 11.3% | 11.5%(-0.141)#98 | 16.9%(-5.58)#6,013 |
| 99. | Naturita | 11.6% | 11.5%(+0.166)#99 | 16.9%(-5.28)#6,167 |
| 100. | Palisade | 11.7% | 11.5%(+0.247)#100 | 16.9%(-5.19)#6,208 |
Common Questions
What are the Top 10 Cities with the Lowest Child Poverty Level Among Boys Under the Age of 16 in Colorado?
Top 10 Cities with the Lowest Child Poverty Level Among Boys Under the Age of 16 in Colorado are:
#1
0.34%
#2
0.50%
#3
0.58%
#4
0.68%
#5
0.74%
#6
1.0%
#7
1.1%
#8
1.1%
#9
1.3%
#10
1.3%
What city has the Lowest Child Poverty Level Among Boys Under the Age of 16 in Colorado?
Golden has the Lowest Child Poverty Level Among Boys Under the Age of 16 in Colorado with 0.34%.
What is the Poverty Level Among Boys Under the Age of 16 in the State of Colorado?
Poverty Level Among Boys Under the Age of 16 in Colorado is 11.5%.
What is the Poverty Level Among Boys Under the Age of 16 in the United States?
Poverty Level Among Boys Under the Age of 16 in the United States is 16.9%.