Cities with the Lowest Child Poverty Level Among Boys Under the Age of 16 in Illinois
RELATED REPORTS & OPTIONS
Lowest Poverty | Boys 0-16
Illinois
Compare Cities
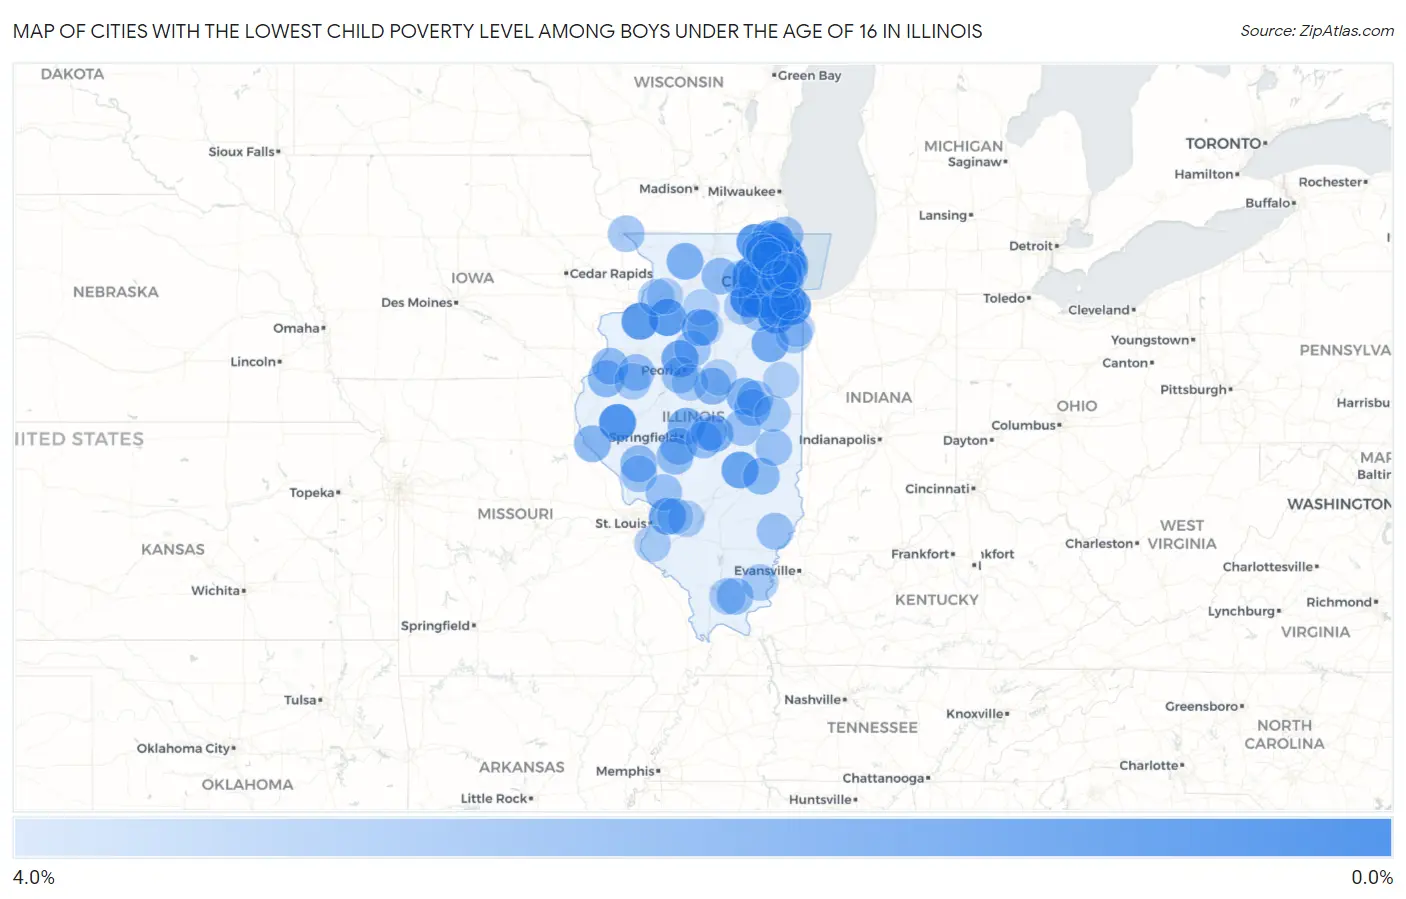
Map of Cities with the Lowest Child Poverty Level Among Boys Under the Age of 16 in Illinois
4.0%
0.0%
Cities with the Lowest Child Poverty Level Among Boys Under the Age of 16 in Illinois
| City | Child Poverty (Boys) | vs State | vs National | |
| 1. | Hinsdale | 0.22% | 15.8%(-15.6)#1 | 16.9%(-16.7)#5 |
| 2. | Campton Hills | 0.58% | 15.8%(-15.2)#2 | 16.9%(-16.3)#48 |
| 3. | Yorkville | 0.60% | 15.8%(-15.2)#3 | 16.9%(-16.3)#55 |
| 4. | Deerfield | 0.63% | 15.8%(-15.2)#4 | 16.9%(-16.3)#64 |
| 5. | Oswego | 0.69% | 15.8%(-15.1)#5 | 16.9%(-16.2)#76 |
| 6. | Manhattan | 0.71% | 15.8%(-15.1)#6 | 16.9%(-16.2)#85 |
| 7. | Western Springs | 0.81% | 15.8%(-15.0)#7 | 16.9%(-16.1)#112 |
| 8. | Mount Sterling | 0.89% | 15.8%(-14.9)#8 | 16.9%(-16.0)#131 |
| 9. | Flossmoor | 0.97% | 15.8%(-14.8)#9 | 16.9%(-15.9)#157 |
| 10. | Highland Park | 1.0% | 15.8%(-14.8)#10 | 16.9%(-15.9)#182 |
| 11. | Wonder Lake | 1.2% | 15.8%(-14.6)#11 | 16.9%(-15.7)#234 |
| 12. | Lake Forest | 1.2% | 15.8%(-14.6)#12 | 16.9%(-15.7)#245 |
| 13. | Annawan | 1.2% | 15.8%(-14.6)#13 | 16.9%(-15.7)#251 |
| 14. | Orion | 1.2% | 15.8%(-14.6)#14 | 16.9%(-15.7)#257 |
| 15. | Plainfield | 1.5% | 15.8%(-14.3)#15 | 16.9%(-15.4)#355 |
| 16. | Frankfort Square | 1.5% | 15.8%(-14.3)#16 | 16.9%(-15.4)#364 |
| 17. | Strasburg | 1.6% | 15.8%(-14.3)#17 | 16.9%(-15.3)#389 |
| 18. | Northbrook | 1.6% | 15.8%(-14.2)#18 | 16.9%(-15.3)#391 |
| 19. | St Charles | 1.6% | 15.8%(-14.2)#19 | 16.9%(-15.3)#418 |
| 20. | Hennepin | 1.7% | 15.8%(-14.2)#20 | 16.9%(-15.2)#435 |
| 21. | Kildeer | 1.7% | 15.8%(-14.1)#21 | 16.9%(-15.2)#442 |
| 22. | Island Lake | 1.7% | 15.8%(-14.1)#22 | 16.9%(-15.2)#453 |
| 23. | Dunlap | 1.7% | 15.8%(-14.1)#23 | 16.9%(-15.2)#467 |
| 24. | Troy | 1.7% | 15.8%(-14.1)#24 | 16.9%(-15.2)#481 |
| 25. | North Riverside | 1.8% | 15.8%(-14.0)#25 | 16.9%(-15.1)#508 |
| 26. | Herscher | 1.8% | 15.8%(-14.0)#26 | 16.9%(-15.1)#524 |
| 27. | Inverness | 1.9% | 15.8%(-13.9)#27 | 16.9%(-15.0)#560 |
| 28. | Lindenhurst | 1.9% | 15.8%(-13.9)#28 | 16.9%(-15.0)#574 |
| 29. | Northfield | 1.9% | 15.8%(-13.9)#29 | 16.9%(-15.0)#590 |
| 30. | Riverwoods | 2.0% | 15.8%(-13.8)#30 | 16.9%(-14.9)#614 |
| 31. | Wilmette | 2.0% | 15.8%(-13.8)#31 | 16.9%(-14.9)#617 |
| 32. | Williamsville | 2.0% | 15.8%(-13.8)#32 | 16.9%(-14.9)#624 |
| 33. | Libertyville | 2.0% | 15.8%(-13.8)#33 | 16.9%(-14.9)#627 |
| 34. | La Grange | 2.0% | 15.8%(-13.8)#34 | 16.9%(-14.9)#644 |
| 35. | Harristown | 2.1% | 15.8%(-13.7)#35 | 16.9%(-14.8)#669 |
| 36. | Forreston | 2.1% | 15.8%(-13.7)#36 | 16.9%(-14.8)#675 |
| 37. | Downers Grove | 2.1% | 15.8%(-13.7)#37 | 16.9%(-14.8)#703 |
| 38. | Roselle | 2.1% | 15.8%(-13.7)#38 | 16.9%(-14.8)#720 |
| 39. | Bellflower | 2.2% | 15.8%(-13.6)#39 | 16.9%(-14.7)#743 |
| 40. | Hull | 2.3% | 15.8%(-13.5)#40 | 16.9%(-14.6)#801 |
| 41. | Twin Grove | 2.3% | 15.8%(-13.5)#41 | 16.9%(-14.6)#815 |
| 42. | La Harpe | 2.3% | 15.8%(-13.5)#42 | 16.9%(-14.6)#845 |
| 43. | Toledo | 2.4% | 15.8%(-13.4)#43 | 16.9%(-14.5)#865 |
| 44. | Lake Villa | 2.4% | 15.8%(-13.4)#44 | 16.9%(-14.5)#872 |
| 45. | White Hall | 2.4% | 15.8%(-13.4)#45 | 16.9%(-14.5)#892 |
| 46. | Creston | 2.4% | 15.8%(-13.4)#46 | 16.9%(-14.5)#898 |
| 47. | Mahomet | 2.5% | 15.8%(-13.4)#47 | 16.9%(-14.4)#902 |
| 48. | Vernon Hills | 2.5% | 15.8%(-13.4)#48 | 16.9%(-14.4)#906 |
| 49. | Elmwood Park | 2.5% | 15.8%(-13.4)#49 | 16.9%(-14.4)#907 |
| 50. | Mokena | 2.5% | 15.8%(-13.3)#50 | 16.9%(-14.4)#911 |
| 51. | Chatham | 2.5% | 15.8%(-13.3)#51 | 16.9%(-14.4)#919 |
| 52. | Stronghurst | 2.5% | 15.8%(-13.3)#52 | 16.9%(-14.4)#925 |
| 53. | Bartlett | 2.5% | 15.8%(-13.3)#53 | 16.9%(-14.4)#948 |
| 54. | Thayer | 2.6% | 15.8%(-13.3)#54 | 16.9%(-14.3)#975 |
| 55. | Stonefort | 2.6% | 15.8%(-13.3)#55 | 16.9%(-14.3)#976 |
| 56. | Avon | 2.6% | 15.8%(-13.2)#56 | 16.9%(-14.3)#1,003 |
| 57. | Mount Auburn | 2.6% | 15.8%(-13.2)#57 | 16.9%(-14.3)#1,004 |
| 58. | Geneva | 2.7% | 15.8%(-13.1)#58 | 16.9%(-14.2)#1,027 |
| 59. | Bartonville | 2.7% | 15.8%(-13.1)#59 | 16.9%(-14.2)#1,034 |
| 60. | Winthrop Harbor | 2.7% | 15.8%(-13.1)#60 | 16.9%(-14.2)#1,039 |
| 61. | West Salem | 2.7% | 15.8%(-13.1)#61 | 16.9%(-14.2)#1,072 |
| 62. | Oakland | 2.8% | 15.8%(-13.1)#62 | 16.9%(-14.2)#1,077 |
| 63. | Carrollton | 2.8% | 15.8%(-13.1)#63 | 16.9%(-14.1)#1,080 |
| 64. | Bement | 2.8% | 15.8%(-13.0)#64 | 16.9%(-14.1)#1,089 |
| 65. | Bunker Hill | 2.8% | 15.8%(-13.0)#65 | 16.9%(-14.1)#1,100 |
| 66. | Prairie Grove | 2.8% | 15.8%(-13.0)#66 | 16.9%(-14.1)#1,126 |
| 67. | Fisher | 2.9% | 15.8%(-13.0)#67 | 16.9%(-14.0)#1,133 |
| 68. | East Dubuque | 2.9% | 15.8%(-13.0)#68 | 16.9%(-14.0)#1,134 |
| 69. | Minooka | 2.9% | 15.8%(-12.9)#69 | 16.9%(-14.0)#1,168 |
| 70. | Momence | 2.9% | 15.8%(-12.9)#70 | 16.9%(-14.0)#1,176 |
| 71. | Hopewell | 2.9% | 15.8%(-12.9)#71 | 16.9%(-14.0)#1,187 |
| 72. | New Lenox | 2.9% | 15.8%(-12.9)#72 | 16.9%(-14.0)#1,191 |
| 73. | Grandwood Park | 3.0% | 15.8%(-12.8)#73 | 16.9%(-13.9)#1,217 |
| 74. | St Joseph | 3.0% | 15.8%(-12.8)#74 | 16.9%(-13.9)#1,218 |
| 75. | Norridge | 3.0% | 15.8%(-12.8)#75 | 16.9%(-13.9)#1,248 |
| 76. | Erie | 3.1% | 15.8%(-12.8)#76 | 16.9%(-13.8)#1,269 |
| 77. | Park Ridge | 3.1% | 15.8%(-12.7)#77 | 16.9%(-13.8)#1,276 |
| 78. | Creal Springs | 3.1% | 15.8%(-12.7)#78 | 16.9%(-13.8)#1,288 |
| 79. | Bushnell | 3.1% | 15.8%(-12.7)#79 | 16.9%(-13.8)#1,292 |
| 80. | Northlake | 3.1% | 15.8%(-12.7)#80 | 16.9%(-13.8)#1,299 |
| 81. | Waterloo | 3.1% | 15.8%(-12.7)#81 | 16.9%(-13.8)#1,304 |
| 82. | Ridgway | 3.1% | 15.8%(-12.7)#82 | 16.9%(-13.8)#1,318 |
| 83. | Niantic | 3.1% | 15.8%(-12.7)#83 | 16.9%(-13.8)#1,331 |
| 84. | Newark | 3.2% | 15.8%(-12.6)#84 | 16.9%(-13.7)#1,343 |
| 85. | St Rose | 3.2% | 15.8%(-12.6)#85 | 16.9%(-13.7)#1,344 |
| 86. | Tremont | 3.2% | 15.8%(-12.6)#86 | 16.9%(-13.7)#1,353 |
| 87. | St Jacob | 3.2% | 15.8%(-12.6)#87 | 16.9%(-13.7)#1,362 |
| 88. | Barrington | 3.2% | 15.8%(-12.6)#88 | 16.9%(-13.7)#1,381 |
| 89. | Prophetstown | 3.3% | 15.8%(-12.6)#89 | 16.9%(-13.6)#1,400 |
| 90. | Port Barrington | 3.3% | 15.8%(-12.5)#90 | 16.9%(-13.6)#1,402 |
| 91. | Grant Park | 3.3% | 15.8%(-12.5)#91 | 16.9%(-13.6)#1,405 |
| 92. | Hudson | 3.3% | 15.8%(-12.5)#92 | 16.9%(-13.6)#1,419 |
| 93. | Elmhurst | 3.3% | 15.8%(-12.5)#93 | 16.9%(-13.6)#1,426 |
| 94. | Oak Forest | 3.3% | 15.8%(-12.5)#94 | 16.9%(-13.6)#1,431 |
| 95. | Cissna Park | 3.3% | 15.8%(-12.5)#95 | 16.9%(-13.6)#1,443 |
| 96. | La Moille | 3.3% | 15.8%(-12.5)#96 | 16.9%(-13.6)#1,445 |
| 97. | Lincolnwood | 3.4% | 15.8%(-12.5)#97 | 16.9%(-13.6)#1,461 |
| 98. | Maple Park | 3.4% | 15.8%(-12.4)#98 | 16.9%(-13.5)#1,498 |
| 99. | Granville | 3.4% | 15.8%(-12.4)#99 | 16.9%(-13.5)#1,499 |
| 100. | Lake Zurich | 3.5% | 15.8%(-12.3)#100 | 16.9%(-13.4)#1,537 |
Common Questions
What are the Top 10 Cities with the Lowest Child Poverty Level Among Boys Under the Age of 16 in Illinois?
Top 10 Cities with the Lowest Child Poverty Level Among Boys Under the Age of 16 in Illinois are:
#1
0.22%
#2
0.58%
#3
0.60%
#4
0.63%
#5
0.69%
#6
0.71%
#7
0.81%
#8
0.89%
#9
0.97%
#10
1.0%
What city has the Lowest Child Poverty Level Among Boys Under the Age of 16 in Illinois?
Hinsdale has the Lowest Child Poverty Level Among Boys Under the Age of 16 in Illinois with 0.22%.
What is the Poverty Level Among Boys Under the Age of 16 in the State of Illinois?
Poverty Level Among Boys Under the Age of 16 in Illinois is 15.8%.
What is the Poverty Level Among Boys Under the Age of 16 in the United States?
Poverty Level Among Boys Under the Age of 16 in the United States is 16.9%.