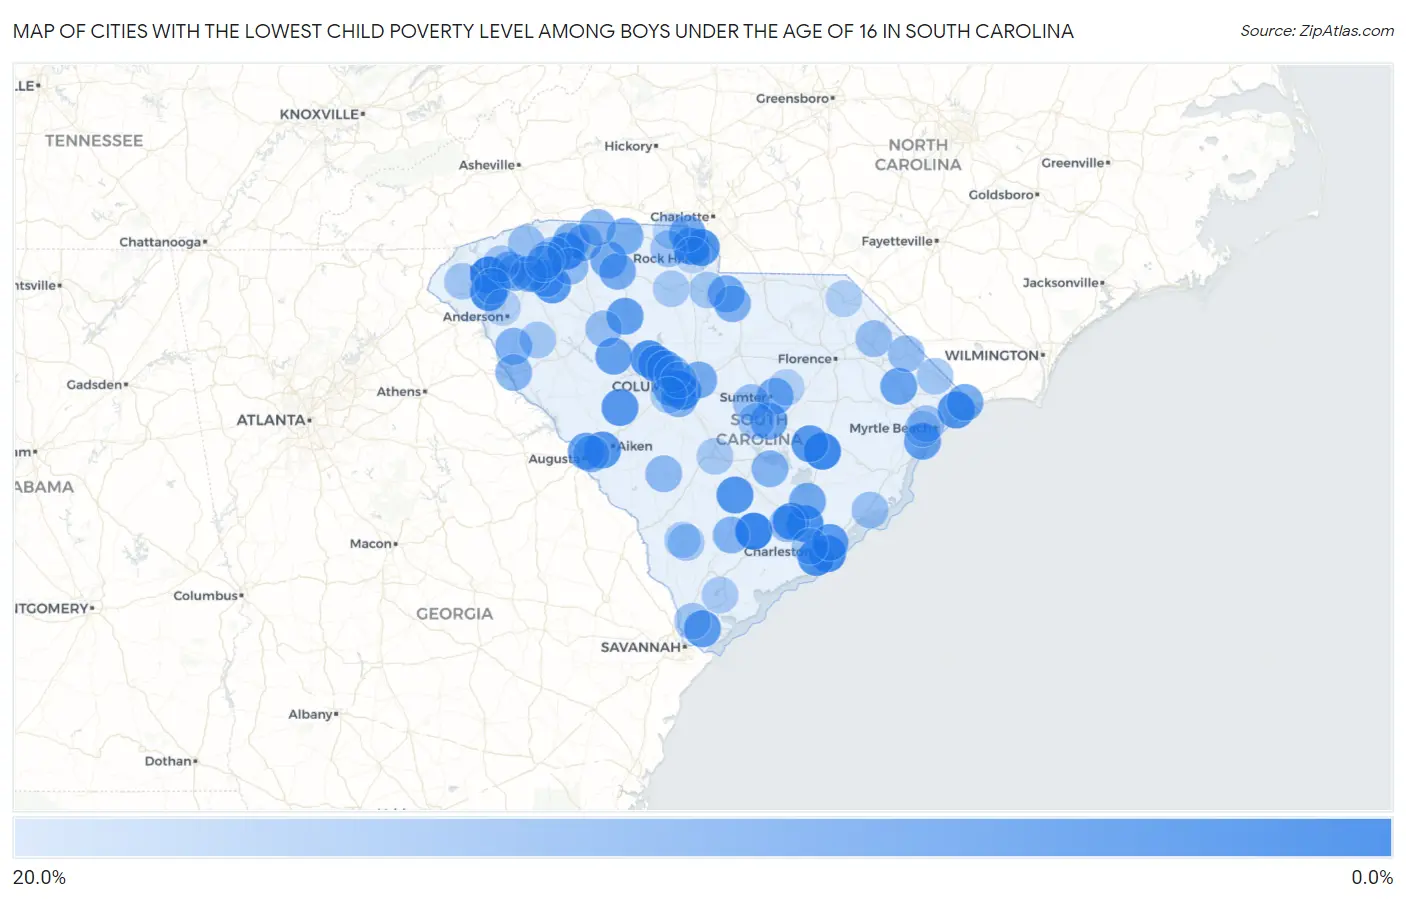
Cities with the Lowest Child Poverty Level Among Boys Under the Age of 16 in South Carolina
RELATED REPORTS & OPTIONS
Lowest Poverty | Boys 0-16
South Carolina
Compare Cities
Map of Cities with the Lowest Child Poverty Level Among Boys Under the Age of 16 in South Carolina
20.0%
0.0%
Cities with the Lowest Child Poverty Level Among Boys Under the Age of 16 in South Carolina
| City | Child Poverty (Boys) | vs State | vs National | |
| 1. | Six Mile | 1.1% | 20.8%(-19.7)#1 | 16.9%(-15.8)#223 |
| 2. | Cottageville | 1.3% | 20.8%(-19.5)#2 | 16.9%(-15.6)#286 |
| 3. | Lane | 2.4% | 20.8%(-18.4)#3 | 16.9%(-14.5)#866 |
| 4. | Springdale | 2.6% | 20.8%(-18.2)#4 | 16.9%(-14.3)#986 |
| 5. | Sullivan S Island | 2.8% | 20.8%(-18.0)#5 | 16.9%(-14.1)#1,099 |
| 6. | Lyman | 3.1% | 20.8%(-17.7)#6 | 16.9%(-13.8)#1,283 |
| 7. | Clemson | 3.1% | 20.8%(-17.7)#7 | 16.9%(-13.8)#1,303 |
| 8. | Goose Creek | 3.8% | 20.8%(-17.0)#8 | 16.9%(-13.1)#1,741 |
| 9. | James Island | 4.1% | 20.8%(-16.7)#9 | 16.9%(-12.8)#1,863 |
| 10. | Lincolnville | 4.2% | 20.8%(-16.7)#10 | 16.9%(-12.7)#1,906 |
| 11. | Little Mountain | 4.2% | 20.8%(-16.7)#11 | 16.9%(-12.7)#1,910 |
| 12. | India Hook | 4.4% | 20.8%(-16.4)#12 | 16.9%(-12.5)#2,067 |
| 13. | Fort Mill | 4.5% | 20.8%(-16.3)#13 | 16.9%(-12.4)#2,108 |
| 14. | Reevesville | 4.8% | 20.8%(-16.1)#14 | 16.9%(-12.1)#2,259 |
| 15. | North Myrtle Beach | 5.0% | 20.8%(-15.8)#15 | 16.9%(-11.9)#2,407 |
| 16. | Gloverville | 5.2% | 20.8%(-15.7)#16 | 16.9%(-11.7)#2,499 |
| 17. | Ridge Spring | 5.6% | 20.8%(-15.3)#17 | 16.9%(-11.3)#2,747 |
| 18. | Baxter | 5.6% | 20.8%(-15.2)#18 | 16.9%(-11.3)#2,802 |
| 19. | Chapin | 5.8% | 20.8%(-15.0)#19 | 16.9%(-11.1)#2,899 |
| 20. | Simpsonville | 5.9% | 20.8%(-15.0)#20 | 16.9%(-11.0)#2,928 |
| 21. | Greeleyville | 5.9% | 20.8%(-14.9)#21 | 16.9%(-11.0)#2,945 |
| 22. | Beech Island | 6.0% | 20.8%(-14.8)#22 | 16.9%(-10.9)#3,006 |
| 23. | Mount Pleasant | 6.1% | 20.8%(-14.7)#23 | 16.9%(-10.8)#3,085 |
| 24. | Bluffton | 6.4% | 20.8%(-14.4)#24 | 16.9%(-10.5)#3,240 |
| 25. | South Union | 6.9% | 20.8%(-13.9)#25 | 16.9%(-10.0)#3,549 |
| 26. | Whitmire | 6.9% | 20.8%(-13.9)#26 | 16.9%(-9.97)#3,570 |
| 27. | Garden City | 7.1% | 20.8%(-13.7)#27 | 16.9%(-9.79)#3,670 |
| 28. | Lake Murray Of Richland | 7.3% | 20.8%(-13.5)#28 | 16.9%(-9.57)#3,804 |
| 29. | Silverstreet | 7.4% | 20.8%(-13.4)#29 | 16.9%(-9.50)#3,851 |
| 30. | North Augusta | 7.4% | 20.8%(-13.4)#30 | 16.9%(-9.48)#3,859 |
| 31. | Lexington | 7.9% | 20.8%(-12.9)#31 | 16.9%(-9.00)#4,127 |
| 32. | Aynor | 8.0% | 20.8%(-12.8)#32 | 16.9%(-8.86)#4,205 |
| 33. | Paxville | 8.3% | 20.8%(-12.5)#33 | 16.9%(-8.57)#4,383 |
| 34. | Mauldin | 8.5% | 20.8%(-12.3)#34 | 16.9%(-8.40)#4,488 |
| 35. | Lake Wylie | 9.2% | 20.8%(-11.6)#35 | 16.9%(-7.67)#4,925 |
| 36. | Little River | 9.3% | 20.8%(-11.5)#36 | 16.9%(-7.63)#4,952 |
| 37. | Moncks Corner | 9.3% | 20.8%(-11.5)#37 | 16.9%(-7.61)#4,958 |
| 38. | Elgin | 9.5% | 20.8%(-11.3)#38 | 16.9%(-7.38)#5,070 |
| 39. | East Sumter | 9.5% | 20.8%(-11.3)#39 | 16.9%(-7.38)#5,076 |
| 40. | Pacolet | 9.6% | 20.8%(-11.3)#40 | 16.9%(-7.35)#5,093 |
| 41. | Arthurtown | 9.7% | 20.8%(-11.1)#41 | 16.9%(-7.21)#5,165 |
| 42. | Jonesville | 9.8% | 20.8%(-11.1)#42 | 16.9%(-7.15)#5,195 |
| 43. | White Knoll | 9.8% | 20.8%(-11.0)#43 | 16.9%(-7.11)#5,224 |
| 44. | Forest Acres | 9.9% | 20.8%(-10.9)#44 | 16.9%(-6.99)#5,276 |
| 45. | Dunean | 10.1% | 20.8%(-10.7)#45 | 16.9%(-6.83)#5,394 |
| 46. | Sandy Springs | 10.3% | 20.8%(-10.5)#46 | 16.9%(-6.61)#5,497 |
| 47. | East Gaffney | 10.4% | 20.8%(-10.4)#47 | 16.9%(-6.52)#5,535 |
| 48. | Oak Grove | 10.4% | 20.8%(-10.4)#48 | 16.9%(-6.47)#5,566 |
| 49. | Clearwater | 10.5% | 20.8%(-10.3)#49 | 16.9%(-6.38)#5,609 |
| 50. | Arial | 10.6% | 20.8%(-10.2)#50 | 16.9%(-6.33)#5,649 |
| 51. | Heath Springs | 11.1% | 20.8%(-9.71)#51 | 16.9%(-5.79)#5,906 |
| 52. | Capitol View | 11.1% | 20.8%(-9.68)#52 | 16.9%(-5.77)#5,952 |
| 53. | Inman | 11.3% | 20.8%(-9.56)#53 | 16.9%(-5.64)#5,994 |
| 54. | Easley | 11.3% | 20.8%(-9.48)#54 | 16.9%(-5.57)#6,023 |
| 55. | South Congaree | 11.4% | 20.8%(-9.43)#55 | 16.9%(-5.52)#6,041 |
| 56. | Lake Secession | 11.4% | 20.8%(-9.39)#56 | 16.9%(-5.48)#6,057 |
| 57. | Walterboro | 11.6% | 20.8%(-9.19)#57 | 16.9%(-5.28)#6,158 |
| 58. | Boiling Springs | 11.6% | 20.8%(-9.18)#58 | 16.9%(-5.27)#6,172 |
| 59. | Ben Avon | 11.7% | 20.8%(-9.17)#59 | 16.9%(-5.25)#6,183 |
| 60. | Eutawville | 11.8% | 20.8%(-9.05)#60 | 16.9%(-5.14)#6,251 |
| 61. | Calhoun Falls | 12.0% | 20.8%(-8.77)#61 | 16.9%(-4.86)#6,401 |
| 62. | Chesnee | 12.2% | 20.8%(-8.62)#62 | 16.9%(-4.71)#6,470 |
| 63. | Blackville | 12.9% | 20.8%(-7.87)#63 | 16.9%(-3.96)#6,843 |
| 64. | Greer | 13.3% | 20.8%(-7.57)#64 | 16.9%(-3.65)#6,985 |
| 65. | Reidville | 13.4% | 20.8%(-7.40)#65 | 16.9%(-3.48)#7,089 |
| 66. | Taylors | 13.5% | 20.8%(-7.35)#66 | 16.9%(-3.44)#7,115 |
| 67. | Irmo | 13.6% | 20.8%(-7.22)#67 | 16.9%(-3.31)#7,169 |
| 68. | Summerville | 13.7% | 20.8%(-7.14)#68 | 16.9%(-3.23)#7,222 |
| 69. | Joanna | 13.9% | 20.8%(-6.93)#69 | 16.9%(-3.01)#7,328 |
| 70. | Slater Marietta | 14.1% | 20.8%(-6.75)#70 | 16.9%(-2.83)#7,415 |
| 71. | Wedgefield | 14.2% | 20.8%(-6.61)#71 | 16.9%(-2.70)#7,459 |
| 72. | Latta | 14.3% | 20.8%(-6.53)#72 | 16.9%(-2.62)#7,488 |
| 73. | Nichols | 14.3% | 20.8%(-6.53)#73 | 16.9%(-2.62)#7,544 |
| 74. | Forestbrook | 14.4% | 20.8%(-6.45)#74 | 16.9%(-2.53)#7,573 |
| 75. | Mcclellanville | 14.6% | 20.8%(-6.19)#75 | 16.9%(-2.27)#7,695 |
| 76. | York | 14.6% | 20.8%(-6.17)#76 | 16.9%(-2.26)#7,702 |
| 77. | Seven Oaks | 15.3% | 20.8%(-5.51)#77 | 16.9%(-1.60)#7,997 |
| 78. | Welcome | 15.3% | 20.8%(-5.47)#78 | 16.9%(-1.56)#8,009 |
| 79. | Charleston | 15.5% | 20.8%(-5.34)#79 | 16.9%(-1.42)#8,083 |
| 80. | Wade Hampton | 15.5% | 20.8%(-5.33)#80 | 16.9%(-1.41)#8,085 |
| 81. | West Union | 15.6% | 20.8%(-5.19)#81 | 16.9%(-1.28)#8,139 |
| 82. | Hardeeville | 15.6% | 20.8%(-5.18)#82 | 16.9%(-1.26)#8,146 |
| 83. | Varnville | 15.6% | 20.8%(-5.17)#83 | 16.9%(-1.25)#8,148 |
| 84. | Pinewood | 15.7% | 20.8%(-5.13)#84 | 16.9%(-1.22)#8,166 |
| 85. | Due West | 15.8% | 20.8%(-5.03)#85 | 16.9%(-1.11)#8,210 |
| 86. | Pickens | 15.9% | 20.8%(-4.94)#86 | 16.9%(-1.02)#8,271 |
| 87. | Loris | 15.9% | 20.8%(-4.87)#87 | 16.9%(-0.956)#8,293 |
| 88. | Fort Lawn | 16.0% | 20.8%(-4.80)#88 | 16.9%(-0.882)#8,339 |
| 89. | Central | 16.2% | 20.8%(-4.57)#89 | 16.9%(-0.658)#8,444 |
| 90. | Chester | 16.5% | 20.8%(-4.35)#90 | 16.9%(-0.431)#8,551 |
| 91. | Wilkinson Heights | 16.5% | 20.8%(-4.34)#91 | 16.9%(-0.420)#8,554 |
| 92. | Laurel Bay | 16.6% | 20.8%(-4.21)#92 | 16.9%(-0.290)#8,599 |
| 93. | Red Bank | 16.9% | 20.8%(-3.92)#93 | 16.9%(-0.008)#8,754 |
| 94. | Hampton | 17.2% | 20.8%(-3.65)#94 | 16.9%(+0.268)#8,850 |
| 95. | Socastee | 17.2% | 20.8%(-3.61)#95 | 16.9%(+0.310)#8,860 |
| 96. | Bennettsville | 17.6% | 20.8%(-3.18)#96 | 16.9%(+0.734)#9,073 |
| 97. | Mayesville | 17.7% | 20.8%(-3.08)#97 | 16.9%(+0.838)#9,122 |
| 98. | Northlake | 17.8% | 20.8%(-3.04)#98 | 16.9%(+0.874)#9,128 |
| 99. | Clover | 18.2% | 20.8%(-2.66)#99 | 16.9%(+1.25)#9,270 |
| 100. | Rock Hill | 18.5% | 20.8%(-2.34)#100 | 16.9%(+1.58)#9,438 |
Common Questions
What are the Top 10 Cities with the Lowest Child Poverty Level Among Boys Under the Age of 16 in South Carolina?
Top 10 Cities with the Lowest Child Poverty Level Among Boys Under the Age of 16 in South Carolina are:
#1
1.1%
#2
1.3%
#3
2.4%
#4
2.6%
#5
2.8%
#6
3.1%
#7
3.1%
#8
3.8%
#9
4.1%
#10
4.2%
What city has the Lowest Child Poverty Level Among Boys Under the Age of 16 in South Carolina?
Six Mile has the Lowest Child Poverty Level Among Boys Under the Age of 16 in South Carolina with 1.1%.
What is the Poverty Level Among Boys Under the Age of 16 in the State of South Carolina?
Poverty Level Among Boys Under the Age of 16 in South Carolina is 20.8%.
What is the Poverty Level Among Boys Under the Age of 16 in the United States?
Poverty Level Among Boys Under the Age of 16 in the United States is 16.9%.