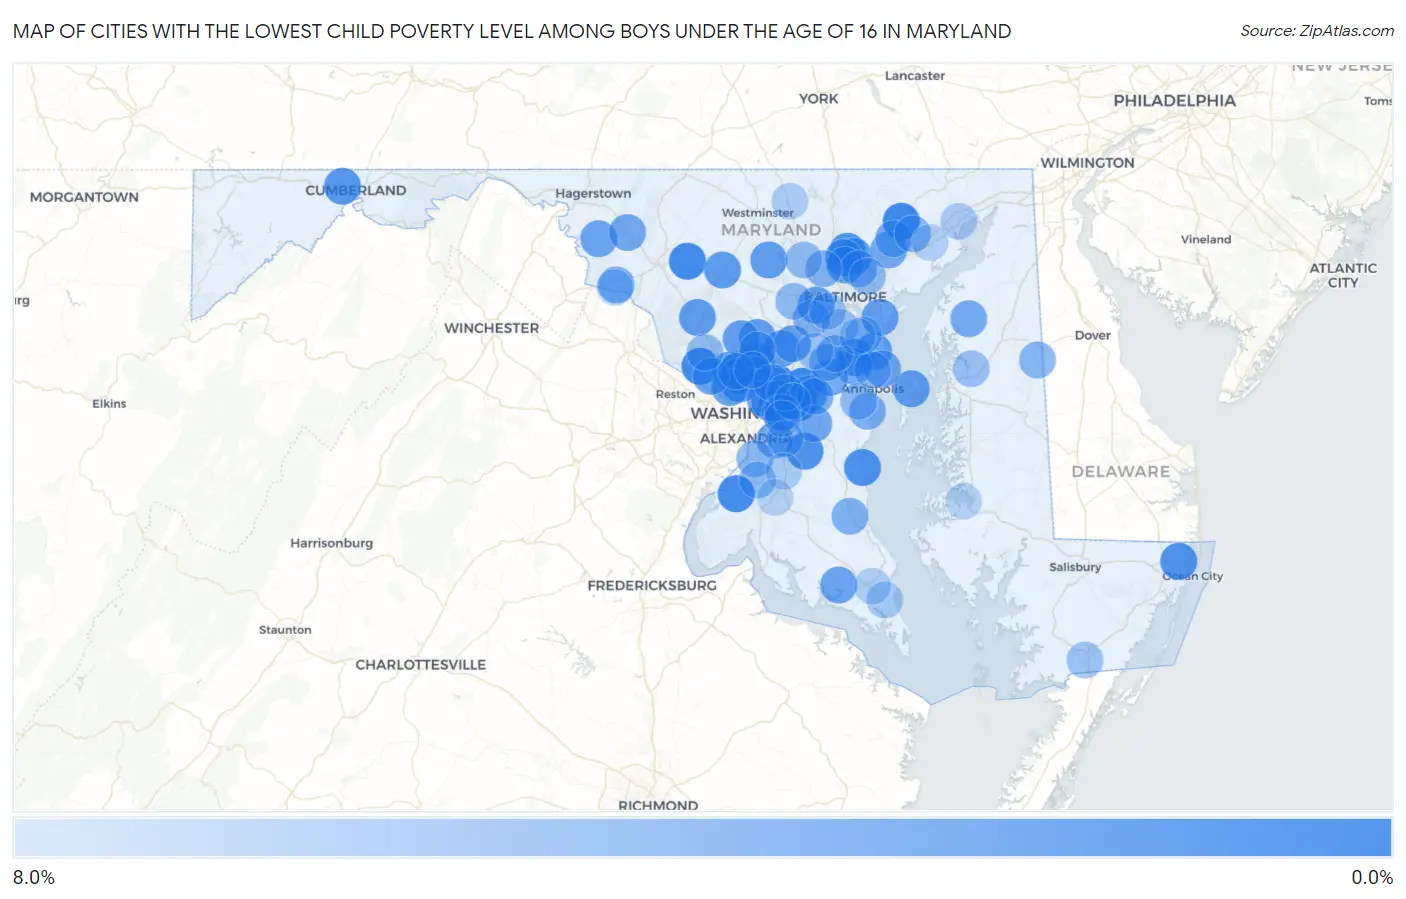
Cities with the Lowest Child Poverty Level Among Boys Under the Age of 16 in Maryland
RELATED REPORTS & OPTIONS
Lowest Poverty | Boys 0-16
Maryland
Compare Cities
Map of Cities with the Lowest Child Poverty Level Among Boys Under the Age of 16 in Maryland
8.0%
0.0%
Cities with the Lowest Child Poverty Level Among Boys Under the Age of 16 in Maryland
| City | Child Poverty (Boys) | vs State | vs National | |
| 1. | Woodlawn Cdp Prince George S County | 0.35% | 11.8%(-11.4)#1 | 16.9%(-16.6)#16 |
| 2. | Berwyn Heights | 0.42% | 11.8%(-11.3)#2 | 16.9%(-16.5)#22 |
| 3. | Glenn Dale | 0.67% | 11.8%(-11.1)#3 | 16.9%(-16.2)#73 |
| 4. | Bel Air North | 0.80% | 11.8%(-11.0)#4 | 16.9%(-16.1)#109 |
| 5. | North Kensington | 0.88% | 11.8%(-10.9)#5 | 16.9%(-16.0)#129 |
| 6. | Linganore | 1.0% | 11.8%(-10.7)#6 | 16.9%(-15.9)#170 |
| 7. | Travilah | 1.0% | 11.8%(-10.7)#7 | 16.9%(-15.9)#180 |
| 8. | Bryans Road | 1.0% | 11.8%(-10.7)#8 | 16.9%(-15.9)#188 |
| 9. | Colesville | 1.4% | 11.8%(-10.3)#9 | 16.9%(-15.5)#342 |
| 10. | North Beach | 1.6% | 11.8%(-10.1)#10 | 16.9%(-15.3)#425 |
| 11. | Mitchellville | 1.7% | 11.8%(-10.0)#11 | 16.9%(-15.2)#462 |
| 12. | Marlton | 1.7% | 11.8%(-10.0)#12 | 16.9%(-15.2)#477 |
| 13. | Ocean Pines | 1.7% | 11.8%(-10.0)#13 | 16.9%(-15.2)#479 |
| 14. | Landover Hills | 1.7% | 11.8%(-10.0)#14 | 16.9%(-15.2)#485 |
| 15. | Severna Park | 1.8% | 11.8%(-9.99)#15 | 16.9%(-15.1)#494 |
| 16. | Colmar Manor | 1.8% | 11.8%(-9.96)#16 | 16.9%(-15.1)#511 |
| 17. | Chevy Chase | 1.8% | 11.8%(-9.92)#17 | 16.9%(-15.1)#541 |
| 18. | Timonium | 1.9% | 11.8%(-9.87)#18 | 16.9%(-15.0)#565 |
| 19. | Four Corners | 2.2% | 11.8%(-9.57)#19 | 16.9%(-14.7)#749 |
| 20. | Brown Station | 2.2% | 11.8%(-9.55)#20 | 16.9%(-14.7)#757 |
| 21. | La Vale | 2.2% | 11.8%(-9.51)#21 | 16.9%(-14.7)#781 |
| 22. | North Bethesda | 2.5% | 11.8%(-9.25)#22 | 16.9%(-14.4)#921 |
| 23. | Mount Airy | 2.5% | 11.8%(-9.22)#23 | 16.9%(-14.4)#947 |
| 24. | Stevensville | 2.6% | 11.8%(-9.11)#24 | 16.9%(-14.3)#1,013 |
| 25. | Eldersburg | 2.7% | 11.8%(-9.08)#25 | 16.9%(-14.2)#1,030 |
| 26. | Cheverly | 2.7% | 11.8%(-9.06)#26 | 16.9%(-14.2)#1,037 |
| 27. | Clarksburg | 2.7% | 11.8%(-9.06)#27 | 16.9%(-14.2)#1,043 |
| 28. | Ashton Sandy Spring | 2.7% | 11.8%(-9.03)#28 | 16.9%(-14.2)#1,059 |
| 29. | South Kensington | 2.8% | 11.8%(-8.96)#29 | 16.9%(-14.1)#1,098 |
| 30. | Lake Shore | 2.8% | 11.8%(-8.95)#30 | 16.9%(-14.1)#1,104 |
| 31. | Hampton | 2.9% | 11.8%(-8.89)#31 | 16.9%(-14.0)#1,142 |
| 32. | Fairwood | 2.9% | 11.8%(-8.89)#32 | 16.9%(-14.0)#1,144 |
| 33. | Edgemere | 3.0% | 11.8%(-8.79)#33 | 16.9%(-13.9)#1,201 |
| 34. | Lutherville | 3.0% | 11.8%(-8.78)#34 | 16.9%(-13.9)#1,205 |
| 35. | Towson | 3.0% | 11.8%(-8.76)#35 | 16.9%(-13.9)#1,224 |
| 36. | Bethesda | 3.0% | 11.8%(-8.74)#36 | 16.9%(-13.9)#1,231 |
| 37. | Catonsville | 3.0% | 11.8%(-8.74)#37 | 16.9%(-13.9)#1,235 |
| 38. | Olney | 3.0% | 11.8%(-8.74)#38 | 16.9%(-13.9)#1,237 |
| 39. | West Laurel | 3.1% | 11.8%(-8.68)#39 | 16.9%(-13.8)#1,277 |
| 40. | North Laurel | 3.1% | 11.8%(-8.63)#40 | 16.9%(-13.8)#1,307 |
| 41. | Potomac | 3.2% | 11.8%(-8.55)#41 | 16.9%(-13.7)#1,357 |
| 42. | Leonardtown | 3.3% | 11.8%(-8.47)#42 | 16.9%(-13.6)#1,413 |
| 43. | Keedysville | 3.4% | 11.8%(-8.39)#43 | 16.9%(-13.5)#1,472 |
| 44. | Mount Rainier | 3.6% | 11.8%(-8.16)#44 | 16.9%(-13.3)#1,602 |
| 45. | Myersville | 3.7% | 11.8%(-8.06)#45 | 16.9%(-13.2)#1,648 |
| 46. | Brock Hall | 3.7% | 11.8%(-8.01)#46 | 16.9%(-13.2)#1,682 |
| 47. | Cape St Claire | 3.7% | 11.8%(-8.01)#47 | 16.9%(-13.2)#1,684 |
| 48. | Kingsville | 3.8% | 11.8%(-7.94)#48 | 16.9%(-13.1)#1,714 |
| 49. | Seat Pleasant | 3.8% | 11.8%(-7.93)#49 | 16.9%(-13.1)#1,716 |
| 50. | Herald Harbor | 3.8% | 11.8%(-7.92)#50 | 16.9%(-13.1)#1,726 |
| 51. | Camp Springs | 3.8% | 11.8%(-7.91)#51 | 16.9%(-13.1)#1,727 |
| 52. | Rosemont | 3.8% | 11.8%(-7.90)#52 | 16.9%(-13.1)#1,738 |
| 53. | Crofton | 3.9% | 11.8%(-7.86)#53 | 16.9%(-13.0)#1,762 |
| 54. | Chestertown | 3.9% | 11.8%(-7.81)#54 | 16.9%(-13.0)#1,788 |
| 55. | Cedar Heights | 4.2% | 11.8%(-7.55)#55 | 16.9%(-12.7)#1,928 |
| 56. | Pleasant Hills | 4.2% | 11.8%(-7.53)#56 | 16.9%(-12.7)#1,937 |
| 57. | Bowie | 4.3% | 11.8%(-7.46)#57 | 16.9%(-12.6)#1,985 |
| 58. | Cloverly | 4.5% | 11.8%(-7.30)#58 | 16.9%(-12.5)#2,085 |
| 59. | Odenton | 4.5% | 11.8%(-7.28)#59 | 16.9%(-12.4)#2,099 |
| 60. | College Park | 4.5% | 11.8%(-7.23)#60 | 16.9%(-12.4)#2,115 |
| 61. | Mayo | 4.5% | 11.8%(-7.20)#61 | 16.9%(-12.4)#2,124 |
| 62. | Gambrills | 4.5% | 11.8%(-7.20)#62 | 16.9%(-12.4)#2,126 |
| 63. | Prince Frederick | 4.5% | 11.8%(-7.20)#63 | 16.9%(-12.4)#2,129 |
| 64. | Garrett Park | 4.6% | 11.8%(-7.13)#64 | 16.9%(-12.3)#2,173 |
| 65. | Ilchester | 4.7% | 11.8%(-7.10)#65 | 16.9%(-12.3)#2,201 |
| 66. | Parkville | 4.7% | 11.8%(-7.08)#66 | 16.9%(-12.2)#2,207 |
| 67. | Peppermill Village | 4.8% | 11.8%(-6.99)#67 | 16.9%(-12.1)#2,245 |
| 68. | Honeygo | 4.9% | 11.8%(-6.88)#68 | 16.9%(-12.0)#2,307 |
| 69. | Bel Air South | 4.9% | 11.8%(-6.88)#69 | 16.9%(-12.0)#2,309 |
| 70. | Pikesville | 4.9% | 11.8%(-6.88)#70 | 16.9%(-12.0)#2,311 |
| 71. | Andrews Afb | 4.9% | 11.8%(-6.84)#71 | 16.9%(-12.0)#2,331 |
| 72. | Henderson | 5.0% | 11.8%(-6.75)#72 | 16.9%(-11.9)#2,399 |
| 73. | Fort Washington | 5.1% | 11.8%(-6.60)#73 | 16.9%(-11.8)#2,488 |
| 74. | Edgewater | 5.4% | 11.8%(-6.36)#74 | 16.9%(-11.5)#2,647 |
| 75. | Owings Mills | 5.5% | 11.8%(-6.25)#75 | 16.9%(-11.4)#2,724 |
| 76. | Ellicott City | 5.6% | 11.8%(-6.20)#76 | 16.9%(-11.4)#2,740 |
| 77. | Accokeek | 5.6% | 11.8%(-6.19)#77 | 16.9%(-11.3)#2,741 |
| 78. | Arnold | 5.6% | 11.8%(-6.16)#78 | 16.9%(-11.3)#2,777 |
| 79. | North Potomac | 5.7% | 11.8%(-6.09)#79 | 16.9%(-11.2)#2,818 |
| 80. | Ferndale | 5.8% | 11.8%(-6.00)#80 | 16.9%(-11.1)#2,873 |
| 81. | Overlea | 5.8% | 11.8%(-5.94)#81 | 16.9%(-11.1)#2,900 |
| 82. | Centreville | 6.0% | 11.8%(-5.73)#82 | 16.9%(-10.9)#3,012 |
| 83. | Riviera Beach | 6.1% | 11.8%(-5.63)#83 | 16.9%(-10.8)#3,074 |
| 84. | Fort Meade | 6.3% | 11.8%(-5.50)#84 | 16.9%(-10.6)#3,171 |
| 85. | Pocomoke City | 6.3% | 11.8%(-5.48)#85 | 16.9%(-10.6)#3,179 |
| 86. | Arbutus | 6.3% | 11.8%(-5.47)#86 | 16.9%(-10.6)#3,182 |
| 87. | Kemp Mill | 6.5% | 11.8%(-5.30)#87 | 16.9%(-10.5)#3,294 |
| 88. | Lexington Park | 6.8% | 11.8%(-4.97)#88 | 16.9%(-10.1)#3,475 |
| 89. | Havre De Grace | 7.1% | 11.8%(-4.69)#89 | 16.9%(-9.84)#3,639 |
| 90. | Hampstead | 7.1% | 11.8%(-4.64)#90 | 16.9%(-9.79)#3,671 |
| 91. | Pasadena | 7.2% | 11.8%(-4.56)#91 | 16.9%(-9.72)#3,723 |
| 92. | Brandywine | 7.2% | 11.8%(-4.54)#92 | 16.9%(-9.70)#3,735 |
| 93. | California | 7.3% | 11.8%(-4.50)#93 | 16.9%(-9.65)#3,765 |
| 94. | New Carrollton | 7.4% | 11.8%(-4.38)#94 | 16.9%(-9.53)#3,821 |
| 95. | Riverside | 7.5% | 11.8%(-4.23)#95 | 16.9%(-9.39)#3,902 |
| 96. | Springdale | 7.6% | 11.8%(-4.18)#96 | 16.9%(-9.33)#3,925 |
| 97. | Brunswick | 7.7% | 11.8%(-4.08)#97 | 16.9%(-9.23)#3,977 |
| 98. | Walker Mill | 7.7% | 11.8%(-4.01)#98 | 16.9%(-9.16)#4,046 |
| 99. | Algonquin | 7.8% | 11.8%(-3.97)#99 | 16.9%(-9.13)#4,059 |
| 100. | Waldorf | 7.8% | 11.8%(-3.96)#100 | 16.9%(-9.11)#4,063 |
Common Questions
What are the Top 10 Cities with the Lowest Child Poverty Level Among Boys Under the Age of 16 in Maryland?
Top 10 Cities with the Lowest Child Poverty Level Among Boys Under the Age of 16 in Maryland are:
#1
0.42%
#2
0.67%
#3
0.80%
#4
0.88%
#5
1.0%
#6
1.0%
#7
1.0%
#8
1.4%
#9
1.6%
#10
1.7%
What city has the Lowest Child Poverty Level Among Boys Under the Age of 16 in Maryland?
Berwyn Heights has the Lowest Child Poverty Level Among Boys Under the Age of 16 in Maryland with 0.42%.
What is the Poverty Level Among Boys Under the Age of 16 in the State of Maryland?
Poverty Level Among Boys Under the Age of 16 in Maryland is 11.8%.
What is the Poverty Level Among Boys Under the Age of 16 in the United States?
Poverty Level Among Boys Under the Age of 16 in the United States is 16.9%.