Cities with the Lowest Child Poverty Level Among Boys Under the Age of 16 in Delaware

RELATED REPORTS & OPTIONS

Lowest Poverty | Boys 0-16
Population
Families and Households
Female Fertility
Female Fertility (Unmarried)
Race (Community Size)
Race (Percentage)
Ancestry (Community Size)
AfghanAfricanAlaska NativeAlaskan AthabascanAlbanianAleutAlsatianAmericanApacheArabArapahoArgentineanArmenianAssyrian / Chaldean / SyriacAustralianAustrianBahamianBangladeshiBarbadianBasqueBelgianBelizeanBermudanBhutaneseBlackfeetBolivianBrazilianBritishBritish West IndianBulgarianBurmeseCajunCambodianCanadianCape VerdeanCarpatho RusynCelticCentral AmericanCentral American IndianCherokeeCheyenneChickasawChileanChineseChippewaChoctawColombianColvilleComancheCosta RicanCreeCreekCroatianCrowCubanCypriotCzechCzechoslovakianDanishDelawareDominicanDutchDutch West IndianEastern EuropeanEcuadorianEgyptianEnglishEstonianEthiopianEuropeanFijianFilipinoFinnishFrenchFrench American IndianFrench CanadianGermanGerman RussianGhanaianGreekGuamanian / ChamorroGuatemalanGuyaneseHaitianHmongHonduranHopiHoumaHungarianIcelanderIndian (Asian)IndonesianInupiatIranianIraqiIrishIroquoisIsraeliItalianJamaicanJapaneseJordanianKenyanKiowaKoreanLaotianLatvianLebaneseLiberianLithuanianLumbeeLuxembourgerMacedonianMalaysianMalteseMarshalleseMenomineeMexicanMexican American IndianMongolianMoroccanNative HawaiianNavajoNepaleseNew ZealanderNicaraguanNigerianNorthern EuropeanNorwegianOkinawanOsageOttawaPaiutePakistaniPalestinianPanamanianParaguayanPennsylvania GermanPeruvianPimaPolishPortuguesePotawatomiPuebloPuerto RicanPuget Sound SalishRomanianRussianSalvadoranSamoanScandinavianScotch-IrishScottishSeminoleSenegaleseSerbianShoshoneSierra LeoneanSiouxSlavicSlovakSloveneSomaliSouth AfricanSouth AmericanSouth American IndianSoviet UnionSpaniardSpanishSpanish AmericanSpanish American IndianSri LankanSubsaharan AfricanSudaneseSwedishSwissSyrianTaiwaneseThaiTlingit-HaidaTohono O'OdhamTonganTrinidadian and TobagonianTsimshianTurkishU.S. Virgin IslanderUgandanUkrainianUruguayanUteVenezuelanVietnameseWelshWest IndianYakamaYaquiYugoslavianYumanYup'ikZimbabwean
Ancestry (Percentage)
AfghanAfricanAlaska NativeAlaskan AthabascanAlbanianAleutAlsatianAmericanApacheArabArapahoArgentineanArmenianAssyrian / Chaldean / SyriacAustralianAustrianBahamianBangladeshiBarbadianBasqueBelgianBelizeanBermudanBhutaneseBlackfeetBolivianBrazilianBritishBritish West IndianBulgarianBurmeseCajunCambodianCanadianCape VerdeanCarpatho RusynCelticCentral AmericanCentral American IndianCherokeeCheyenneChickasawChileanChineseChippewaChoctawColombianColvilleComancheCosta RicanCreeCreekCroatianCrowCubanCypriotCzechCzechoslovakianDanishDelawareDominicanDutchDutch West IndianEastern EuropeanEcuadorianEgyptianEnglishEstonianEthiopianEuropeanFijianFilipinoFinnishFrenchFrench American IndianFrench CanadianGermanGerman RussianGhanaianGreekGuamanian / ChamorroGuatemalanGuyaneseHaitianHmongHonduranHopiHoumaHungarianIcelanderIndian (Asian)IndonesianInupiatIranianIraqiIrishIroquoisIsraeliItalianJamaicanJapaneseJordanianKenyanKiowaKoreanLaotianLatvianLebaneseLiberianLithuanianLumbeeLuxembourgerMacedonianMalaysianMalteseMarshalleseMenomineeMexicanMexican American IndianMongolianMoroccanNative HawaiianNavajoNepaleseNew ZealanderNicaraguanNigerianNorthern EuropeanNorwegianOkinawanOsageOttawaPaiutePakistaniPalestinianPanamanianParaguayanPennsylvania GermanPeruvianPimaPolishPortuguesePotawatomiPuebloPuerto RicanPuget Sound SalishRomanianRussianSalvadoranSamoanScandinavianScotch-IrishScottishSeminoleSenegaleseSerbianShoshoneSierra LeoneanSiouxSlavicSlovakSloveneSomaliSouth AfricanSouth AmericanSouth American IndianSoviet UnionSpaniardSpanishSpanish AmericanSpanish American IndianSri LankanSubsaharan AfricanSudaneseSwedishSwissSyrianTaiwaneseThaiTlingit-HaidaTohono O'OdhamTonganTrinidadian and TobagonianTsimshianTurkishU.S. Virgin IslanderUgandanUkrainianUruguayanUteVenezuelanVietnameseWelshWest IndianYakamaYaquiYugoslavianYumanYup'ikZimbabwean
Immigrant Origin (Total)
AfghanistanAfricaAlbaniaArgentinaArmeniaAsiaAustraliaAustriaAzoresBahamasBangladeshBarbadosBelarusBelgiumBelizeBoliviaBosnia and HerzegovinaBrazilBulgariaBurma / MyanmarCabo VerdeCambodiaCameroonCanadaCaribbeanCentral AmericaChileChinaColombiaCongoCosta RicaCroatiaCubaCzechoslovakiaDenmarkDominicaDominican RepublicEastern AfricaEastern AsiaEastern EuropeEcuadorEgyptEl SalvadorEnglandEritreaEthiopiaEuropeFijiFranceGermanyGhanaGreeceGrenadaGuatemalaGuyanaHaitiHondurasHong KongHungaryIndiaIndonesiaIranIraqIrelandIsraelItalyJamaicaJapanJordanKazakhstanKenyaKoreaKuwaitLaosLatin AmericaLatviaLebanonLiberiaLithuaniaMalaysiaMexicoMicronesiaMiddle AfricaMoldovaMoroccoNepalNetherlandsNicaraguaNigeriaNorth MacedoniaNorthern AfricaNorthern EuropeNorwayOceaniaPakistanPanamaPeruPhilippinesPolandPortugalRomaniaRussiaSaudi ArabiaScotlandSenegalSerbiaSierra LeoneSingaporeSomaliaSouth AfricaSouth AmericaSouth Central AsiaSouth Eastern AsiaSouthern EuropeSpainSri LankaSt. Vincent and the GrenadinesSudanSwedenSwitzerlandSyriaTaiwanThailandTrinidad and TobagoTurkeyUgandaUkraineUruguayUzbekistanVenezuelaVietnamWest IndiesWestern AfricaWestern AsiaWestern EuropeYemenZaireZimbabwe
Immigrant Origin (Percentage)
AfghanistanAfricaAlbaniaArgentinaArmeniaAsiaAustraliaAustriaAzoresBahamasBangladeshBarbadosBelarusBelgiumBelizeBoliviaBosnia and HerzegovinaBrazilBulgariaBurma / MyanmarCabo VerdeCambodiaCameroonCanadaCaribbeanCentral AmericaChileChinaColombiaCongoCosta RicaCroatiaCubaCzechoslovakiaDenmarkDominicaDominican RepublicEastern AfricaEastern AsiaEastern EuropeEcuadorEgyptEl SalvadorEnglandEritreaEthiopiaEuropeFijiFranceGermanyGhanaGreeceGrenadaGuatemalaGuyanaHaitiHondurasHong KongHungaryIndiaIndonesiaIranIraqIrelandIsraelItalyJamaicaJapanJordanKazakhstanKenyaKoreaKuwaitLaosLatin AmericaLatviaLebanonLiberiaLithuaniaMalaysiaMexicoMicronesiaMiddle AfricaMoldovaMoroccoNepalNetherlandsNicaraguaNigeriaNorth MacedoniaNorthern AfricaNorthern EuropeNorwayOceaniaPakistanPanamaPeruPhilippinesPolandPortugalRomaniaRussiaSaudi ArabiaScotlandSenegalSerbiaSierra LeoneSingaporeSomaliaSouth AfricaSouth AmericaSouth Central AsiaSouth Eastern AsiaSouthern EuropeSpainSri LankaSt. Vincent and the GrenadinesSudanSwedenSwitzerlandSyriaTaiwanThailandTrinidad and TobagoTurkeyUgandaUkraineUruguayUzbekistanVenezuelaVietnamWest IndiesWestern AfricaWestern AsiaWestern EuropeYemenZaireZimbabwe
Income
Income (Families)
Income (Households)
Poverty
Poverty (Families)
Unemployment
Employment Occupations
Employment Industries
Employer Class
Commute Time
Commute Means
School Enrollment
Education by Degree Field
Occupancy
Finances
Physical Characteristics
Delaware
Compare Cities
Comparison Subject

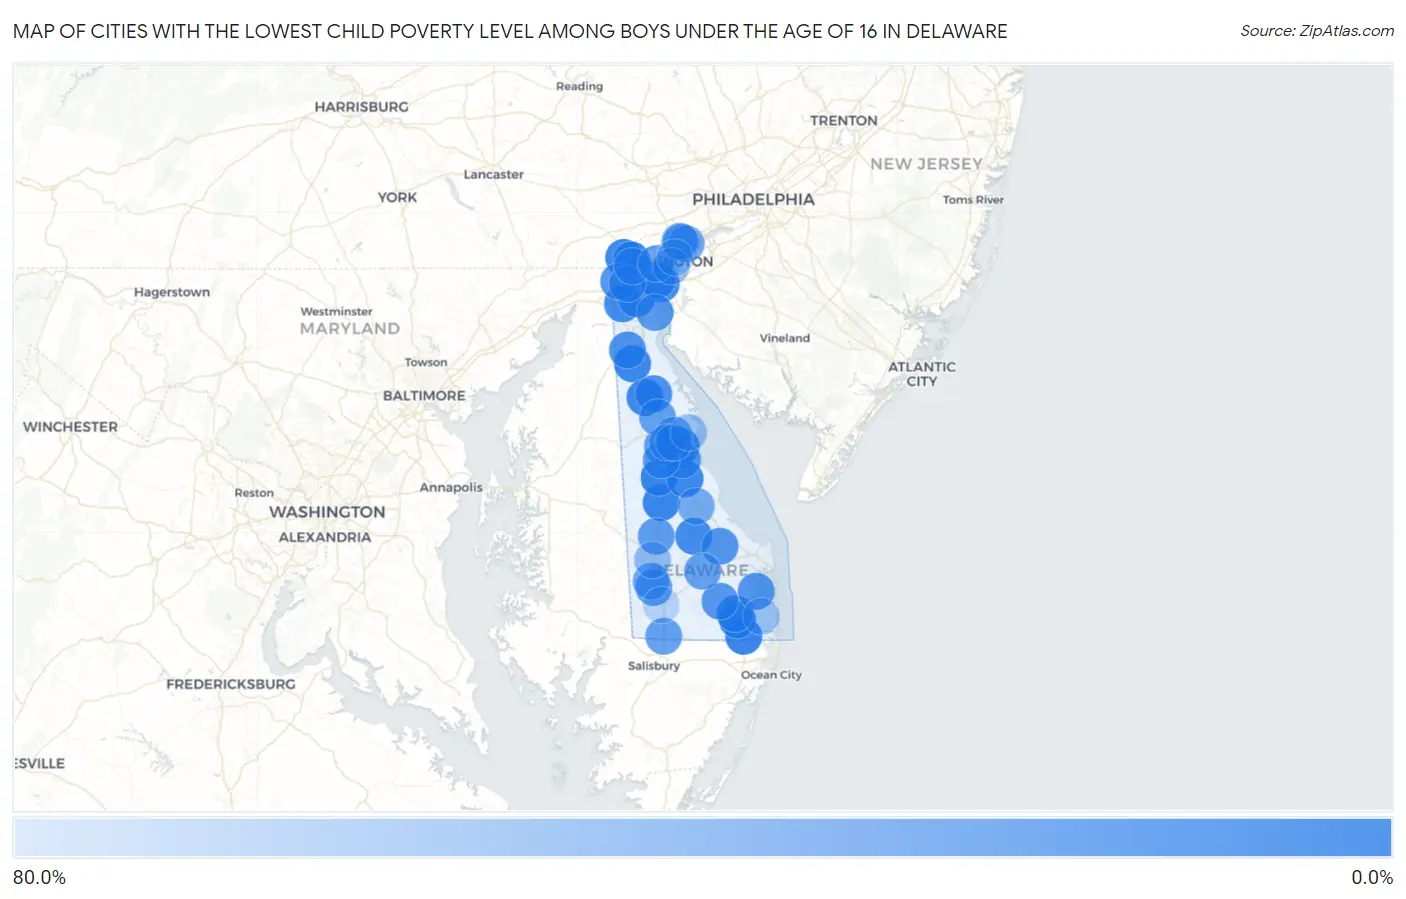
Map of Cities with the Lowest Child Poverty Level Among Boys Under the Age of 16 in Delaware

80.0%
0.0%
Cities with the Lowest Child Poverty Level Among Boys Under the Age of 16 in Delaware Map

Cities with the Lowest Child Poverty Level Among Boys Under the Age of 16 in Delaware

City Child Poverty (Boys) vs State vs National
1.Harrington1.2%17.8%(-16.5)#116.9%(-15.7)#249
2.Selbyville1.3%17.8%(-16.5)#216.9%(-15.6)#277
3.North Star1.7%17.8%(-16.0)#316.9%(-15.2)#483
4.Townsend2.0%17.8%(-15.8)#416.9%(-14.9)#629
5.Frankford2.3%17.8%(-15.4)#516.9%(-14.6)#831
6.Felton2.6%17.8%(-15.2)#616.9%(-14.3)#970
7.Clayton3.1%17.8%(-14.6)#716.9%(-13.8)#1,309
8.Pike Creek3.3%17.8%(-14.4)#816.9%(-13.6)#1,457
9.Frederica3.6%17.8%(-14.1)#916.9%(-13.3)#1,616
10.Dover Base Housing4.3%17.8%(-13.5)#1016.9%(-12.6)#1,975
11.Lincoln5.4%17.8%(-12.3)#1116.9%(-11.5)#2,673
12.New Castle5.9%17.8%(-11.9)#1216.9%(-11.0)#2,932
13.Rising Sun Lebanon6.1%17.8%(-11.7)#1316.9%(-10.8)#3,063
14.Ellendale6.1%17.8%(-11.6)#1416.9%(-10.8)#3,087
15.Glasgow6.5%17.8%(-11.3)#1516.9%(-10.5)#3,277
16.Bear6.8%17.8%(-11.0)#1616.9%(-10.1)#3,478
17.Highland Acres7.1%17.8%(-10.7)#1716.9%(-9.82)#3,655
18.Smyrna9.9%17.8%(-7.82)#1816.9%(-6.96)#5,288
19.Wilmington Manor10.2%17.8%(-7.58)#1916.9%(-6.73)#5,437
20.Dagsboro11.9%17.8%(-5.84)#2016.9%(-4.98)#6,335
21.Middletown12.1%17.8%(-5.68)#2116.9%(-4.82)#6,419
22.Newark12.4%17.8%(-5.32)#2216.9%(-4.46)#6,575
23.Long Neck13.7%17.8%(-4.07)#2316.9%(-3.22)#7,223
24.Magnolia13.8%17.8%(-3.97)#2416.9%(-3.11)#7,286
25.Milton15.1%17.8%(-2.70)#2516.9%(-1.85)#7,886
26.Millsboro16.2%17.8%(-1.60)#2616.9%(-0.748)#8,393
27.Wyoming16.6%17.8%(-1.19)#2716.9%(-0.339)#8,583
28.Delaware City18.0%17.8%(+0.202)#2816.9%(+1.06)#9,205
29.Blades18.2%17.8%(+0.423)#2916.9%(+1.28)#9,278
30.Woodside18.2%17.8%(+0.423)#3016.9%(+1.28)#9,311
31.Greenwood19.6%17.8%(+1.87)#3116.9%(+2.72)#9,909
32.Brookside21.3%17.8%(+3.59)#3216.9%(+4.44)#10,585
33.Delmar21.7%17.8%(+3.92)#3316.9%(+4.77)#10,692
34.Cheswold21.9%17.8%(+4.13)#3416.9%(+4.99)#10,773
35.Ardentown23.5%17.8%(+5.77)#3516.9%(+6.63)#11,337
36.Georgetown23.7%17.8%(+5.99)#3616.9%(+6.85)#11,413
37.Pike Creek Valley24.7%17.8%(+6.97)#3716.9%(+7.82)#11,729
38.Elsmere25.1%17.8%(+7.37)#3816.9%(+8.23)#11,931
39.Dover26.7%17.8%(+8.95)#3916.9%(+9.81)#12,415
40.Seaford28.2%17.8%(+10.4)#4016.9%(+11.3)#12,879
41.Claymont28.4%17.8%(+10.6)#4116.9%(+11.5)#12,944
42.Rodney Village28.5%17.8%(+10.7)#4216.9%(+11.6)#12,956
43.Milford31.3%17.8%(+13.5)#4316.9%(+14.4)#13,706
44.Kent Acres32.2%17.8%(+14.4)#4416.9%(+15.3)#13,933
45.Arden35.3%17.8%(+17.5)#4516.9%(+18.4)#14,696
46.Bridgeville43.5%17.8%(+25.8)#4616.9%(+26.6)#16,170
47.Wilmington47.0%17.8%(+29.2)#4716.9%(+30.1)#16,616
48.Millville48.8%17.8%(+31.0)#4816.9%(+31.9)#16,845
49.Little Creek50.0%17.8%(+32.2)#4916.9%(+33.1)#17,009
50.Edgemoor56.1%17.8%(+38.3)#5016.9%(+39.2)#17,608
51.Laurel63.7%17.8%(+45.9)#5116.9%(+46.8)#18,170

Common Questions

What are the Top 10 Cities with the Lowest Child Poverty Level Among Boys Under the Age of 16 in Delaware?
Top 10 Cities with the Lowest Child Poverty Level Among Boys Under the Age of 16 in Delaware are:
What city has the Lowest Child Poverty Level Among Boys Under the Age of 16 in Delaware?
Harrington has the Lowest Child Poverty Level Among Boys Under the Age of 16 in Delaware with 1.2%.
What is the Poverty Level Among Boys Under the Age of 16 in the State of Delaware?
Poverty Level Among Boys Under the Age of 16 in Delaware is 17.8%.
What is the Poverty Level Among Boys Under the Age of 16 in the United States?
Poverty Level Among Boys Under the Age of 16 in the United States is 16.9%.