South San Gabriel, CA Map & Demographics
South San Gabriel Map
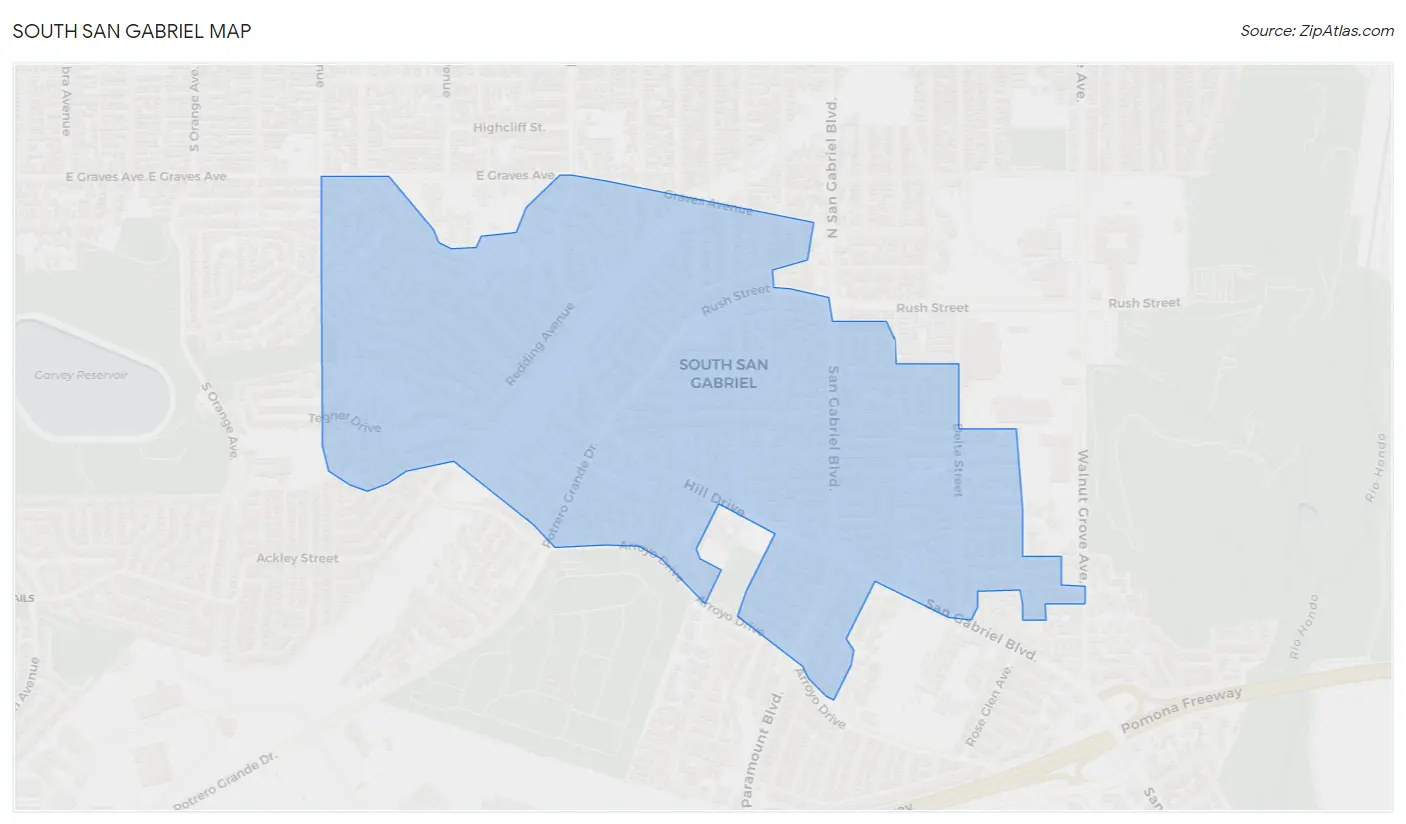
South San Gabriel Overview
$25,448
PER CAPITA INCOME
$75,357
AVG FAMILY INCOME
$71,944
AVG HOUSEHOLD INCOME
25.2%
WAGE / INCOME GAP [ % ]
74.8¢/ $1
WAGE / INCOME GAP [ $ ]
0.39
INEQUALITY / GINI INDEX
7,786
TOTAL POPULATION
3,937
MALE POPULATION
3,849
FEMALE POPULATION
102.29
MALES / 100 FEMALES
97.76
FEMALES / 100 MALES
43.5
MEDIAN AGE
3.7
AVG FAMILY SIZE
3.4
AVG HOUSEHOLD SIZE
3,849
LABOR FORCE [ PEOPLE ]
58.2%
PERCENT IN LABOR FORCE
5.4%
UNEMPLOYMENT RATE
Income in South San Gabriel
Income Overview in South San Gabriel
Per Capita Income in South San Gabriel is $25,448, while median incomes of families and households are $75,357 and $71,944 respectively.
| Characteristic | Number | Measure |
| Per Capita Income | 7,786 | $25,448 |
| Median Family Income | 1,868 | $75,357 |
| Mean Family Income | 1,868 | $85,157 |
| Median Household Income | 2,256 | $71,944 |
| Mean Household Income | 2,256 | $85,334 |
| Income Deficit | 1,868 | $0 |
| Wage / Income Gap (%) | 7,786 | 25.24% |
| Wage / Income Gap ($) | 7,786 | 74.76¢ per $1 |
| Gini / Inequality Index | 7,786 | 0.39 |
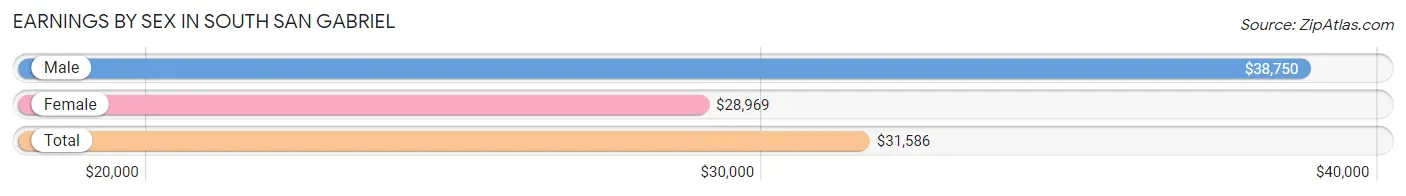
Earnings by Sex in South San Gabriel
Average Earnings in South San Gabriel are $31,586, $38,750 for men and $28,969 for women, a difference of 25.2%.
| Sex | Number | Average Earnings |
| Male | 1,994 (52.5%) | $38,750 |
| Female | 1,804 (47.5%) | $28,969 |
| Total | 3,798 (100.0%) | $31,586 |
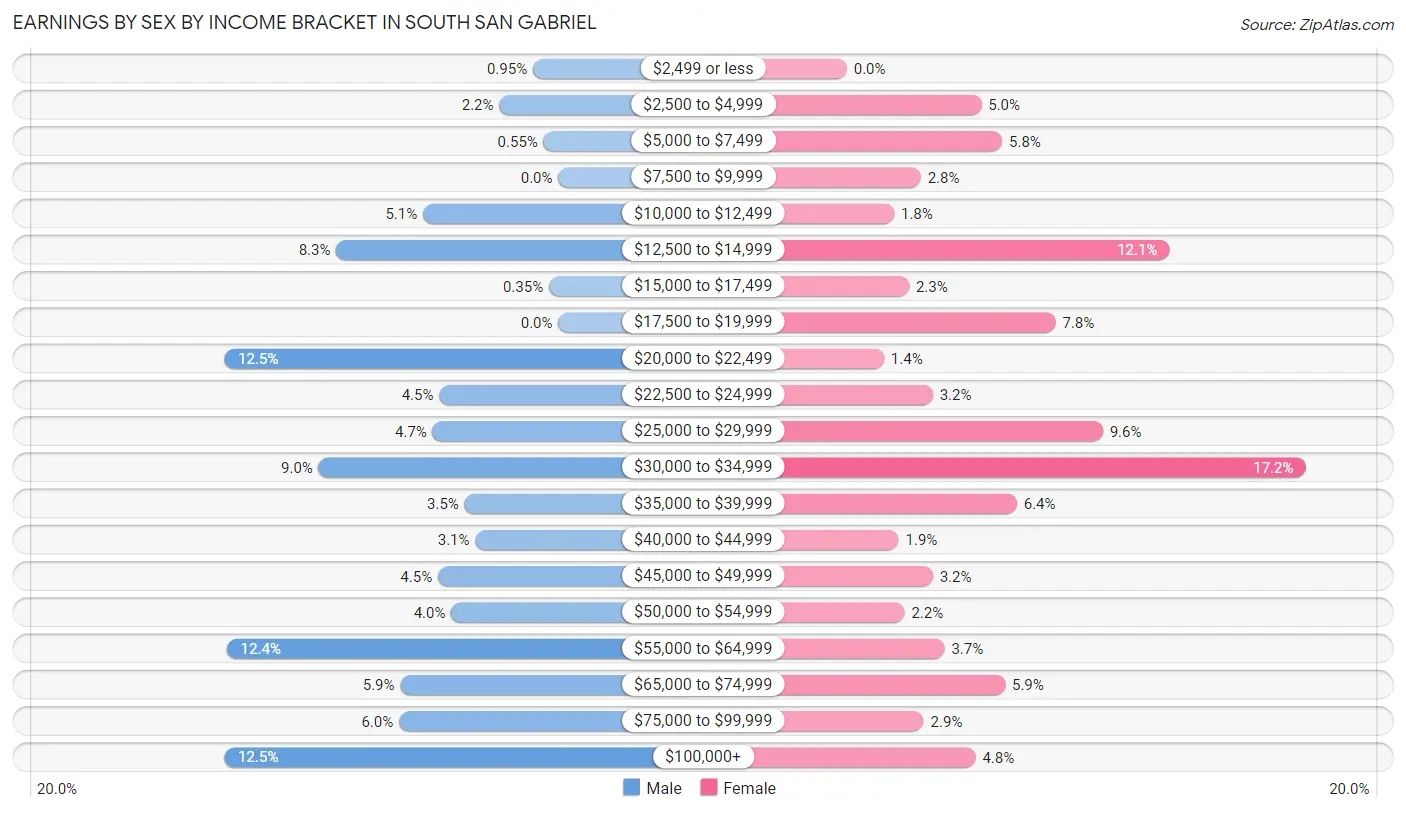
Earnings by Sex by Income Bracket in South San Gabriel
The most common earnings brackets in South San Gabriel are $20,000 to $22,499 for men (249 | 12.5%) and $30,000 to $34,999 for women (310 | 17.2%).
| Income | Male | Female |
| $2,499 or less | 19 (0.9%) | 0 (0.0%) |
| $2,500 to $4,999 | 44 (2.2%) | 91 (5.0%) |
| $5,000 to $7,499 | 11 (0.5%) | 105 (5.8%) |
| $7,500 to $9,999 | 0 (0.0%) | 50 (2.8%) |
| $10,000 to $12,499 | 101 (5.1%) | 32 (1.8%) |
| $12,500 to $14,999 | 166 (8.3%) | 218 (12.1%) |
| $15,000 to $17,499 | 7 (0.4%) | 42 (2.3%) |
| $17,500 to $19,999 | 0 (0.0%) | 141 (7.8%) |
| $20,000 to $22,499 | 249 (12.5%) | 25 (1.4%) |
| $22,500 to $24,999 | 89 (4.5%) | 58 (3.2%) |
| $25,000 to $29,999 | 94 (4.7%) | 173 (9.6%) |
| $30,000 to $34,999 | 179 (9.0%) | 310 (17.2%) |
| $35,000 to $39,999 | 70 (3.5%) | 115 (6.4%) |
| $40,000 to $44,999 | 62 (3.1%) | 35 (1.9%) |
| $45,000 to $49,999 | 90 (4.5%) | 58 (3.2%) |
| $50,000 to $54,999 | 80 (4.0%) | 39 (2.2%) |
| $55,000 to $64,999 | 247 (12.4%) | 66 (3.7%) |
| $65,000 to $74,999 | 118 (5.9%) | 107 (5.9%) |
| $75,000 to $99,999 | 119 (6.0%) | 52 (2.9%) |
| $100,000+ | 249 (12.5%) | 87 (4.8%) |
| Total | 1,994 (100.0%) | 1,804 (100.0%) |
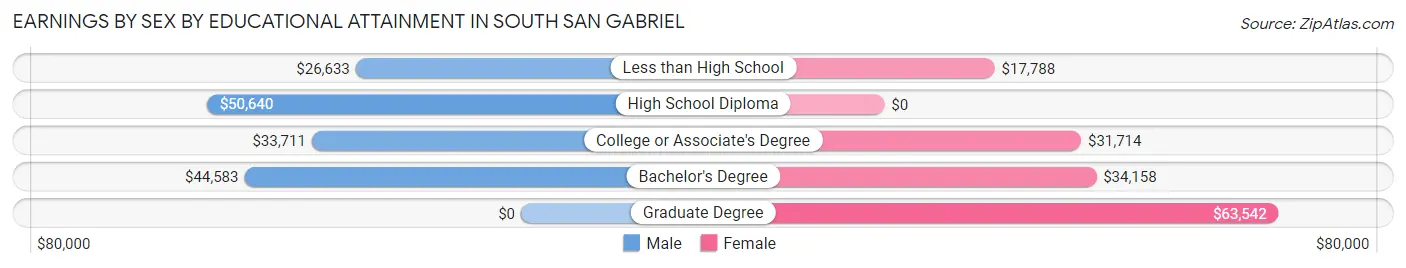
Earnings by Sex by Educational Attainment in South San Gabriel
Average earnings in South San Gabriel are $40,938 for men and $30,324 for women, a difference of 25.9%. Men with an educational attainment of high school diploma enjoy the highest average annual earnings of $50,640, while those with less than high school education earn the least with $26,633. Women with an educational attainment of graduate degree earn the most with the average annual earnings of $63,542, while those with less than high school education have the smallest earnings of $17,788.
| Educational Attainment | Male Income | Female Income |
| Less than High School | $26,633 | $17,788 |
| High School Diploma | $50,640 | $0 |
| College or Associate's Degree | $33,711 | $31,714 |
| Bachelor's Degree | $44,583 | $34,158 |
| Graduate Degree | - | - |
| Total | $40,938 | $30,324 |
Family Income in South San Gabriel
Family Income Brackets in South San Gabriel
According to the South San Gabriel family income data, there are 387 families falling into the $75,000 to $99,999 income range, which is the most common income bracket and makes up 20.7% of all families. Conversely, the $10,000 to $14,999 income bracket is the least frequent group with only 7 families (0.4%) belonging to this category.
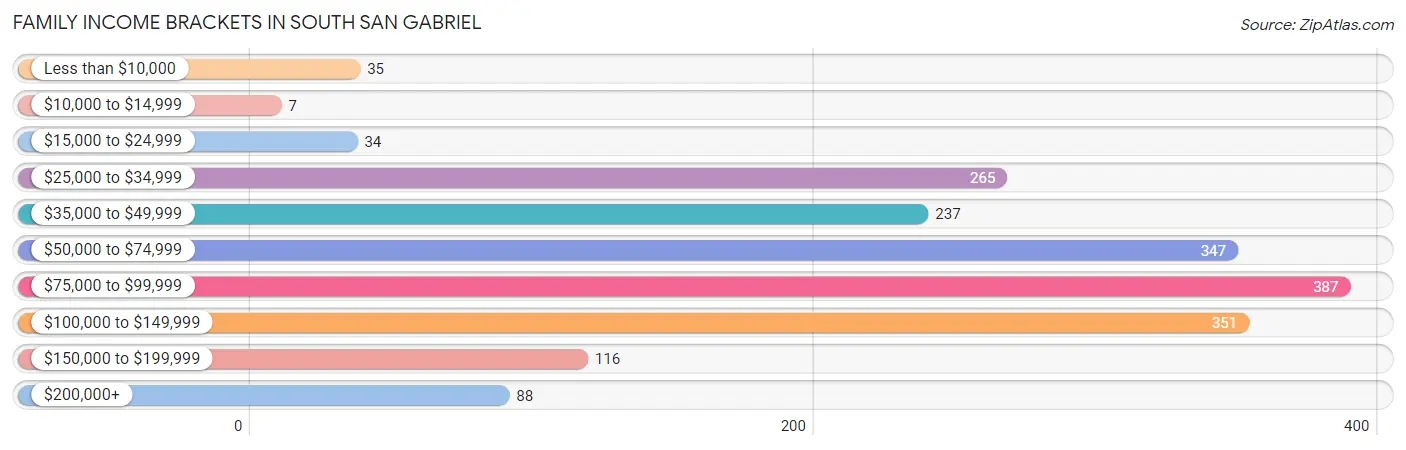
| Income Bracket | # Families | % Families |
| Less than $10,000 | 35 | 1.9% |
| $10,000 to $14,999 | 7 | 0.4% |
| $15,000 to $24,999 | 34 | 1.8% |
| $25,000 to $34,999 | 265 | 14.2% |
| $35,000 to $49,999 | 237 | 12.7% |
| $50,000 to $74,999 | 347 | 18.6% |
| $75,000 to $99,999 | 387 | 20.7% |
| $100,000 to $149,999 | 351 | 18.8% |
| $150,000 to $199,999 | 116 | 6.2% |
| $200,000+ | 88 | 4.7% |
Family Income by Famaliy Size in South San Gabriel
5-person families (145 | 7.8%) account for the highest median family income in South San Gabriel with $89,261 per family, while 3-person families (300 | 16.1%) have the highest median income of $25,337 per family member.
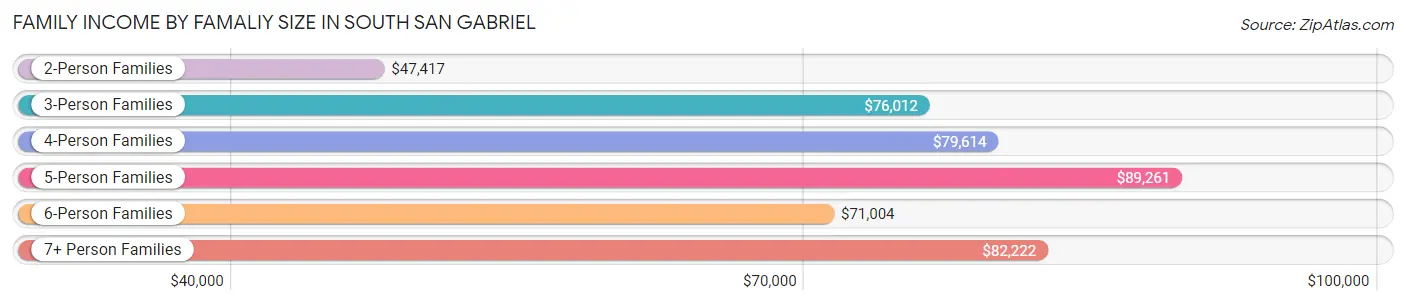
| Income Bracket | # Families | Median Income |
| 2-Person Families | 565 (30.2%) | $47,417 |
| 3-Person Families | 300 (16.1%) | $76,012 |
| 4-Person Families | 625 (33.5%) | $79,614 |
| 5-Person Families | 145 (7.8%) | $89,261 |
| 6-Person Families | 201 (10.8%) | $71,004 |
| 7+ Person Families | 32 (1.7%) | $82,222 |
| Total | 1,868 (100.0%) | $75,357 |
Family Income by Number of Earners in South San Gabriel
The median family income in South San Gabriel is $75,357, with families comprising 3+ earners (334) having the highest median family income of $99,265, while families with no earners (183) have the lowest median family income of $46,328, accounting for 17.9% and 9.8% of families, respectively.
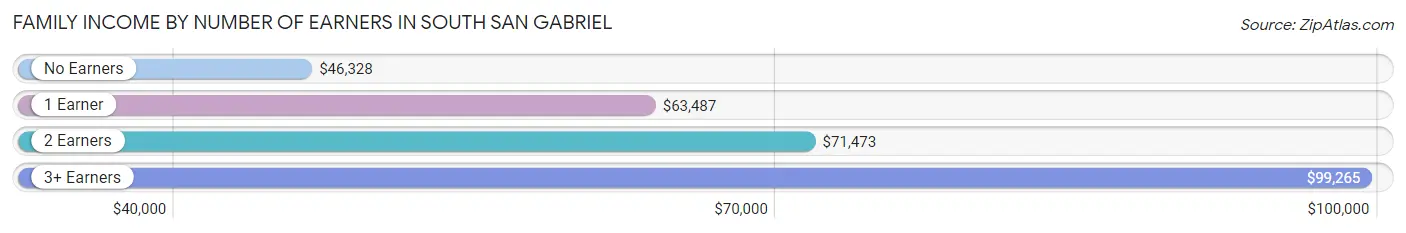
| Number of Earners | # Families | Median Income |
| No Earners | 183 (9.8%) | $46,328 |
| 1 Earner | 471 (25.2%) | $63,487 |
| 2 Earners | 880 (47.1%) | $71,473 |
| 3+ Earners | 334 (17.9%) | $99,265 |
| Total | 1,868 (100.0%) | $75,357 |
Household Income in South San Gabriel
Household Income Brackets in South San Gabriel
With 431 households falling in the category, the $75,000 to $99,999 income range is the most frequent in South San Gabriel, accounting for 19.1% of all households. In contrast, only 45 households (2.0%) fall into the less than $10,000 income bracket, making it the least populous group.
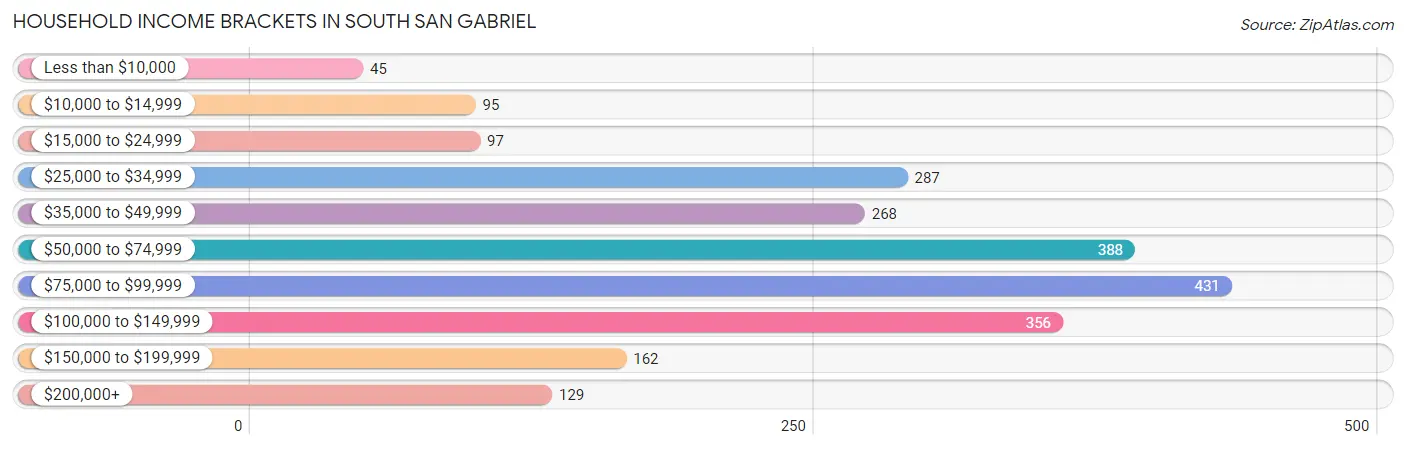
| Income Bracket | # Households | % Households |
| Less than $10,000 | 45 | 2.0% |
| $10,000 to $14,999 | 95 | 4.2% |
| $15,000 to $24,999 | 97 | 4.3% |
| $25,000 to $34,999 | 287 | 12.7% |
| $35,000 to $49,999 | 268 | 11.9% |
| $50,000 to $74,999 | 388 | 17.2% |
| $75,000 to $99,999 | 431 | 19.1% |
| $100,000 to $149,999 | 356 | 15.8% |
| $150,000 to $199,999 | 162 | 7.2% |
| $200,000+ | 129 | 5.7% |
Household Income by Householder Age in South San Gabriel
The median household income in South San Gabriel is $71,944, with the highest median household income of $83,833 found in the 25 to 44 years age bracket for the primary householder. A total of 488 households (21.6%) fall into this category. Meanwhile, the 15 to 24 years age bracket for the primary householder has the lowest median household income of $0, with 22 households (1.0%) in this group.
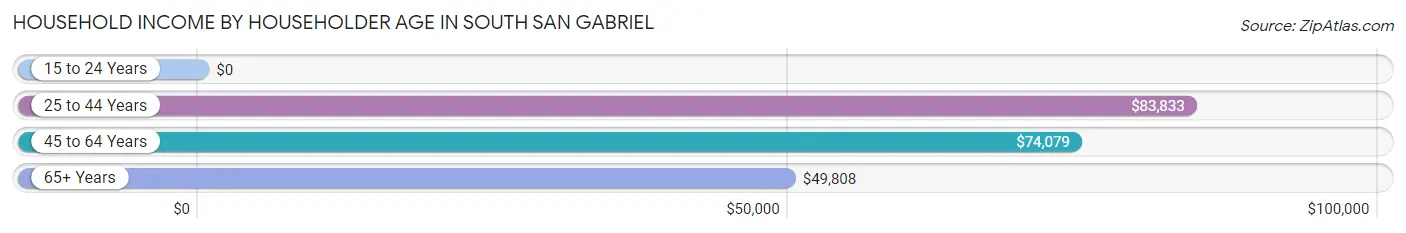
| Income Bracket | # Households | Median Income |
| 15 to 24 Years | 22 (1.0%) | $0 |
| 25 to 44 Years | 488 (21.6%) | $83,833 |
| 45 to 64 Years | 1,042 (46.2%) | $74,079 |
| 65+ Years | 704 (31.2%) | $49,808 |
| Total | 2,256 (100.0%) | $71,944 |
Poverty in South San Gabriel
Income Below Poverty by Sex and Age in South San Gabriel
With 4.0% poverty level for males and 5.9% for females among the residents of South San Gabriel, 18 to 24 year old males and 16 and 17 year old females are the most vulnerable to poverty, with 38 males (22.5%) and 11 females (22.9%) in their respective age groups living below the poverty level.
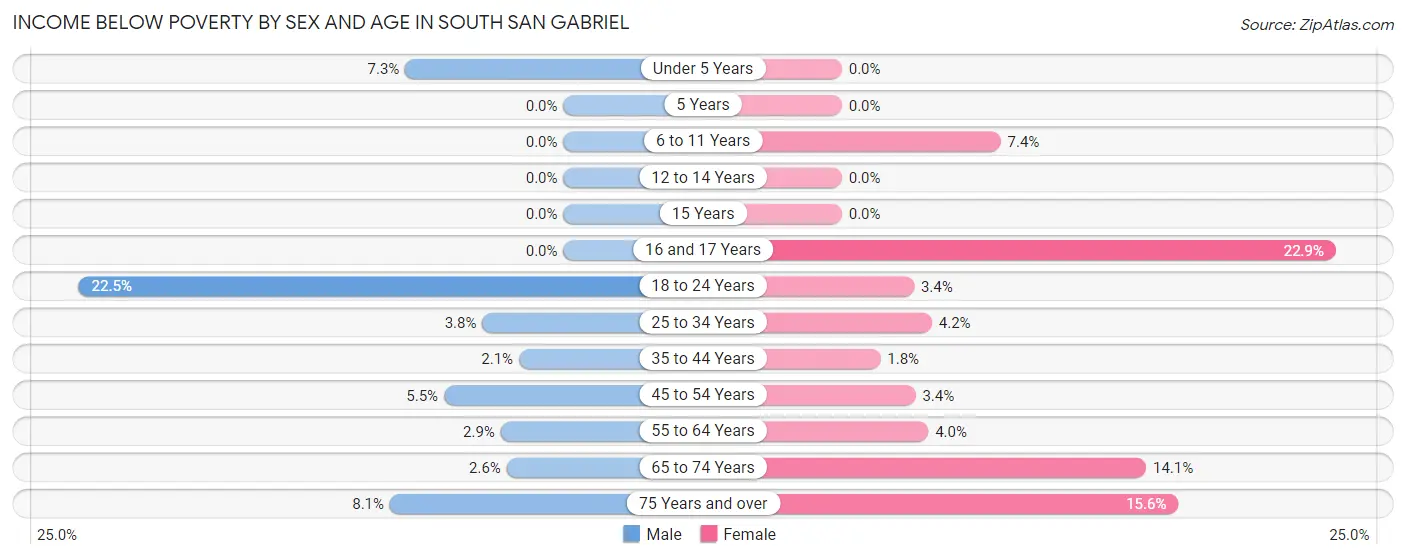
| Age Bracket | Male | Female |
| Under 5 Years | 13 (7.3%) | 0 (0.0%) |
| 5 Years | 0 (0.0%) | 0 (0.0%) |
| 6 to 11 Years | 0 (0.0%) | 7 (7.4%) |
| 12 to 14 Years | 0 (0.0%) | 0 (0.0%) |
| 15 Years | 0 (0.0%) | 0 (0.0%) |
| 16 and 17 Years | 0 (0.0%) | 11 (22.9%) |
| 18 to 24 Years | 38 (22.5%) | 8 (3.4%) |
| 25 to 34 Years | 23 (3.8%) | 20 (4.2%) |
| 35 to 44 Years | 11 (2.1%) | 8 (1.8%) |
| 45 to 54 Years | 21 (5.5%) | 12 (3.4%) |
| 55 to 64 Years | 18 (2.9%) | 33 (4.0%) |
| 65 to 74 Years | 9 (2.6%) | 62 (14.1%) |
| 75 Years and over | 19 (8.1%) | 59 (15.6%) |
| Total | 152 (4.0%) | 220 (5.9%) |
Income Above Poverty by Sex and Age in South San Gabriel
According to the poverty statistics in South San Gabriel, males aged 5 years and females aged under 5 years are the age groups that are most secure financially, with 100.0% of males and 100.0% of females in these age groups living above the poverty line.
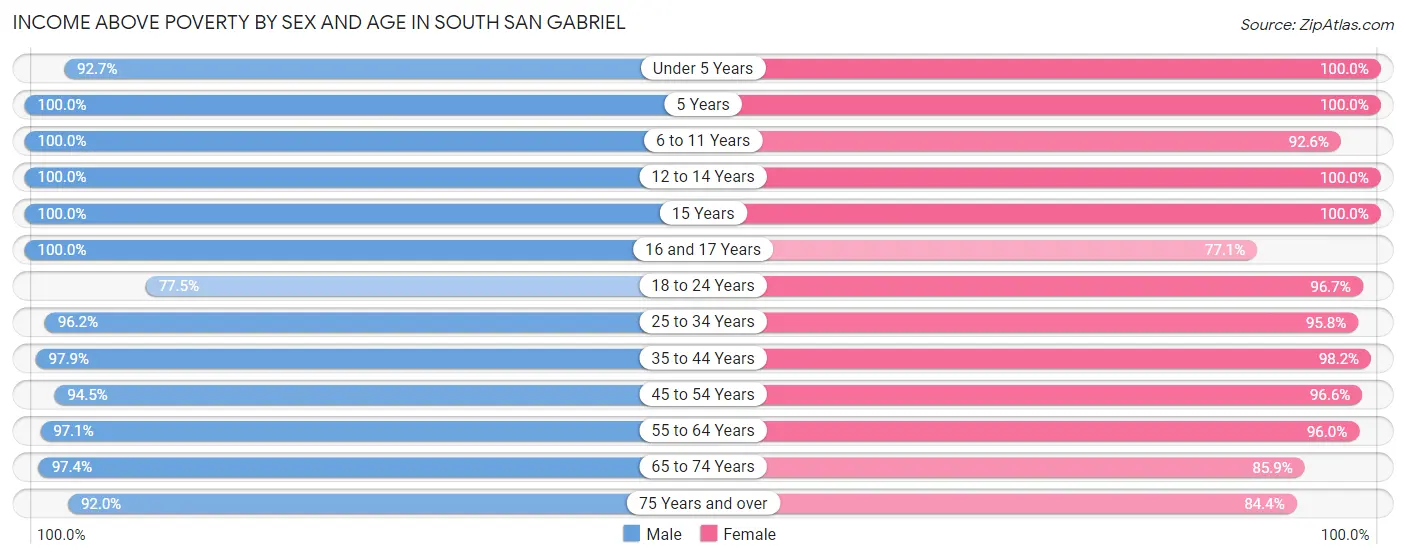
| Age Bracket | Male | Female |
| Under 5 Years | 164 (92.7%) | 241 (100.0%) |
| 5 Years | 89 (100.0%) | 38 (100.0%) |
| 6 to 11 Years | 269 (100.0%) | 88 (92.6%) |
| 12 to 14 Years | 63 (100.0%) | 98 (100.0%) |
| 15 Years | 44 (100.0%) | 58 (100.0%) |
| 16 and 17 Years | 309 (100.0%) | 37 (77.1%) |
| 18 to 24 Years | 131 (77.5%) | 231 (96.7%) |
| 25 to 34 Years | 588 (96.2%) | 458 (95.8%) |
| 35 to 44 Years | 522 (97.9%) | 440 (98.2%) |
| 45 to 54 Years | 358 (94.5%) | 339 (96.6%) |
| 55 to 64 Years | 601 (97.1%) | 789 (96.0%) |
| 65 to 74 Years | 333 (97.4%) | 377 (85.9%) |
| 75 Years and over | 217 (91.9%) | 319 (84.4%) |
| Total | 3,688 (96.0%) | 3,513 (94.1%) |
Income Below Poverty Among Married-Couple Families in South San Gabriel
The poverty statistics for married-couple families in South San Gabriel show that 3.3% or 45 of the total 1,356 families live below the poverty line. Families with no children have the highest poverty rate of 4.9%, comprising of 34 families. On the other hand, families with 3 or 4 children have the lowest poverty rate of 0.0%, which includes 0 families.
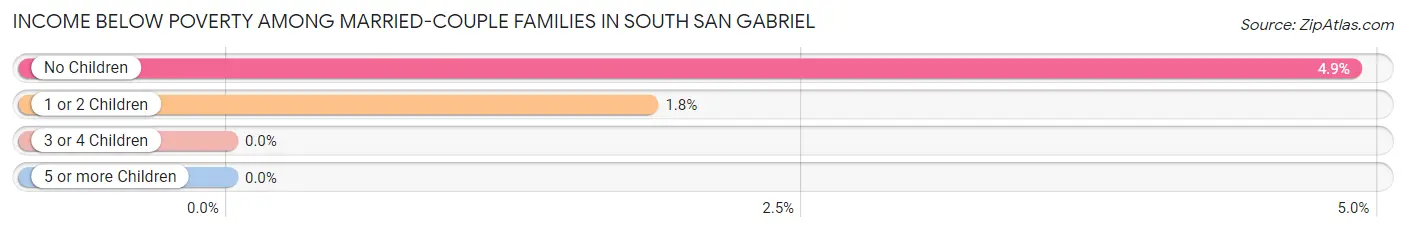
| Children | Above Poverty | Below Poverty |
| No Children | 661 (95.1%) | 34 (4.9%) |
| 1 or 2 Children | 590 (98.2%) | 11 (1.8%) |
| 3 or 4 Children | 60 (100.0%) | 0 (0.0%) |
| 5 or more Children | 0 (0.0%) | 0 (0.0%) |
| Total | 1,311 (96.7%) | 45 (3.3%) |
Income Below Poverty Among Single-Parent Households in South San Gabriel
According to the poverty data in South San Gabriel, 4.9% or 8 single-father households and 4.9% or 17 single-mother households are living below the poverty line. Among single-father households, those with no children have the highest poverty rate, with 8 households (8.1%) experiencing poverty. Likewise, among single-mother households, those with 1 or 2 children have the highest poverty rate, with 17 households (32.1%) falling below the poverty line.
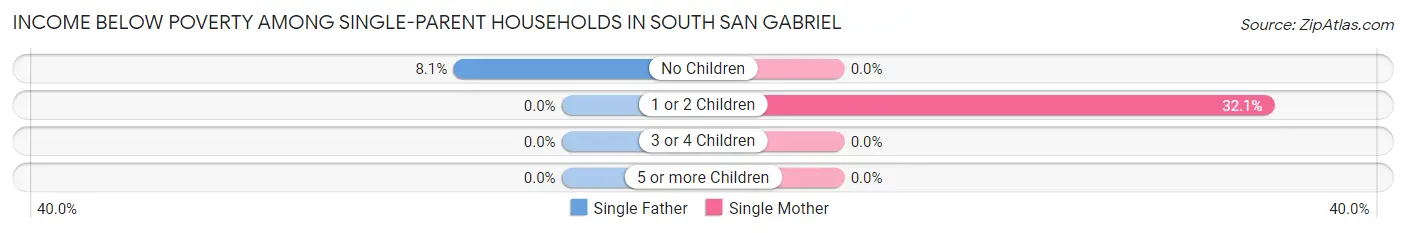
| Children | Single Father | Single Mother |
| No Children | 8 (8.1%) | 0 (0.0%) |
| 1 or 2 Children | 0 (0.0%) | 17 (32.1%) |
| 3 or 4 Children | 0 (0.0%) | 0 (0.0%) |
| 5 or more Children | 0 (0.0%) | 0 (0.0%) |
| Total | 8 (4.9%) | 17 (4.9%) |
Income Below Poverty Among Married-Couple vs Single-Parent Households in South San Gabriel
The poverty data for South San Gabriel shows that 45 of the married-couple family households (3.3%) and 25 of the single-parent households (4.9%) are living below the poverty level. Within the married-couple family households, those with no children have the highest poverty rate, with 34 households (4.9%) falling below the poverty line. Among the single-parent households, those with 1 or 2 children have the highest poverty rate, with 17 household (14.4%) living below poverty.
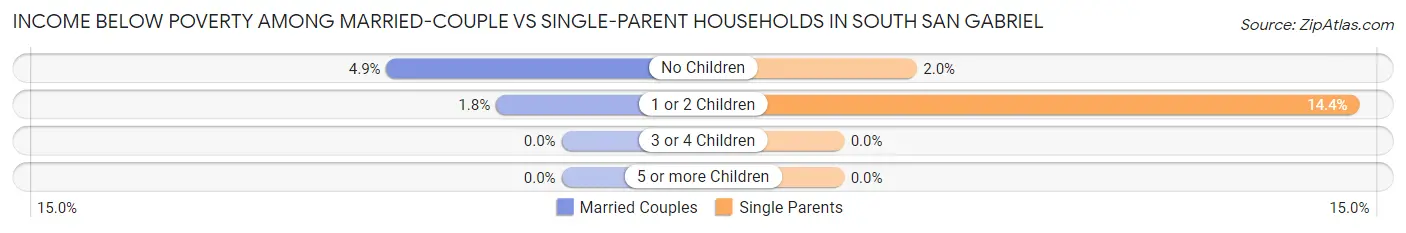
| Children | Married-Couple Families | Single-Parent Households |
| No Children | 34 (4.9%) | 8 (2.0%) |
| 1 or 2 Children | 11 (1.8%) | 17 (14.4%) |
| 3 or 4 Children | 0 (0.0%) | 0 (0.0%) |
| 5 or more Children | 0 (0.0%) | 0 (0.0%) |
| Total | 45 (3.3%) | 25 (4.9%) |
Race in South San Gabriel
The most populous races in South San Gabriel are Asian (5,408 | 69.5%), Hispanic or Latino (1,797 | 23.1%), and Some other Race (1,246 | 16.0%).
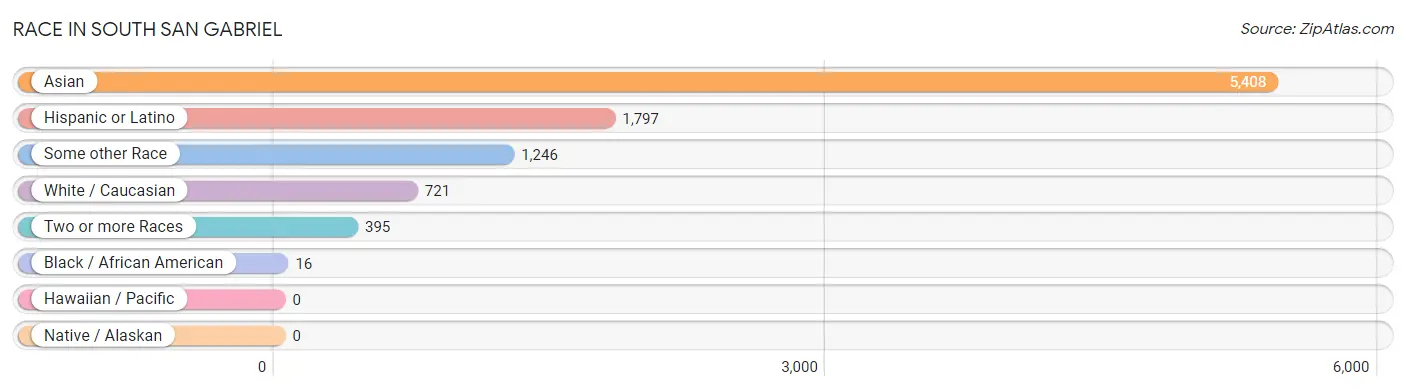
| Race | # Population | % Population |
| Asian | 5,408 | 69.5% |
| Black / African American | 16 | 0.2% |
| Hawaiian / Pacific | 0 | 0.0% |
| Hispanic or Latino | 1,797 | 23.1% |
| Native / Alaskan | 0 | 0.0% |
| White / Caucasian | 721 | 9.3% |
| Two or more Races | 395 | 5.1% |
| Some other Race | 1,246 | 16.0% |
| Total | 7,786 | 100.0% |
Ancestry in South San Gabriel
The most populous ancestries reported in South San Gabriel are Indian (Asian) (3,052 | 39.2%), Sri Lankan (1,611 | 20.7%), Mexican (1,480 | 19.0%), Bhutanese (564 | 7.2%), and American (512 | 6.6%), together accounting for 92.7% of all South San Gabriel residents.
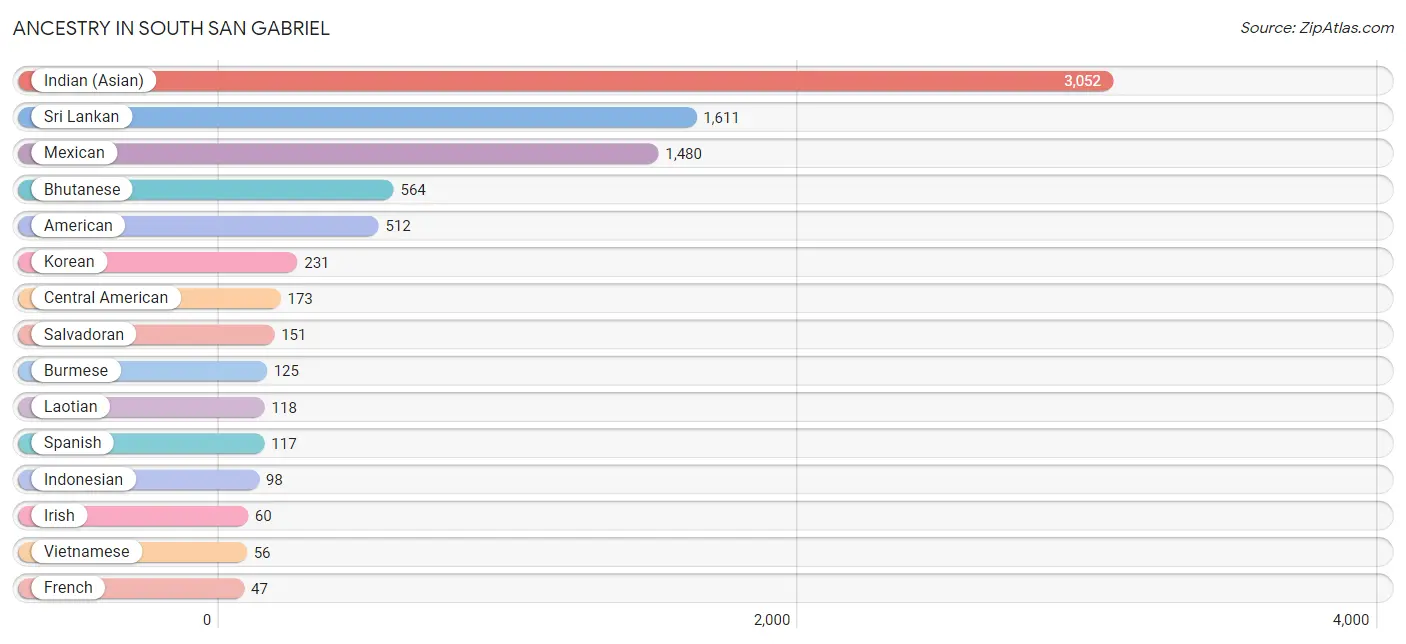
| Ancestry | # Population | % Population |
| African | 34 | 0.4% |
| American | 512 | 6.6% |
| Armenian | 32 | 0.4% |
| Bhutanese | 564 | 7.2% |
| Burmese | 125 | 1.6% |
| Central American | 173 | 2.2% |
| Croatian | 8 | 0.1% |
| English | 27 | 0.4% |
| European | 8 | 0.1% |
| Filipino | 26 | 0.3% |
| French | 47 | 0.6% |
| German | 33 | 0.4% |
| Guatemalan | 22 | 0.3% |
| Indian (Asian) | 3,052 | 39.2% |
| Indonesian | 98 | 1.3% |
| Irish | 60 | 0.8% |
| Italian | 18 | 0.2% |
| Korean | 231 | 3.0% |
| Laotian | 118 | 1.5% |
| Malaysian | 21 | 0.3% |
| Mexican | 1,480 | 19.0% |
| Pakistani | 39 | 0.5% |
| Peruvian | 3 | 0.0% |
| Polish | 46 | 0.6% |
| Puerto Rican | 8 | 0.1% |
| Russian | 16 | 0.2% |
| Salvadoran | 151 | 1.9% |
| Scottish | 5 | 0.1% |
| South American | 3 | 0.0% |
| Spaniard | 16 | 0.2% |
| Spanish | 117 | 1.5% |
| Sri Lankan | 1,611 | 20.7% |
| Subsaharan African | 34 | 0.4% |
| Swedish | 4 | 0.1% |
| Ukrainian | 4 | 0.1% |
| Vietnamese | 56 | 0.7% | View All 36 Rows |
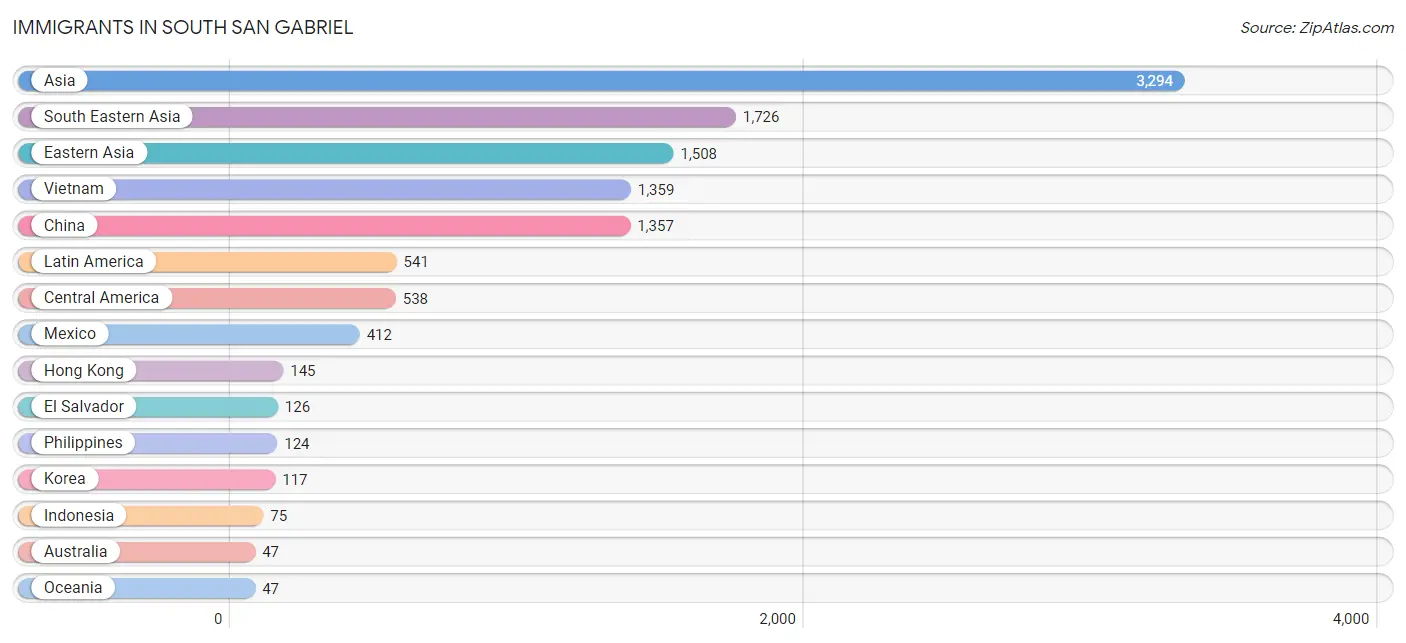
Immigrants in South San Gabriel
The most numerous immigrant groups reported in South San Gabriel came from Asia (3,294 | 42.3%), South Eastern Asia (1,726 | 22.2%), Eastern Asia (1,508 | 19.4%), Vietnam (1,359 | 17.4%), and China (1,357 | 17.4%), together accounting for 118.7% of all South San Gabriel residents.
| Immigration Origin | # Population | % Population |
| Africa | 23 | 0.3% |
| Armenia | 9 | 0.1% |
| Asia | 3,294 | 42.3% |
| Australia | 47 | 0.6% |
| Bangladesh | 43 | 0.5% |
| Cambodia | 21 | 0.3% |
| Canada | 4 | 0.1% |
| Central America | 538 | 6.9% |
| China | 1,357 | 17.4% |
| Czechoslovakia | 8 | 0.1% |
| Eastern Asia | 1,508 | 19.4% |
| Eastern Europe | 32 | 0.4% |
| El Salvador | 126 | 1.6% |
| Europe | 37 | 0.5% |
| Hong Kong | 145 | 1.9% |
| Indonesia | 75 | 1.0% |
| Japan | 34 | 0.4% |
| Korea | 117 | 1.5% |
| Latin America | 541 | 7.0% |
| Lebanon | 8 | 0.1% |
| Malaysia | 7 | 0.1% |
| Mexico | 412 | 5.3% |
| Northern Europe | 5 | 0.1% |
| Oceania | 47 | 0.6% |
| Peru | 3 | 0.0% |
| Philippines | 124 | 1.6% |
| Poland | 24 | 0.3% |
| Scotland | 5 | 0.1% |
| South Africa | 23 | 0.3% |
| South America | 3 | 0.0% |
| South Central Asia | 43 | 0.5% |
| South Eastern Asia | 1,726 | 22.2% |
| Taiwan | 40 | 0.5% |
| Thailand | 39 | 0.5% |
| Vietnam | 1,359 | 17.4% |
| Western Asia | 17 | 0.2% | View All 36 Rows |
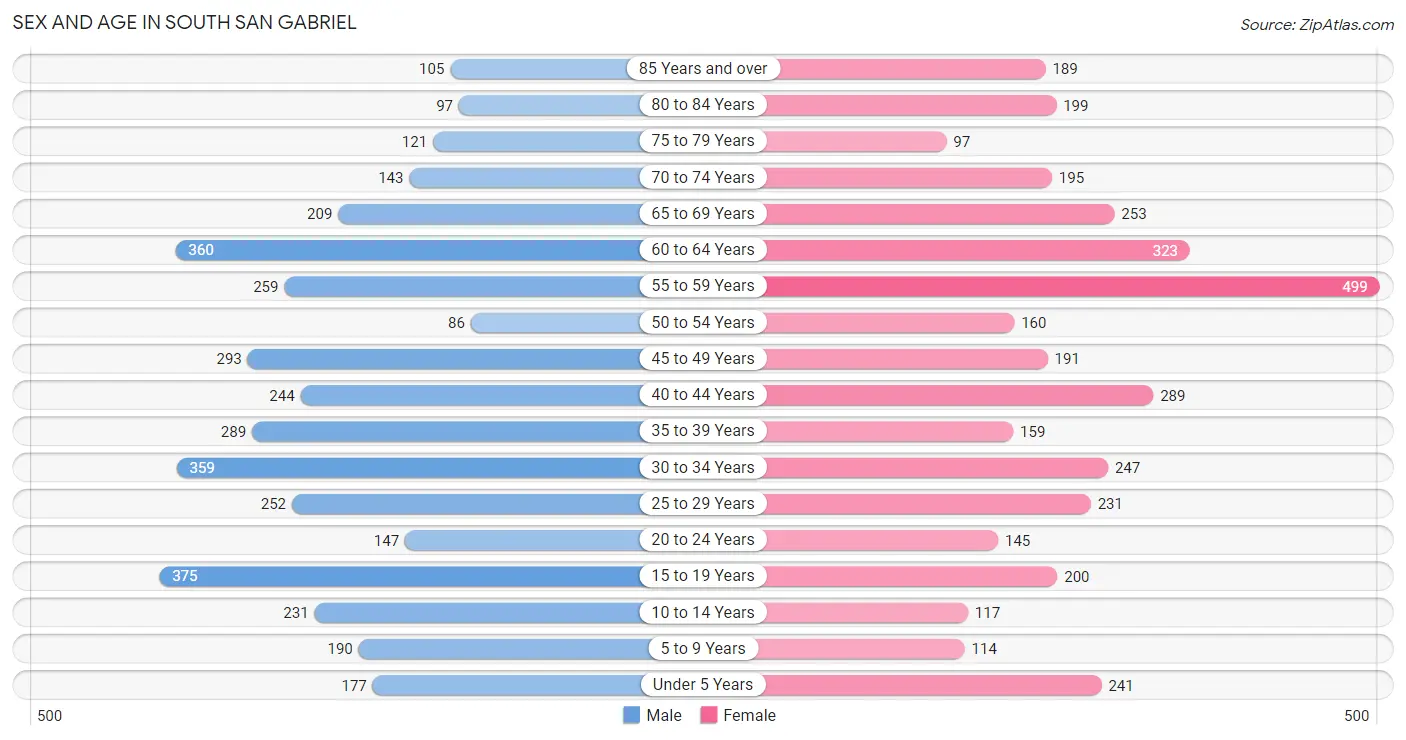
Sex and Age in South San Gabriel
Sex and Age in South San Gabriel
The most populous age groups in South San Gabriel are 15 to 19 Years (375 | 9.5%) for men and 55 to 59 Years (499 | 13.0%) for women.
| Age Bracket | Male | Female |
| Under 5 Years | 177 (4.5%) | 241 (6.3%) |
| 5 to 9 Years | 190 (4.8%) | 114 (3.0%) |
| 10 to 14 Years | 231 (5.9%) | 117 (3.0%) |
| 15 to 19 Years | 375 (9.5%) | 200 (5.2%) |
| 20 to 24 Years | 147 (3.7%) | 145 (3.8%) |
| 25 to 29 Years | 252 (6.4%) | 231 (6.0%) |
| 30 to 34 Years | 359 (9.1%) | 247 (6.4%) |
| 35 to 39 Years | 289 (7.3%) | 159 (4.1%) |
| 40 to 44 Years | 244 (6.2%) | 289 (7.5%) |
| 45 to 49 Years | 293 (7.4%) | 191 (5.0%) |
| 50 to 54 Years | 86 (2.2%) | 160 (4.2%) |
| 55 to 59 Years | 259 (6.6%) | 499 (13.0%) |
| 60 to 64 Years | 360 (9.1%) | 323 (8.4%) |
| 65 to 69 Years | 209 (5.3%) | 253 (6.6%) |
| 70 to 74 Years | 143 (3.6%) | 195 (5.1%) |
| 75 to 79 Years | 121 (3.1%) | 97 (2.5%) |
| 80 to 84 Years | 97 (2.5%) | 199 (5.2%) |
| 85 Years and over | 105 (2.7%) | 189 (4.9%) |
| Total | 3,937 (100.0%) | 3,849 (100.0%) |
Families and Households in South San Gabriel
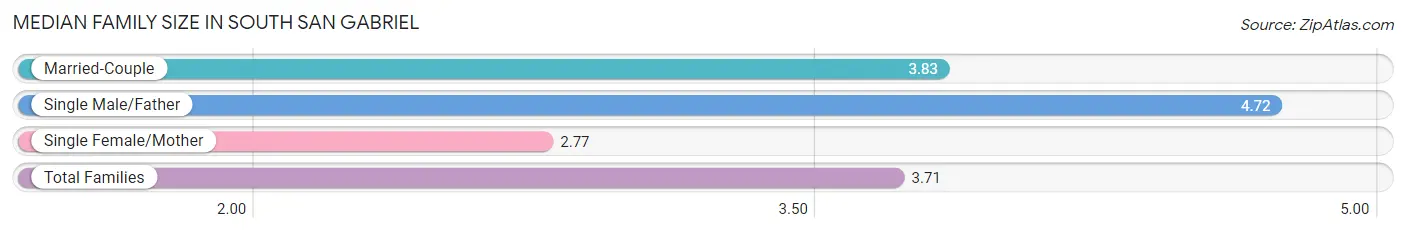
Median Family Size in South San Gabriel
The median family size in South San Gabriel is 3.71 persons per family, with single male/father families (164 | 8.8%) accounting for the largest median family size of 4.72 persons per family. On the other hand, single female/mother families (348 | 18.6%) represent the smallest median family size with 2.77 persons per family.
| Family Type | # Families | Family Size |
| Married-Couple | 1,356 (72.6%) | 3.83 |
| Single Male/Father | 164 (8.8%) | 4.72 |
| Single Female/Mother | 348 (18.6%) | 2.77 |
| Total Families | 1,868 (100.0%) | 3.71 |
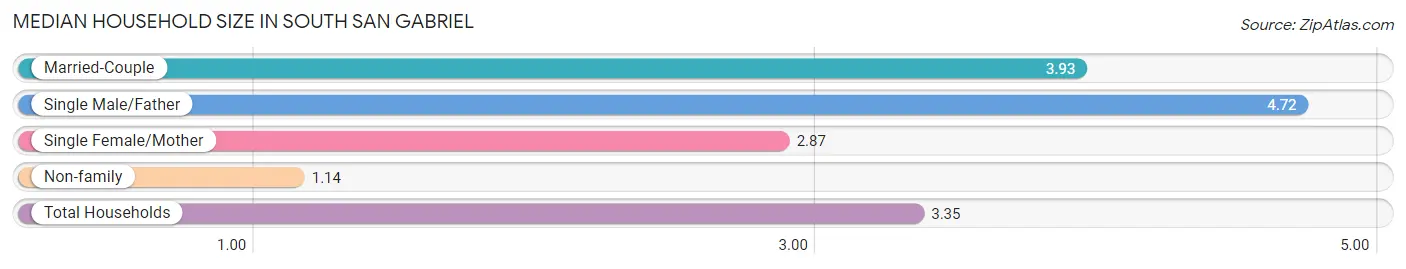
Median Household Size in South San Gabriel
The median household size in South San Gabriel is 3.35 persons per household, with single male/father households (164 | 7.3%) accounting for the largest median household size of 4.72 persons per household. non-family households (388 | 17.2%) represent the smallest median household size with 1.14 persons per household.
| Household Type | # Households | Household Size |
| Married-Couple | 1,356 (60.1%) | 3.93 |
| Single Male/Father | 164 (7.3%) | 4.72 |
| Single Female/Mother | 348 (15.4%) | 2.87 |
| Non-family | 388 (17.2%) | 1.14 |
| Total Households | 2,256 (100.0%) | 3.35 |
Household Size by Marriage Status in South San Gabriel
Out of a total of 2,256 households in South San Gabriel, 1,868 (82.8%) are family households, while 388 (17.2%) are nonfamily households. The most numerous type of family households are 4-person households, comprising 591, and the most common type of nonfamily households are 1-person households, comprising 337.
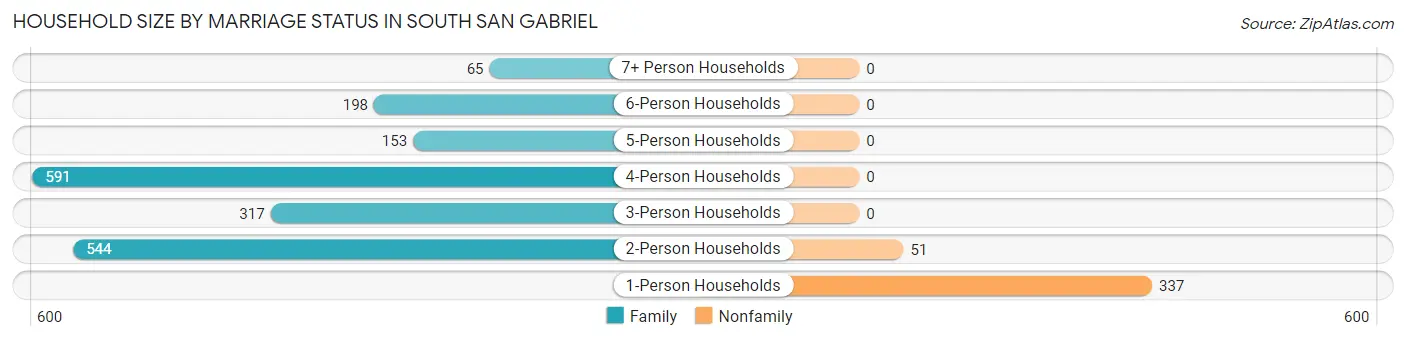
| Household Size | Family Households | Nonfamily Households |
| 1-Person Households | - | 337 (14.9%) |
| 2-Person Households | 544 (24.1%) | 51 (2.3%) |
| 3-Person Households | 317 (14.1%) | 0 (0.0%) |
| 4-Person Households | 591 (26.2%) | 0 (0.0%) |
| 5-Person Households | 153 (6.8%) | 0 (0.0%) |
| 6-Person Households | 198 (8.8%) | 0 (0.0%) |
| 7+ Person Households | 65 (2.9%) | 0 (0.0%) |
| Total | 1,868 (82.8%) | 388 (17.2%) |
Female Fertility in South San Gabriel
Fertility by Age in South San Gabriel
| Age Bracket | Women with Births | Births / 1,000 Women |
| 15 to 19 years | 0 (0.0%) | 0.0 |
| 20 to 34 years | 0 (0.0%) | 0.0 |
| 35 to 50 years | 0 (0.0%) | 0.0 |
| Total | 0 (0.0%) | 0.0 |
Fertility by Age by Marriage Status in South San Gabriel
| Age Bracket | Married | Unmarried |
| 15 to 19 years | 0 (0.0%) | 0 (0.0%) |
| 20 to 34 years | 0 (0.0%) | 0 (0.0%) |
| 35 to 50 years | 0 (0.0%) | 0 (0.0%) |
| Total | 0 (0.0%) | 0 (0.0%) |
Fertility by Education in South San Gabriel
| Educational Attainment | Women with Births | Births / 1,000 Women |
| Less than High School | 0 (0.0%) | 0.0 |
| High School Diploma | 0 (0.0%) | 0.0 |
| College or Associate's Degree | 0 (0.0%) | 0.0 |
| Bachelor's Degree | 0 (0.0%) | 0.0 |
| Graduate Degree | 0 (0.0%) | 0.0 |
| Total | 0 (0.0%) | 0.0 |
Fertility by Education by Marriage Status in South San Gabriel
| Educational Attainment | Married | Unmarried |
| Less than High School | 0 (0.0%) | 0 (0.0%) |
| High School Diploma | 0 (0.0%) | 0 (0.0%) |
| College or Associate's Degree | 0 (0.0%) | 0 (0.0%) |
| Bachelor's Degree | 0 (0.0%) | 0 (0.0%) |
| Graduate Degree | 0 (0.0%) | 0 (0.0%) |
| Total | 0 (0.0%) | 0 (0.0%) |
Employment Characteristics in South San Gabriel
Employment by Class of Employer in South San Gabriel
Among the 3,605 employed individuals in South San Gabriel, private company employees (2,343 | 65.0%), self-employed (not incorporated) (496 | 13.8%), and local government employees (355 | 9.9%) make up the most common classes of employment.
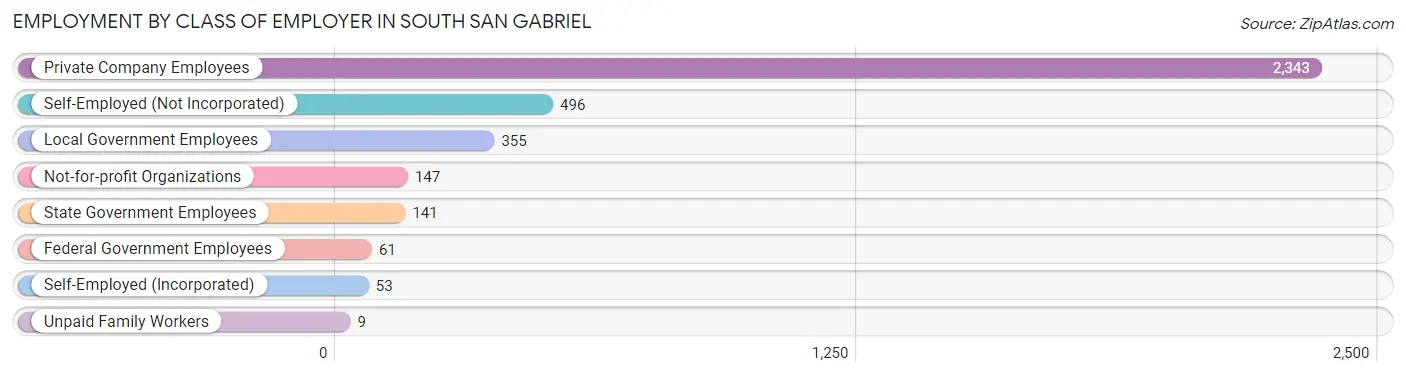
| Employer Class | # Employees | % Employees |
| Private Company Employees | 2,343 | 65.0% |
| Self-Employed (Incorporated) | 53 | 1.5% |
| Self-Employed (Not Incorporated) | 496 | 13.8% |
| Not-for-profit Organizations | 147 | 4.1% |
| Local Government Employees | 355 | 9.9% |
| State Government Employees | 141 | 3.9% |
| Federal Government Employees | 61 | 1.7% |
| Unpaid Family Workers | 9 | 0.3% |
| Total | 3,605 | 100.0% |
Employment Status by Age in South San Gabriel
According to the labor force statistics for South San Gabriel, out of the total population over 16 years of age (6,614), 58.2% or 3,849 individuals are in the labor force, with 5.4% or 208 of them unemployed. The age group with the highest labor force participation rate is 30 to 34 years, with 96.0% or 582 individuals in the labor force. Within the labor force, the 25 to 29 years age range has the highest percentage of unemployed individuals, with 12.3% or 49 of them being unemployed.
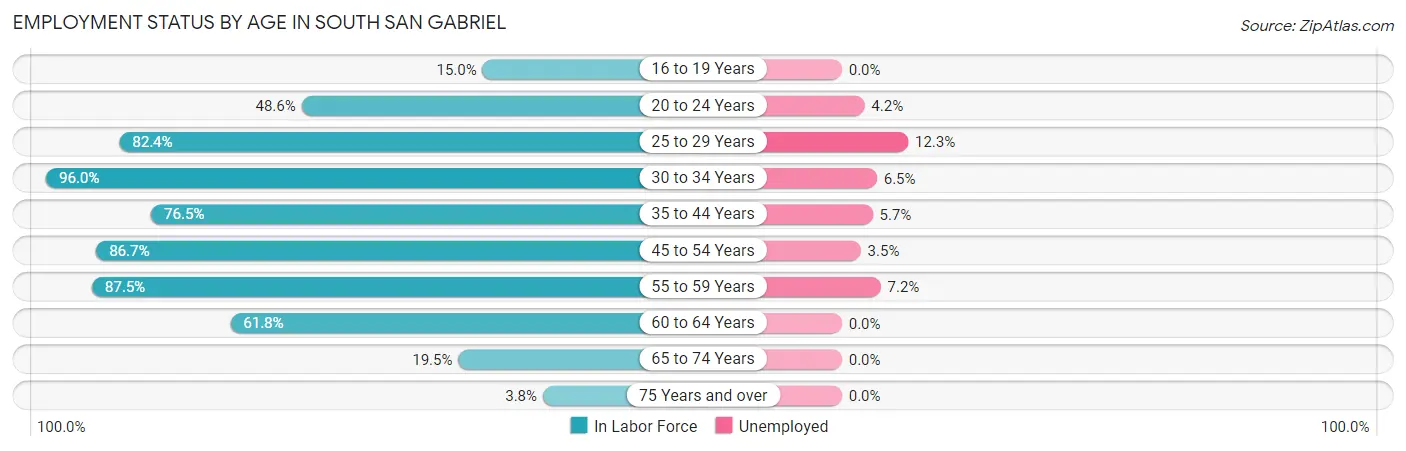
| Age Bracket | In Labor Force | Unemployed |
| 16 to 19 Years | 71 (15.0%) | 0 (0.0%) |
| 20 to 24 Years | 142 (48.6%) | 6 (4.2%) |
| 25 to 29 Years | 398 (82.4%) | 49 (12.3%) |
| 30 to 34 Years | 582 (96.0%) | 38 (6.5%) |
| 35 to 44 Years | 750 (76.5%) | 43 (5.7%) |
| 45 to 54 Years | 633 (86.7%) | 22 (3.5%) |
| 55 to 59 Years | 663 (87.5%) | 48 (7.2%) |
| 60 to 64 Years | 422 (61.8%) | 0 (0.0%) |
| 65 to 74 Years | 156 (19.5%) | 0 (0.0%) |
| 75 Years and over | 31 (3.8%) | 0 (0.0%) |
| Total | 3,849 (58.2%) | 208 (5.4%) |
Employment Status by Educational Attainment in South San Gabriel
According to labor force statistics for South San Gabriel, 81.3% of individuals (3,448) out of the total population between 25 and 64 years of age (4,241) are in the labor force, with 5.8% or 200 of them being unemployed. The group with the highest labor force participation rate are those with the educational attainment of high school diploma, with 90.9% or 952 individuals in the labor force. Within the labor force, individuals with less than high school education have the highest percentage of unemployment, with 7.8% or 36 of them being unemployed.
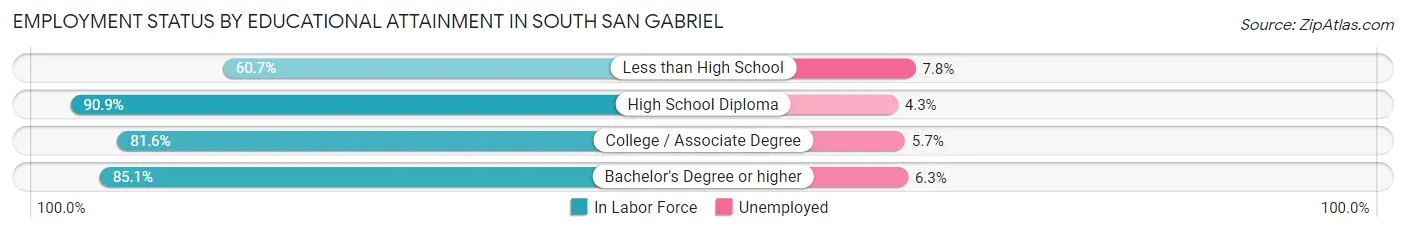
| Educational Attainment | In Labor Force | Unemployed |
| Less than High School | 463 (60.7%) | 60 (7.8%) |
| High School Diploma | 952 (90.9%) | 45 (4.3%) |
| College / Associate Degree | 845 (81.6%) | 59 (5.7%) |
| Bachelor's Degree or higher | 1,188 (85.1%) | 88 (6.3%) |
| Total | 3,448 (81.3%) | 246 (5.8%) |
Employment Occupations by Sex in South San Gabriel
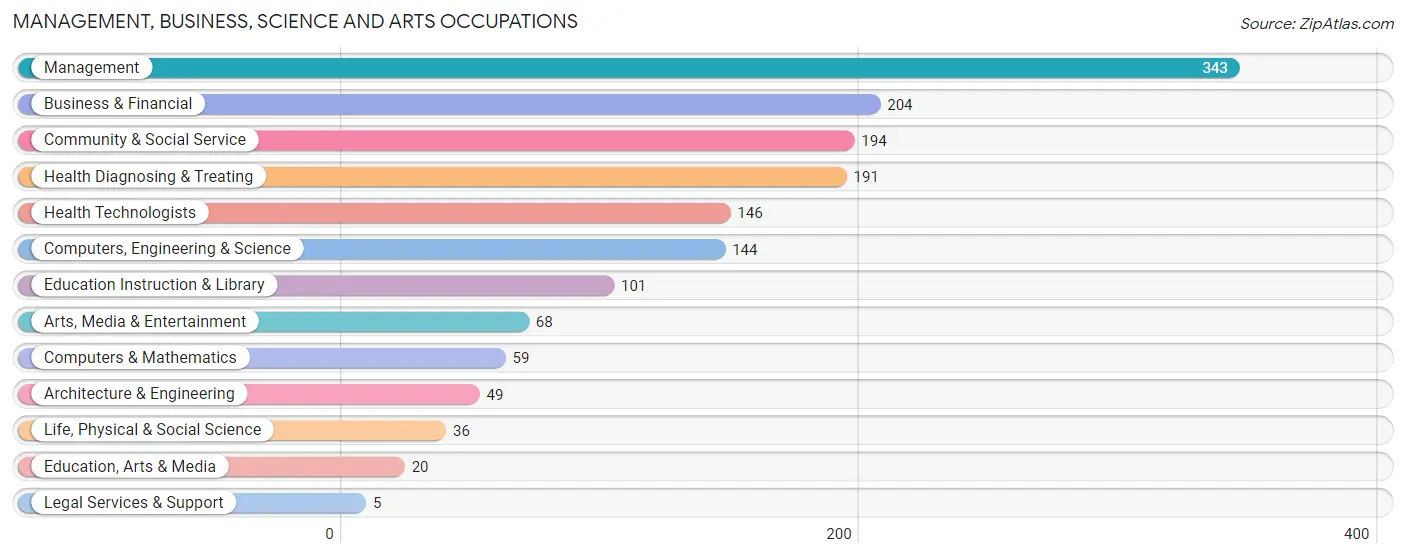
Management, Business, Science and Arts Occupations
The most common Management, Business, Science and Arts occupations in South San Gabriel are Management (343 | 9.4%), Business & Financial (204 | 5.6%), Community & Social Service (194 | 5.3%), Health Diagnosing & Treating (191 | 5.2%), and Health Technologists (146 | 4.0%).
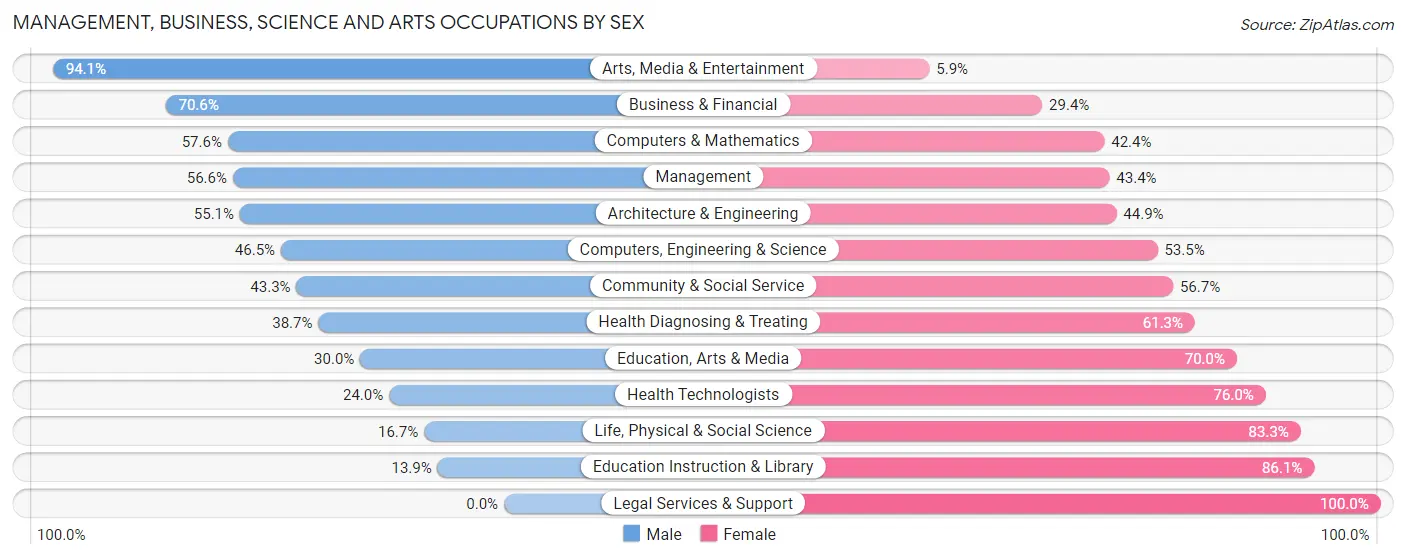
Management, Business, Science and Arts Occupations by Sex
Within the Management, Business, Science and Arts occupations in South San Gabriel, the most male-oriented occupations are Arts, Media & Entertainment (94.1%), Business & Financial (70.6%), and Computers & Mathematics (57.6%), while the most female-oriented occupations are Legal Services & Support (100.0%), Education Instruction & Library (86.1%), and Life, Physical & Social Science (83.3%).
| Occupation | Male | Female |
| Management | 194 (56.6%) | 149 (43.4%) |
| Business & Financial | 144 (70.6%) | 60 (29.4%) |
| Computers, Engineering & Science | 67 (46.5%) | 77 (53.5%) |
| Computers & Mathematics | 34 (57.6%) | 25 (42.4%) |
| Architecture & Engineering | 27 (55.1%) | 22 (44.9%) |
| Life, Physical & Social Science | 6 (16.7%) | 30 (83.3%) |
| Community & Social Service | 84 (43.3%) | 110 (56.7%) |
| Education, Arts & Media | 6 (30.0%) | 14 (70.0%) |
| Legal Services & Support | 0 (0.0%) | 5 (100.0%) |
| Education Instruction & Library | 14 (13.9%) | 87 (86.1%) |
| Arts, Media & Entertainment | 64 (94.1%) | 4 (5.9%) |
| Health Diagnosing & Treating | 74 (38.7%) | 117 (61.3%) |
| Health Technologists | 35 (24.0%) | 111 (76.0%) |
| Total (Category) | 563 (52.3%) | 513 (47.7%) |
| Total (Overall) | 1,890 (51.9%) | 1,752 (48.1%) |
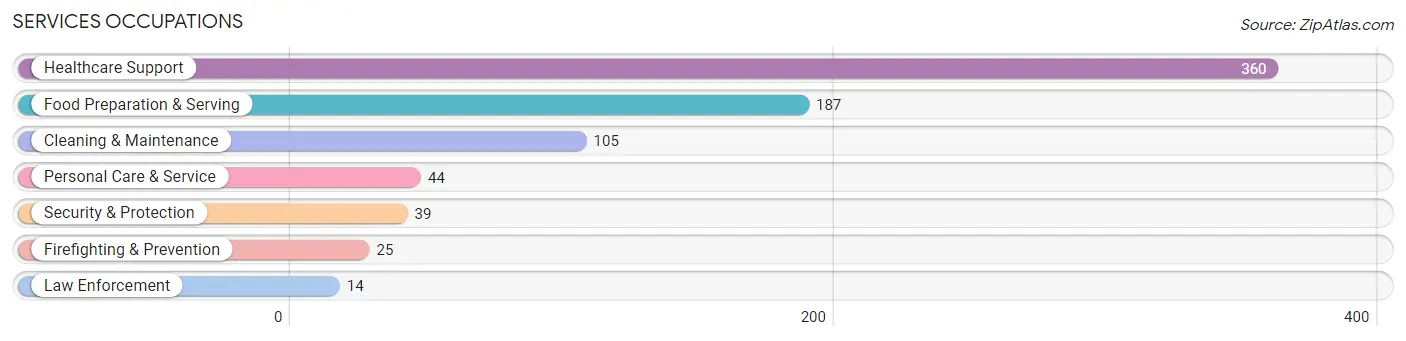
Services Occupations
The most common Services occupations in South San Gabriel are Healthcare Support (360 | 9.9%), Food Preparation & Serving (187 | 5.1%), Cleaning & Maintenance (105 | 2.9%), Personal Care & Service (44 | 1.2%), and Security & Protection (39 | 1.1%).
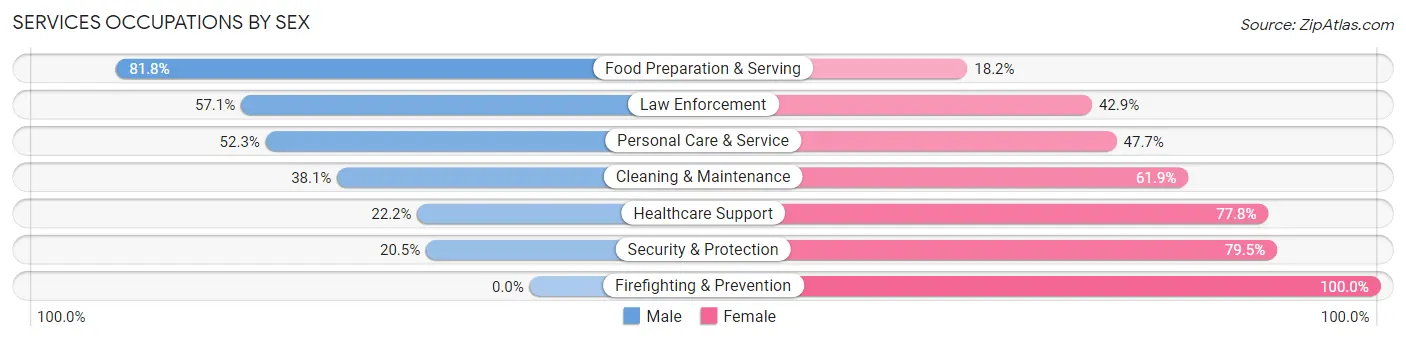
Services Occupations by Sex
Within the Services occupations in South San Gabriel, the most male-oriented occupations are Food Preparation & Serving (81.8%), Law Enforcement (57.1%), and Personal Care & Service (52.3%), while the most female-oriented occupations are Firefighting & Prevention (100.0%), Security & Protection (79.5%), and Healthcare Support (77.8%).
| Occupation | Male | Female |
| Healthcare Support | 80 (22.2%) | 280 (77.8%) |
| Security & Protection | 8 (20.5%) | 31 (79.5%) |
| Firefighting & Prevention | 0 (0.0%) | 25 (100.0%) |
| Law Enforcement | 8 (57.1%) | 6 (42.9%) |
| Food Preparation & Serving | 153 (81.8%) | 34 (18.2%) |
| Cleaning & Maintenance | 40 (38.1%) | 65 (61.9%) |
| Personal Care & Service | 23 (52.3%) | 21 (47.7%) |
| Total (Category) | 304 (41.4%) | 431 (58.6%) |
| Total (Overall) | 1,890 (51.9%) | 1,752 (48.1%) |
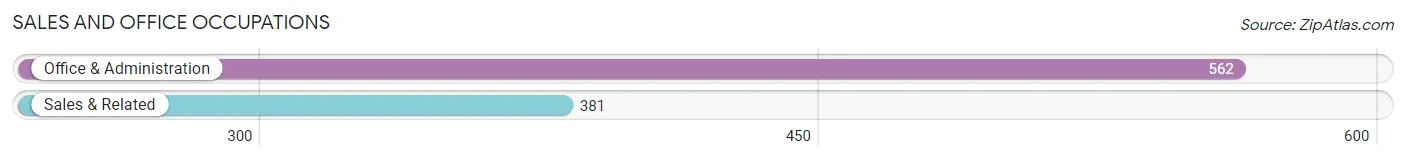
Sales and Office Occupations
The most common Sales and Office occupations in South San Gabriel are Office & Administration (562 | 15.4%), and Sales & Related (381 | 10.5%).
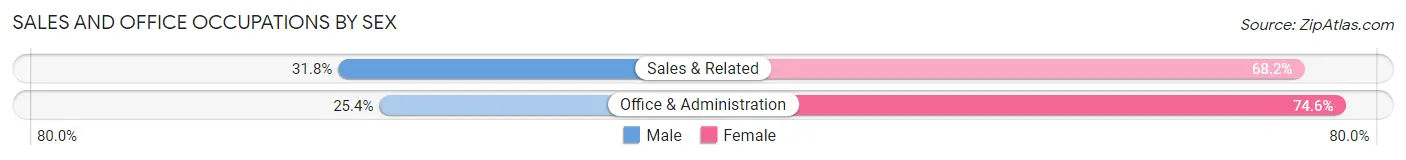
Sales and Office Occupations by Sex
| Occupation | Male | Female |
| Sales & Related | 121 (31.8%) | 260 (68.2%) |
| Office & Administration | 143 (25.4%) | 419 (74.6%) |
| Total (Category) | 264 (28.0%) | 679 (72.0%) |
| Total (Overall) | 1,890 (51.9%) | 1,752 (48.1%) |
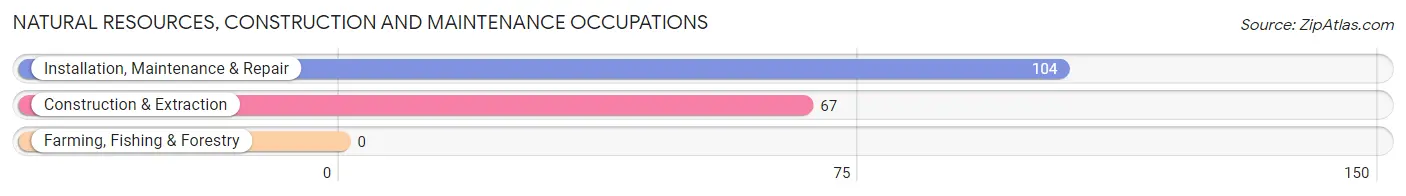
Natural Resources, Construction and Maintenance Occupations
The most common Natural Resources, Construction and Maintenance occupations in South San Gabriel are Installation, Maintenance & Repair (104 | 2.9%), and Construction & Extraction (67 | 1.8%).
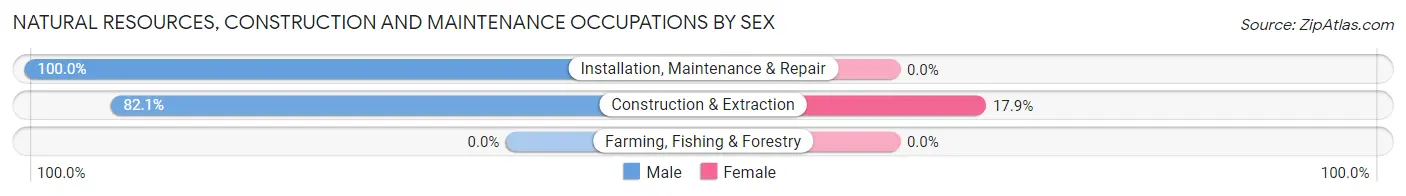
Natural Resources, Construction and Maintenance Occupations by Sex
| Occupation | Male | Female |
| Farming, Fishing & Forestry | 0 (0.0%) | 0 (0.0%) |
| Construction & Extraction | 55 (82.1%) | 12 (17.9%) |
| Installation, Maintenance & Repair | 104 (100.0%) | 0 (0.0%) |
| Total (Category) | 159 (93.0%) | 12 (7.0%) |
| Total (Overall) | 1,890 (51.9%) | 1,752 (48.1%) |
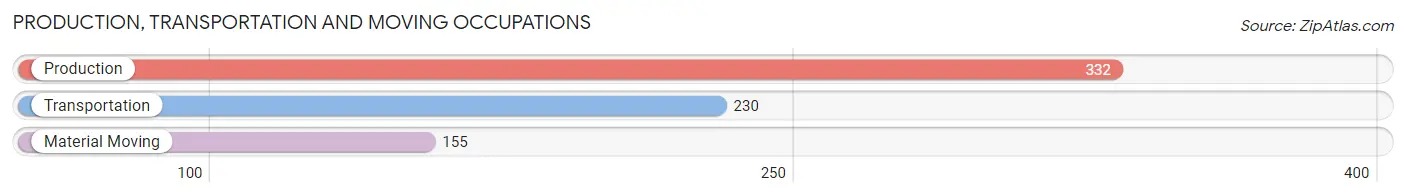
Production, Transportation and Moving Occupations
The most common Production, Transportation and Moving occupations in South San Gabriel are Production (332 | 9.1%), Transportation (230 | 6.3%), and Material Moving (155 | 4.3%).
Production, Transportation and Moving Occupations by Sex
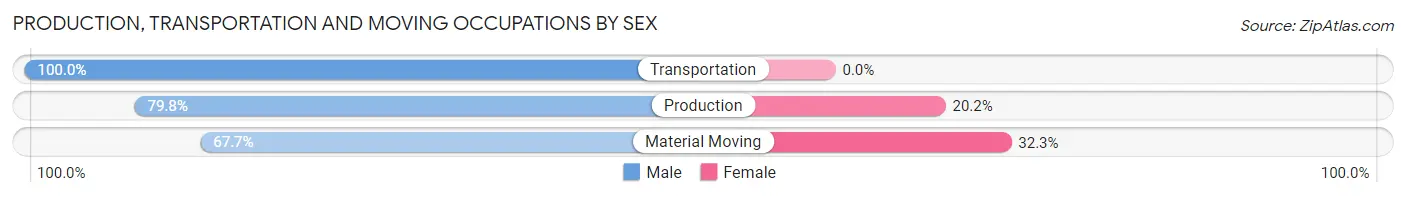
| Occupation | Male | Female |
| Production | 265 (79.8%) | 67 (20.2%) |
| Transportation | 230 (100.0%) | 0 (0.0%) |
| Material Moving | 105 (67.7%) | 50 (32.3%) |
| Total (Category) | 600 (83.7%) | 117 (16.3%) |
| Total (Overall) | 1,890 (51.9%) | 1,752 (48.1%) |
Employment Industries by Sex in South San Gabriel
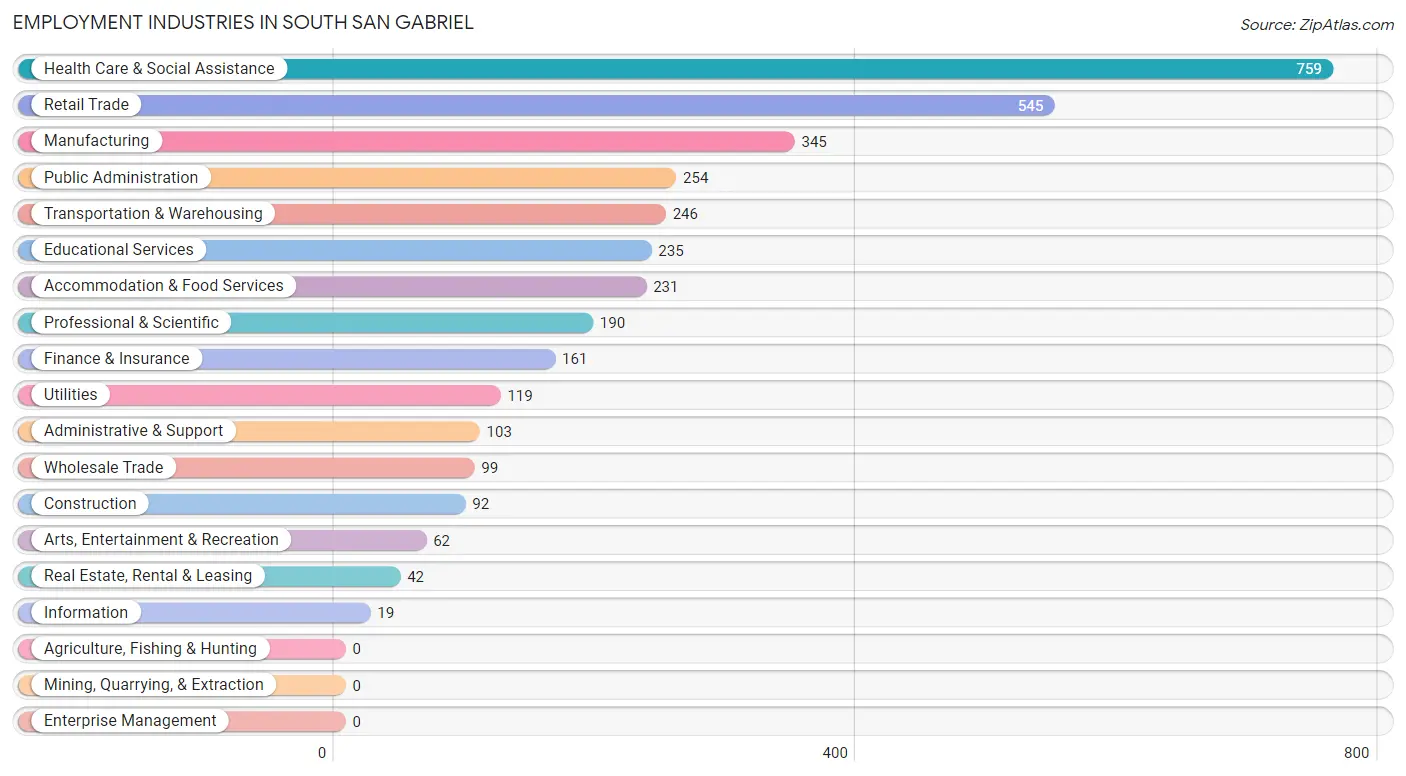
Employment Industries in South San Gabriel
The major employment industries in South San Gabriel include Health Care & Social Assistance (759 | 20.8%), Retail Trade (545 | 15.0%), Manufacturing (345 | 9.5%), Public Administration (254 | 7.0%), and Transportation & Warehousing (246 | 6.8%).
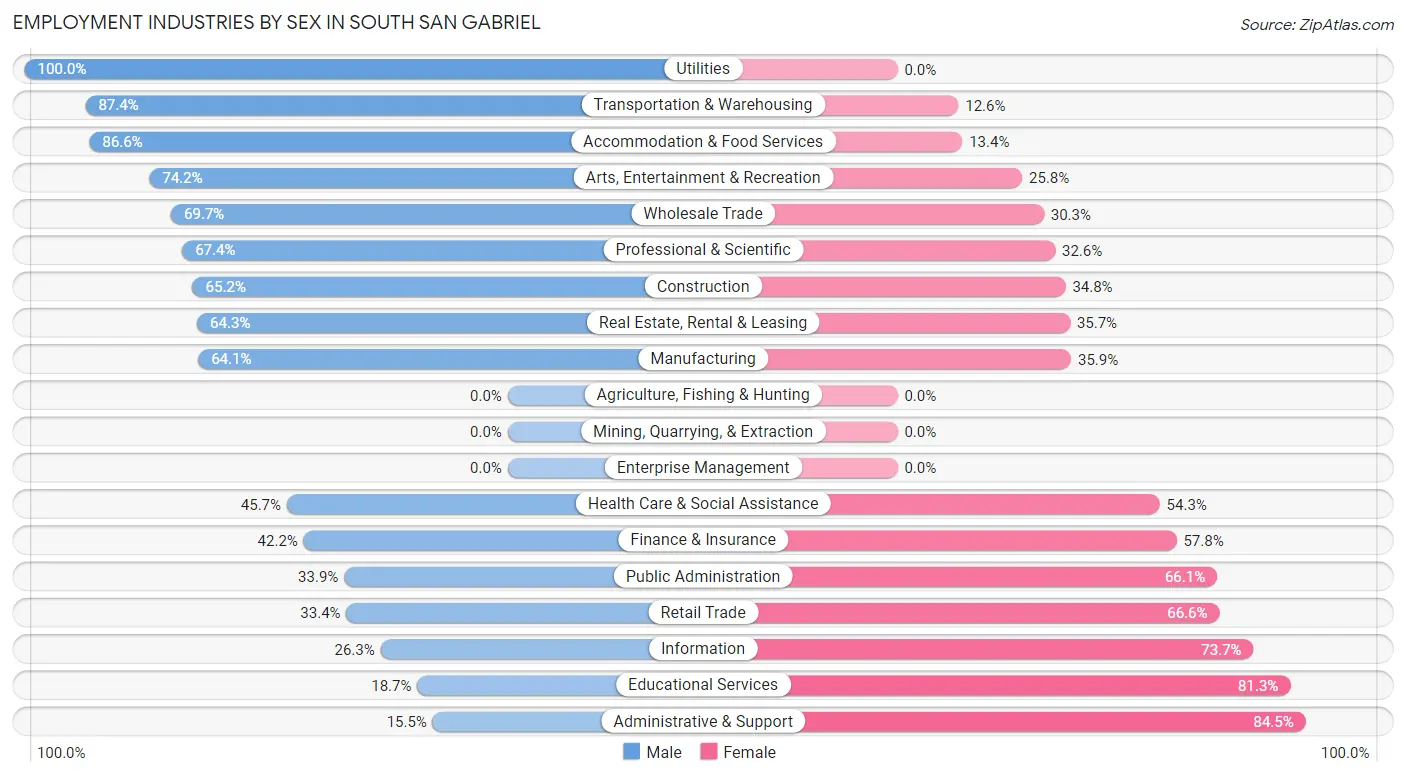
Employment Industries by Sex in South San Gabriel
The South San Gabriel industries that see more men than women are Utilities (100.0%), Transportation & Warehousing (87.4%), and Accommodation & Food Services (86.6%), whereas the industries that tend to have a higher number of women are Administrative & Support (84.5%), Educational Services (81.3%), and Information (73.7%).
| Industry | Male | Female |
| Agriculture, Fishing & Hunting | 0 (0.0%) | 0 (0.0%) |
| Mining, Quarrying, & Extraction | 0 (0.0%) | 0 (0.0%) |
| Construction | 60 (65.2%) | 32 (34.8%) |
| Manufacturing | 221 (64.1%) | 124 (35.9%) |
| Wholesale Trade | 69 (69.7%) | 30 (30.3%) |
| Retail Trade | 182 (33.4%) | 363 (66.6%) |
| Transportation & Warehousing | 215 (87.4%) | 31 (12.6%) |
| Utilities | 119 (100.0%) | 0 (0.0%) |
| Information | 5 (26.3%) | 14 (73.7%) |
| Finance & Insurance | 68 (42.2%) | 93 (57.8%) |
| Real Estate, Rental & Leasing | 27 (64.3%) | 15 (35.7%) |
| Professional & Scientific | 128 (67.4%) | 62 (32.6%) |
| Enterprise Management | 0 (0.0%) | 0 (0.0%) |
| Administrative & Support | 16 (15.5%) | 87 (84.5%) |
| Educational Services | 44 (18.7%) | 191 (81.3%) |
| Health Care & Social Assistance | 347 (45.7%) | 412 (54.3%) |
| Arts, Entertainment & Recreation | 46 (74.2%) | 16 (25.8%) |
| Accommodation & Food Services | 200 (86.6%) | 31 (13.4%) |
| Public Administration | 86 (33.9%) | 168 (66.1%) |
| Total | 1,890 (51.9%) | 1,752 (48.1%) |
Education in South San Gabriel
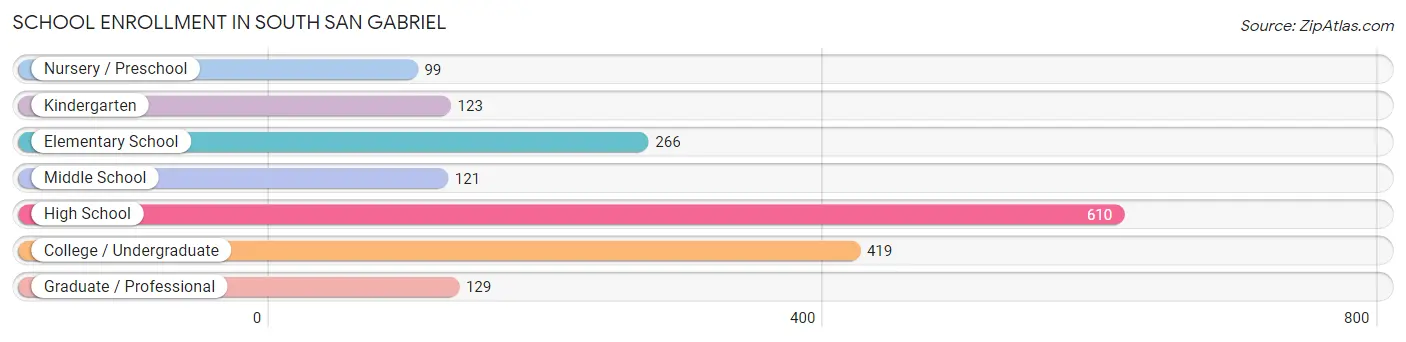
School Enrollment in South San Gabriel
The most common levels of schooling among the 1,767 students in South San Gabriel are high school (610 | 34.5%), college / undergraduate (419 | 23.7%), and elementary school (266 | 15.0%).
| School Level | # Students | % Students |
| Nursery / Preschool | 99 | 5.6% |
| Kindergarten | 123 | 7.0% |
| Elementary School | 266 | 15.0% |
| Middle School | 121 | 6.9% |
| High School | 610 | 34.5% |
| College / Undergraduate | 419 | 23.7% |
| Graduate / Professional | 129 | 7.3% |
| Total | 1,767 | 100.0% |
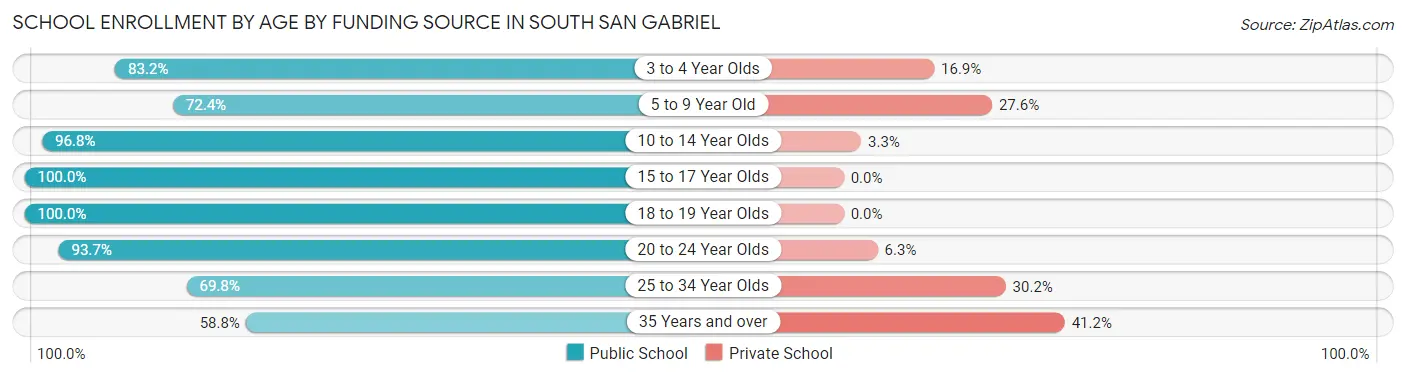
School Enrollment by Age by Funding Source in South San Gabriel
Out of a total of 1,767 students who are enrolled in schools in South San Gabriel, 237 (13.4%) attend a private institution, while the remaining 1,530 (86.6%) are enrolled in public schools. The age group of 35 years and over has the highest likelihood of being enrolled in private schools, with 28 (41.2% in the age bracket) enrolled. Conversely, the age group of 15 to 17 year olds has the lowest likelihood of being enrolled in a private school, with 459 (100.0% in the age bracket) attending a public institution.
| Age Bracket | Public School | Private School |
| 3 to 4 Year Olds | 74 (83.2%) | 15 (16.9%) |
| 5 to 9 Year Old | 220 (72.4%) | 84 (27.6%) |
| 10 to 14 Year Olds | 298 (96.8%) | 10 (3.3%) |
| 15 to 17 Year Olds | 459 (100.0%) | 0 (0.0%) |
| 18 to 19 Year Olds | 86 (100.0%) | 0 (0.0%) |
| 20 to 24 Year Olds | 148 (93.7%) | 10 (6.3%) |
| 25 to 34 Year Olds | 206 (69.8%) | 89 (30.2%) |
| 35 Years and over | 40 (58.8%) | 28 (41.2%) |
| Total | 1,530 (86.6%) | 237 (13.4%) |
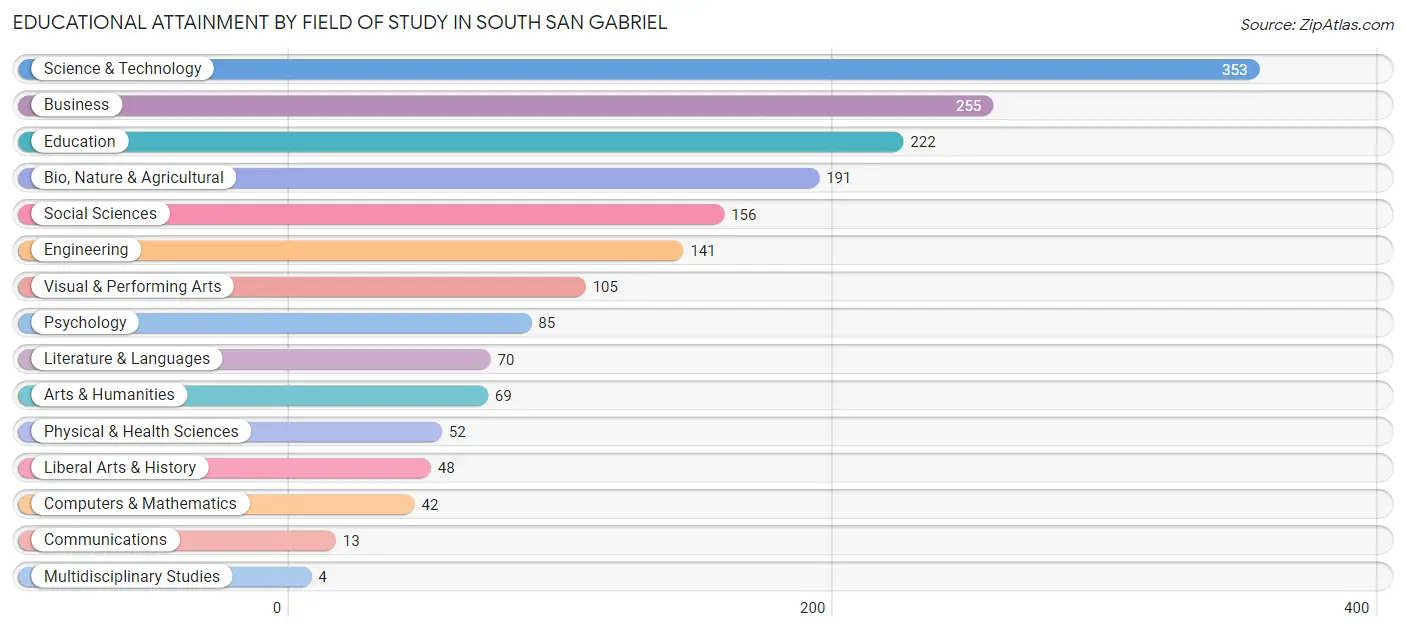
Educational Attainment by Field of Study in South San Gabriel
Science & technology (353 | 19.6%), business (255 | 14.1%), education (222 | 12.3%), bio, nature & agricultural (191 | 10.6%), and social sciences (156 | 8.6%) are the most common fields of study among 1,806 individuals in South San Gabriel who have obtained a bachelor's degree or higher.
| Field of Study | # Graduates | % Graduates |
| Computers & Mathematics | 42 | 2.3% |
| Bio, Nature & Agricultural | 191 | 10.6% |
| Physical & Health Sciences | 52 | 2.9% |
| Psychology | 85 | 4.7% |
| Social Sciences | 156 | 8.6% |
| Engineering | 141 | 7.8% |
| Multidisciplinary Studies | 4 | 0.2% |
| Science & Technology | 353 | 19.6% |
| Business | 255 | 14.1% |
| Education | 222 | 12.3% |
| Literature & Languages | 70 | 3.9% |
| Liberal Arts & History | 48 | 2.7% |
| Visual & Performing Arts | 105 | 5.8% |
| Communications | 13 | 0.7% |
| Arts & Humanities | 69 | 3.8% |
| Total | 1,806 | 100.0% |
Transportation & Commute in South San Gabriel
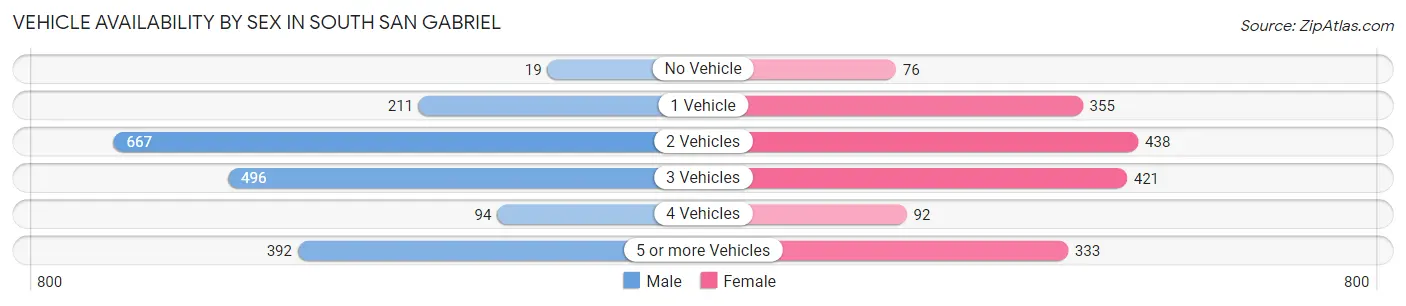
Vehicle Availability by Sex in South San Gabriel
The most prevalent vehicle ownership categories in South San Gabriel are males with 2 vehicles (667, accounting for 35.5%) and females with 2 vehicles (438, making up 38.9%).
| Vehicles Available | Male | Female |
| No Vehicle | 19 (1.0%) | 76 (4.4%) |
| 1 Vehicle | 211 (11.2%) | 355 (20.7%) |
| 2 Vehicles | 667 (35.5%) | 438 (25.5%) |
| 3 Vehicles | 496 (26.4%) | 421 (24.5%) |
| 4 Vehicles | 94 (5.0%) | 92 (5.4%) |
| 5 or more Vehicles | 392 (20.9%) | 333 (19.4%) |
| Total | 1,879 (100.0%) | 1,715 (100.0%) |
Commute Time in South San Gabriel
The most frequently occuring commute durations in South San Gabriel are 20 to 24 minutes (650 commuters, 19.9%), 25 to 29 minutes (547 commuters, 16.8%), and 30 to 34 minutes (518 commuters, 15.9%).
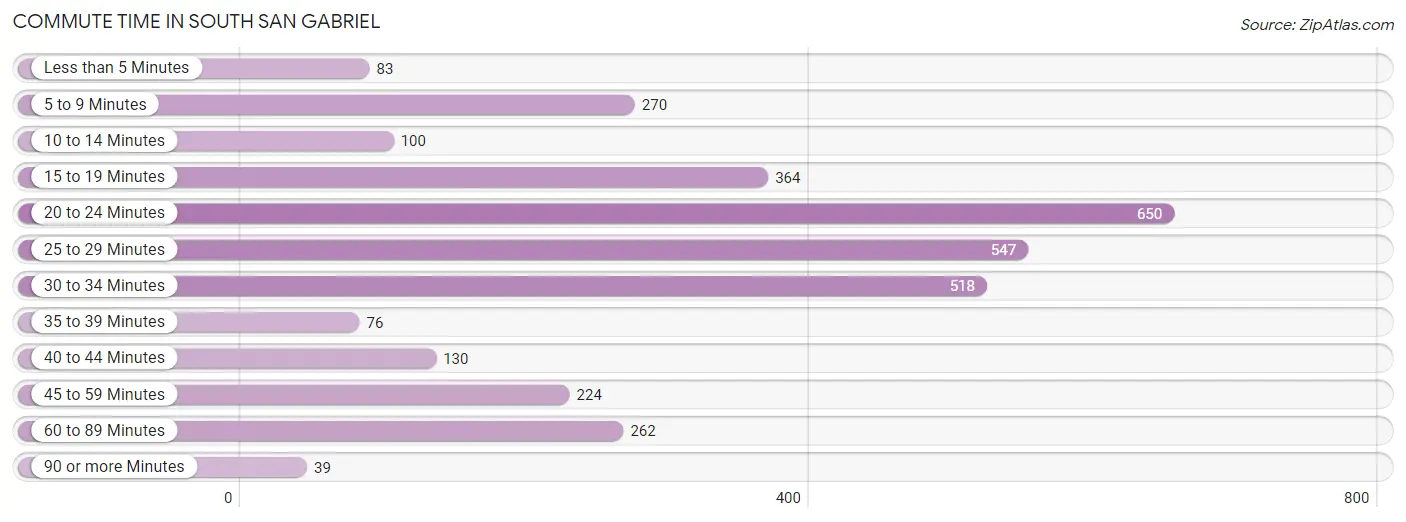
| Commute Time | # Commuters | % Commuters |
| Less than 5 Minutes | 83 | 2.5% |
| 5 to 9 Minutes | 270 | 8.3% |
| 10 to 14 Minutes | 100 | 3.1% |
| 15 to 19 Minutes | 364 | 11.2% |
| 20 to 24 Minutes | 650 | 19.9% |
| 25 to 29 Minutes | 547 | 16.8% |
| 30 to 34 Minutes | 518 | 15.9% |
| 35 to 39 Minutes | 76 | 2.3% |
| 40 to 44 Minutes | 130 | 4.0% |
| 45 to 59 Minutes | 224 | 6.9% |
| 60 to 89 Minutes | 262 | 8.0% |
| 90 or more Minutes | 39 | 1.2% |
Commute Time by Sex in South San Gabriel
The most common commute times in South San Gabriel are 20 to 24 minutes (393 commuters, 23.1%) for males and 25 to 29 minutes (315 commuters, 20.1%) for females.
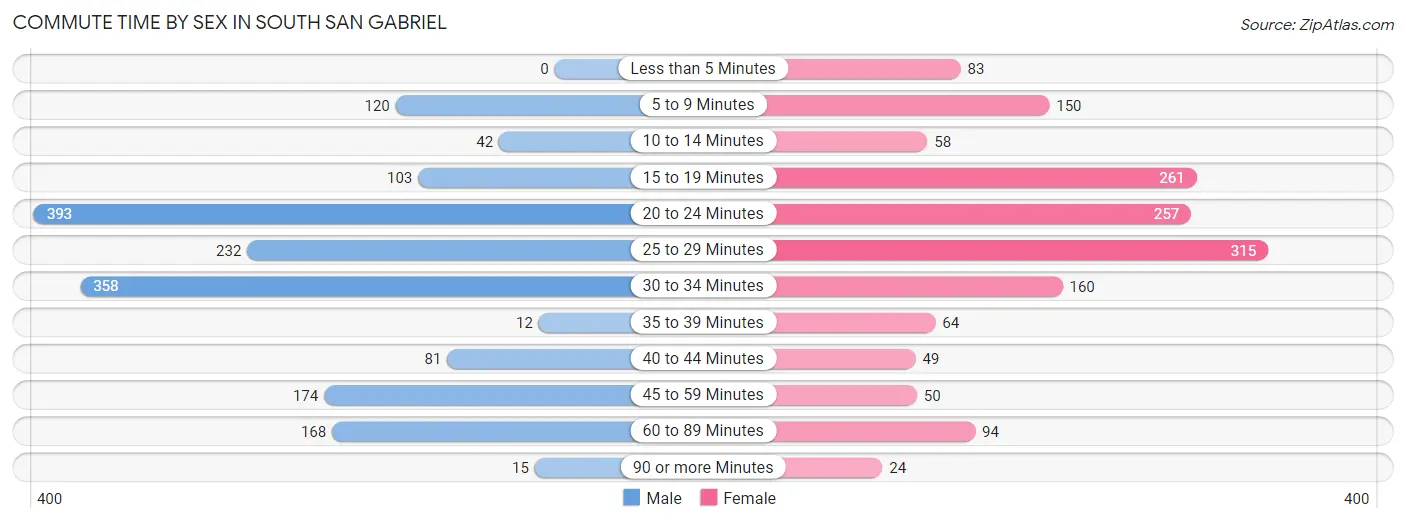
| Commute Time | Male | Female |
| Less than 5 Minutes | 0 (0.0%) | 83 (5.3%) |
| 5 to 9 Minutes | 120 (7.1%) | 150 (9.6%) |
| 10 to 14 Minutes | 42 (2.5%) | 58 (3.7%) |
| 15 to 19 Minutes | 103 (6.1%) | 261 (16.7%) |
| 20 to 24 Minutes | 393 (23.1%) | 257 (16.4%) |
| 25 to 29 Minutes | 232 (13.7%) | 315 (20.1%) |
| 30 to 34 Minutes | 358 (21.1%) | 160 (10.2%) |
| 35 to 39 Minutes | 12 (0.7%) | 64 (4.1%) |
| 40 to 44 Minutes | 81 (4.8%) | 49 (3.1%) |
| 45 to 59 Minutes | 174 (10.2%) | 50 (3.2%) |
| 60 to 89 Minutes | 168 (9.9%) | 94 (6.0%) |
| 90 or more Minutes | 15 (0.9%) | 24 (1.5%) |
Time of Departure to Work by Sex in South San Gabriel
The most frequent times of departure to work in South San Gabriel are 8:00 AM to 8:29 AM (282, 16.6%) for males and 8:30 AM to 8:59 AM (344, 22.0%) for females.
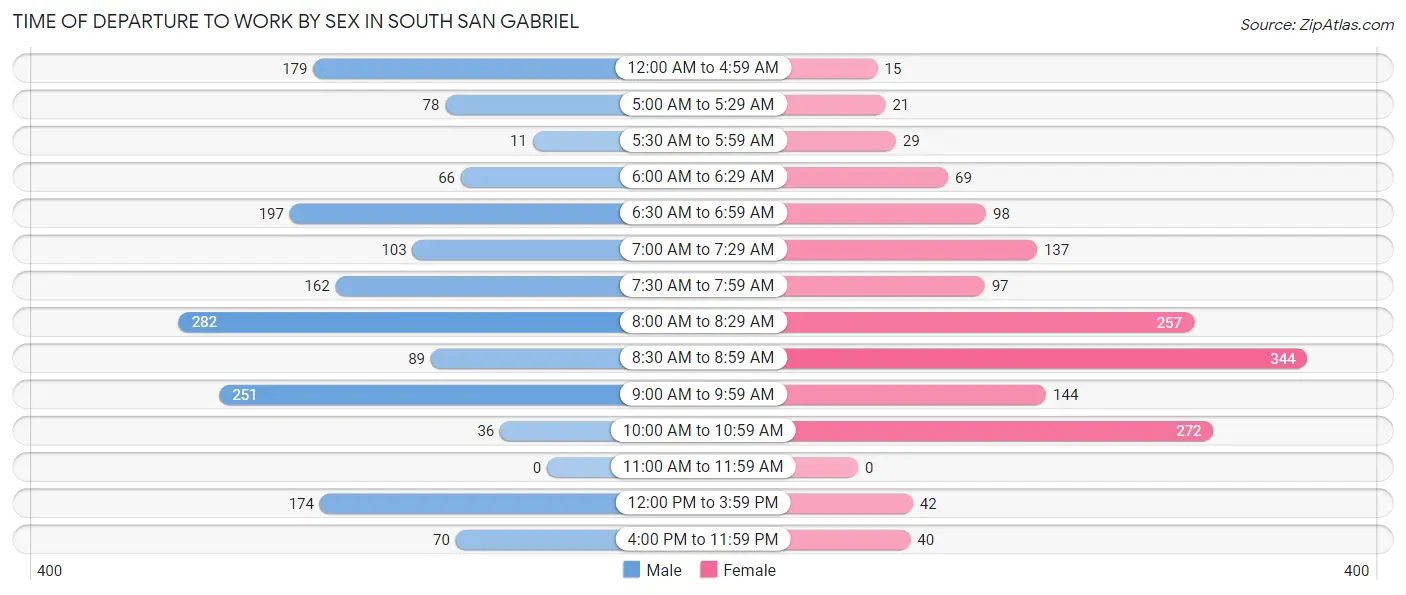
| Time of Departure | Male | Female |
| 12:00 AM to 4:59 AM | 179 (10.5%) | 15 (1.0%) |
| 5:00 AM to 5:29 AM | 78 (4.6%) | 21 (1.3%) |
| 5:30 AM to 5:59 AM | 11 (0.6%) | 29 (1.8%) |
| 6:00 AM to 6:29 AM | 66 (3.9%) | 69 (4.4%) |
| 6:30 AM to 6:59 AM | 197 (11.6%) | 98 (6.3%) |
| 7:00 AM to 7:29 AM | 103 (6.1%) | 137 (8.7%) |
| 7:30 AM to 7:59 AM | 162 (9.5%) | 97 (6.2%) |
| 8:00 AM to 8:29 AM | 282 (16.6%) | 257 (16.4%) |
| 8:30 AM to 8:59 AM | 89 (5.2%) | 344 (22.0%) |
| 9:00 AM to 9:59 AM | 251 (14.8%) | 144 (9.2%) |
| 10:00 AM to 10:59 AM | 36 (2.1%) | 272 (17.4%) |
| 11:00 AM to 11:59 AM | 0 (0.0%) | 0 (0.0%) |
| 12:00 PM to 3:59 PM | 174 (10.2%) | 42 (2.7%) |
| 4:00 PM to 11:59 PM | 70 (4.1%) | 40 (2.6%) |
| Total | 1,698 (100.0%) | 1,565 (100.0%) |
Housing Occupancy in South San Gabriel
Occupancy by Ownership in South San Gabriel
Of the total 2,256 dwellings in South San Gabriel, owner-occupied units account for 1,489 (66.0%), while renter-occupied units make up 767 (34.0%).
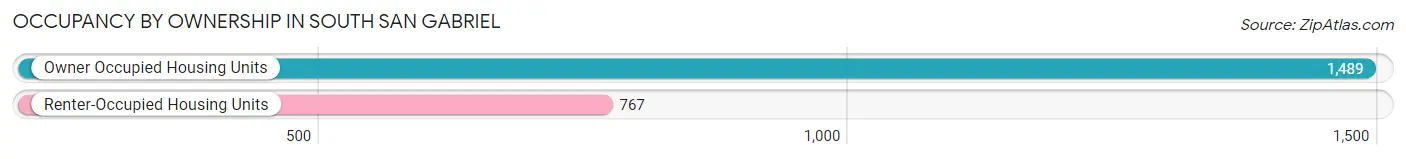
| Occupancy | # Housing Units | % Housing Units |
| Owner Occupied Housing Units | 1,489 | 66.0% |
| Renter-Occupied Housing Units | 767 | 34.0% |
| Total Occupied Housing Units | 2,256 | 100.0% |
Occupancy by Household Size in South San Gabriel
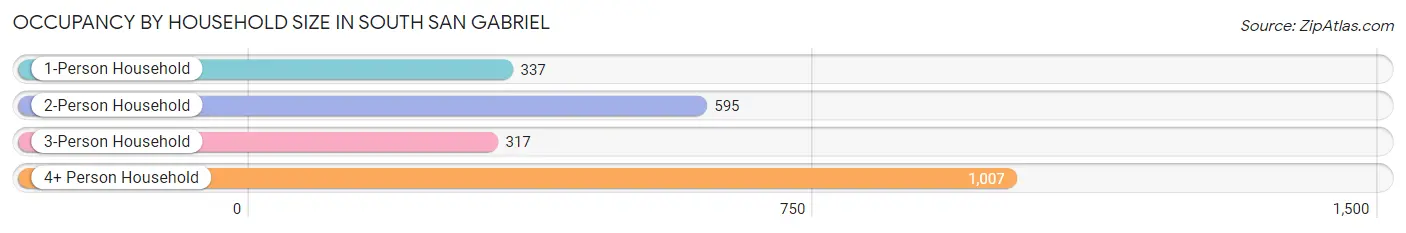
| Household Size | # Housing Units | % Housing Units |
| 1-Person Household | 337 | 14.9% |
| 2-Person Household | 595 | 26.4% |
| 3-Person Household | 317 | 14.1% |
| 4+ Person Household | 1,007 | 44.6% |
| Total Housing Units | 2,256 | 100.0% |
Occupancy by Ownership by Household Size in South San Gabriel
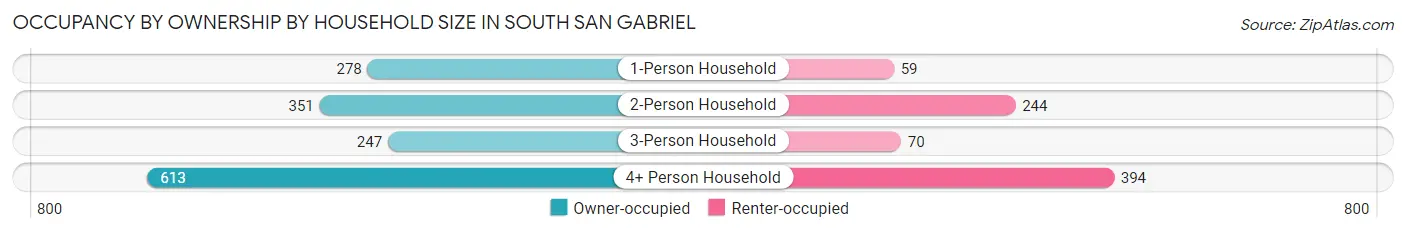
| Household Size | Owner-occupied | Renter-occupied |
| 1-Person Household | 278 (82.5%) | 59 (17.5%) |
| 2-Person Household | 351 (59.0%) | 244 (41.0%) |
| 3-Person Household | 247 (77.9%) | 70 (22.1%) |
| 4+ Person Household | 613 (60.9%) | 394 (39.1%) |
| Total Housing Units | 1,489 (66.0%) | 767 (34.0%) |
Occupancy by Educational Attainment in South San Gabriel
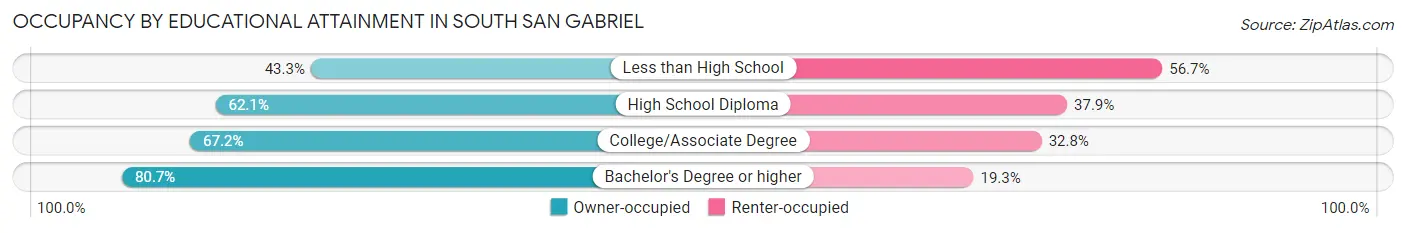
| Household Size | Owner-occupied | Renter-occupied |
| Less than High School | 148 (43.3%) | 194 (56.7%) |
| High School Diploma | 476 (62.1%) | 290 (37.9%) |
| College/Associate Degree | 305 (67.2%) | 149 (32.8%) |
| Bachelor's Degree or higher | 560 (80.7%) | 134 (19.3%) |
Occupancy by Age of Householder in South San Gabriel
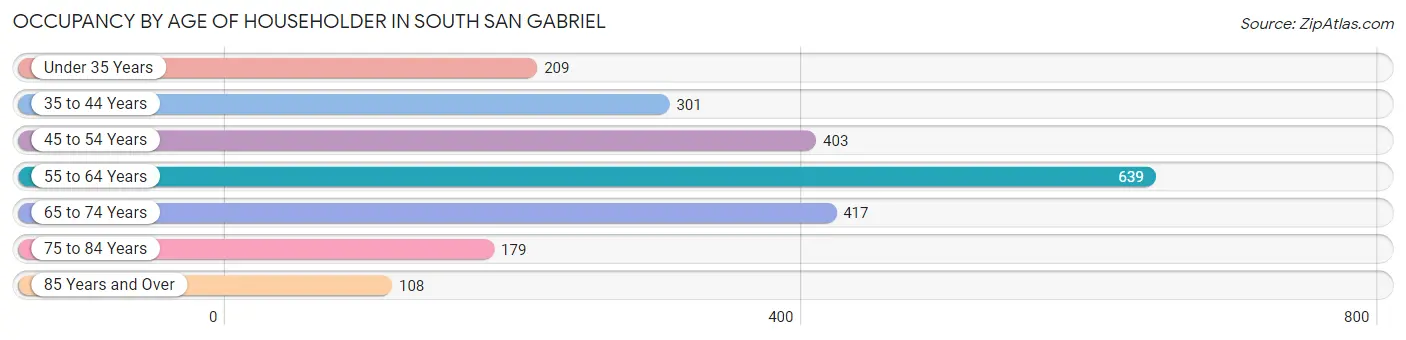
| Age Bracket | # Households | % Households |
| Under 35 Years | 209 | 9.3% |
| 35 to 44 Years | 301 | 13.3% |
| 45 to 54 Years | 403 | 17.9% |
| 55 to 64 Years | 639 | 28.3% |
| 65 to 74 Years | 417 | 18.5% |
| 75 to 84 Years | 179 | 7.9% |
| 85 Years and Over | 108 | 4.8% |
| Total | 2,256 | 100.0% |
Housing Finances in South San Gabriel
Median Income by Occupancy in South San Gabriel
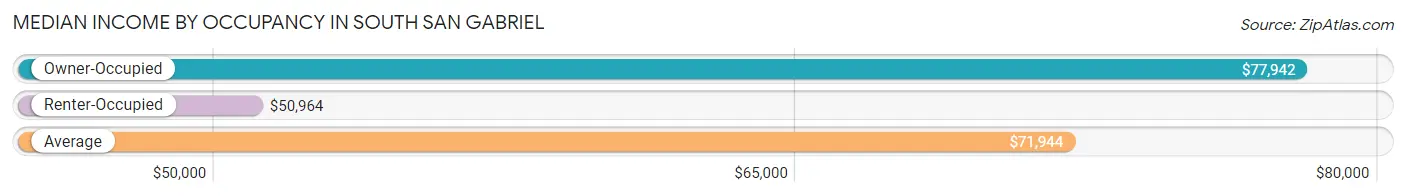
| Occupancy Type | # Households | Median Income |
| Owner-Occupied | 1,489 (66.0%) | $77,942 |
| Renter-Occupied | 767 (34.0%) | $50,964 |
| Average | 2,256 (100.0%) | $71,944 |
Occupancy by Householder Income Bracket in South San Gabriel
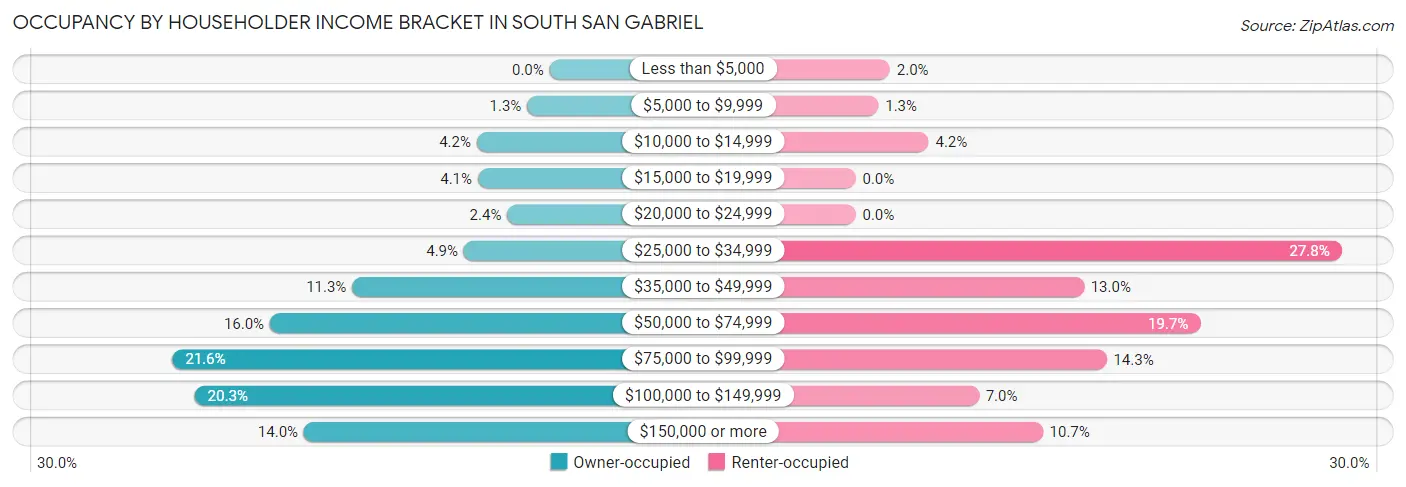
| Income Bracket | Owner-occupied | Renter-occupied |
| Less than $5,000 | 0 (0.0%) | 15 (2.0%) |
| $5,000 to $9,999 | 19 (1.3%) | 10 (1.3%) |
| $10,000 to $14,999 | 62 (4.2%) | 32 (4.2%) |
| $15,000 to $19,999 | 61 (4.1%) | 0 (0.0%) |
| $20,000 to $24,999 | 36 (2.4%) | 0 (0.0%) |
| $25,000 to $34,999 | 73 (4.9%) | 213 (27.8%) |
| $35,000 to $49,999 | 168 (11.3%) | 100 (13.0%) |
| $50,000 to $74,999 | 238 (16.0%) | 151 (19.7%) |
| $75,000 to $99,999 | 321 (21.6%) | 110 (14.3%) |
| $100,000 to $149,999 | 302 (20.3%) | 54 (7.0%) |
| $150,000 or more | 209 (14.0%) | 82 (10.7%) |
| Total | 1,489 (100.0%) | 767 (100.0%) |
Monthly Housing Cost Tiers in South San Gabriel
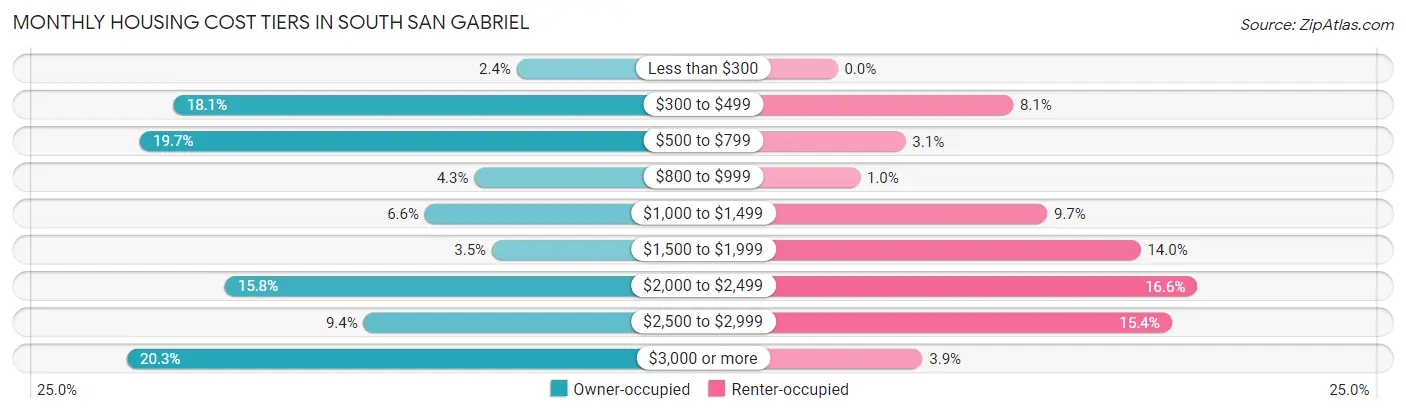
| Monthly Cost | Owner-occupied | Renter-occupied |
| Less than $300 | 35 (2.4%) | 0 (0.0%) |
| $300 to $499 | 270 (18.1%) | 62 (8.1%) |
| $500 to $799 | 293 (19.7%) | 24 (3.1%) |
| $800 to $999 | 64 (4.3%) | 8 (1.0%) |
| $1,000 to $1,499 | 98 (6.6%) | 74 (9.7%) |
| $1,500 to $1,999 | 52 (3.5%) | 107 (14.0%) |
| $2,000 to $2,499 | 235 (15.8%) | 127 (16.6%) |
| $2,500 to $2,999 | 140 (9.4%) | 118 (15.4%) |
| $3,000 or more | 302 (20.3%) | 30 (3.9%) |
| Total | 1,489 (100.0%) | 767 (100.0%) |
Physical Housing Characteristics in South San Gabriel
Housing Structures in South San Gabriel
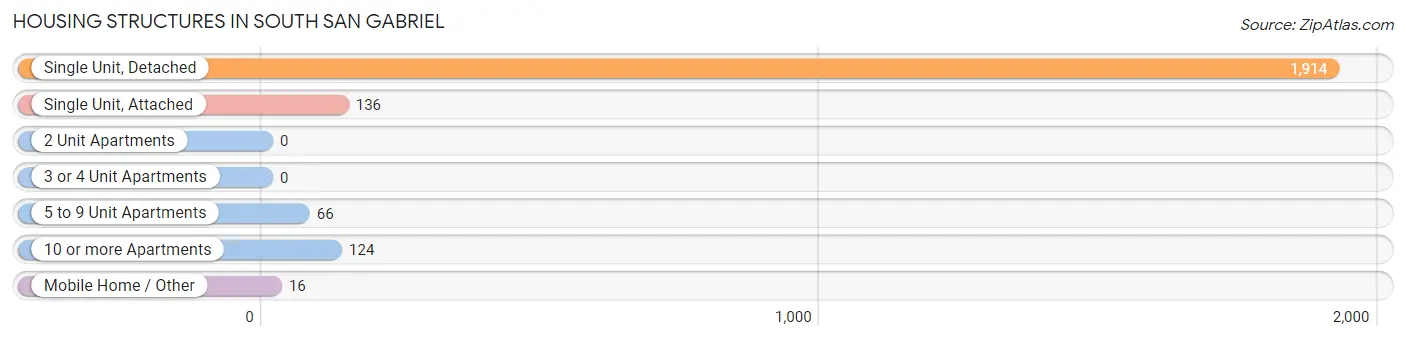
| Structure Type | # Housing Units | % Housing Units |
| Single Unit, Detached | 1,914 | 84.8% |
| Single Unit, Attached | 136 | 6.0% |
| 2 Unit Apartments | 0 | 0.0% |
| 3 or 4 Unit Apartments | 0 | 0.0% |
| 5 to 9 Unit Apartments | 66 | 2.9% |
| 10 or more Apartments | 124 | 5.5% |
| Mobile Home / Other | 16 | 0.7% |
| Total | 2,256 | 100.0% |
Housing Structures by Occupancy in South San Gabriel
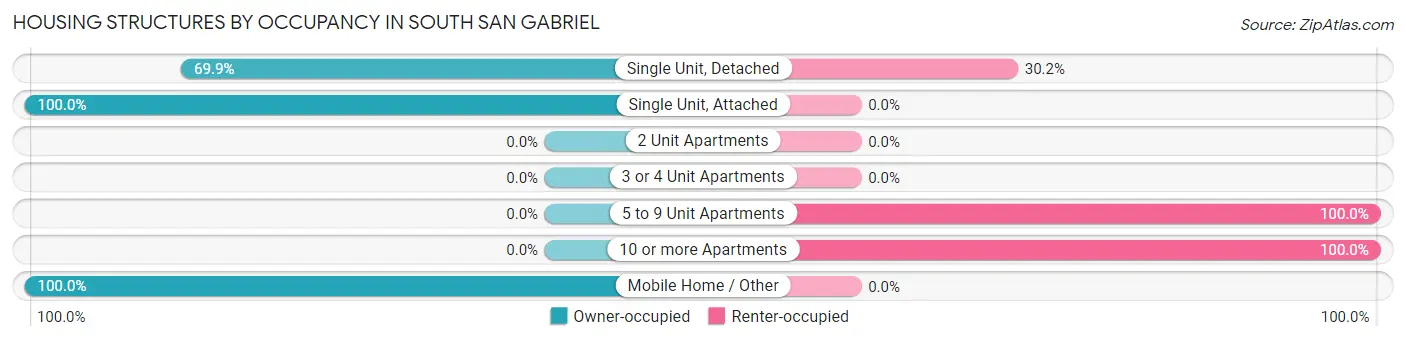
| Structure Type | Owner-occupied | Renter-occupied |
| Single Unit, Detached | 1,337 (69.9%) | 577 (30.1%) |
| Single Unit, Attached | 136 (100.0%) | 0 (0.0%) |
| 2 Unit Apartments | 0 (0.0%) | 0 (0.0%) |
| 3 or 4 Unit Apartments | 0 (0.0%) | 0 (0.0%) |
| 5 to 9 Unit Apartments | 0 (0.0%) | 66 (100.0%) |
| 10 or more Apartments | 0 (0.0%) | 124 (100.0%) |
| Mobile Home / Other | 16 (100.0%) | 0 (0.0%) |
| Total | 1,489 (66.0%) | 767 (34.0%) |
Housing Structures by Number of Rooms in South San Gabriel
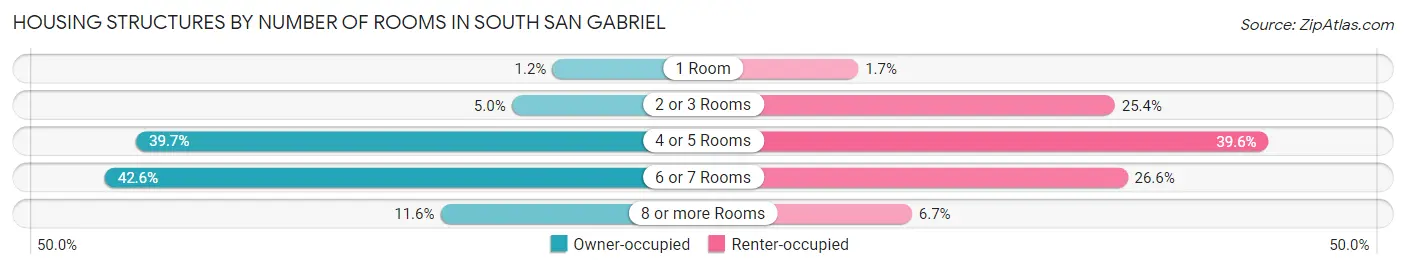
| Number of Rooms | Owner-occupied | Renter-occupied |
| 1 Room | 18 (1.2%) | 13 (1.7%) |
| 2 or 3 Rooms | 74 (5.0%) | 195 (25.4%) |
| 4 or 5 Rooms | 591 (39.7%) | 304 (39.6%) |
| 6 or 7 Rooms | 634 (42.6%) | 204 (26.6%) |
| 8 or more Rooms | 172 (11.6%) | 51 (6.7%) |
| Total | 1,489 (100.0%) | 767 (100.0%) |
Housing Structure by Heating Type in South San Gabriel
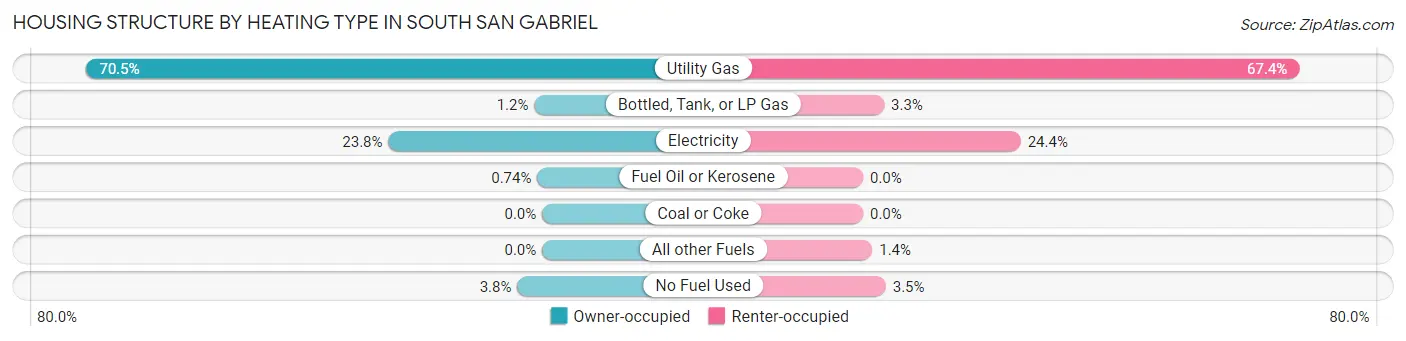
| Heating Type | Owner-occupied | Renter-occupied |
| Utility Gas | 1,049 (70.5%) | 517 (67.4%) |
| Bottled, Tank, or LP Gas | 18 (1.2%) | 25 (3.3%) |
| Electricity | 354 (23.8%) | 187 (24.4%) |
| Fuel Oil or Kerosene | 11 (0.7%) | 0 (0.0%) |
| Coal or Coke | 0 (0.0%) | 0 (0.0%) |
| All other Fuels | 0 (0.0%) | 11 (1.4%) |
| No Fuel Used | 57 (3.8%) | 27 (3.5%) |
| Total | 1,489 (100.0%) | 767 (100.0%) |
Household Vehicle Usage in South San Gabriel
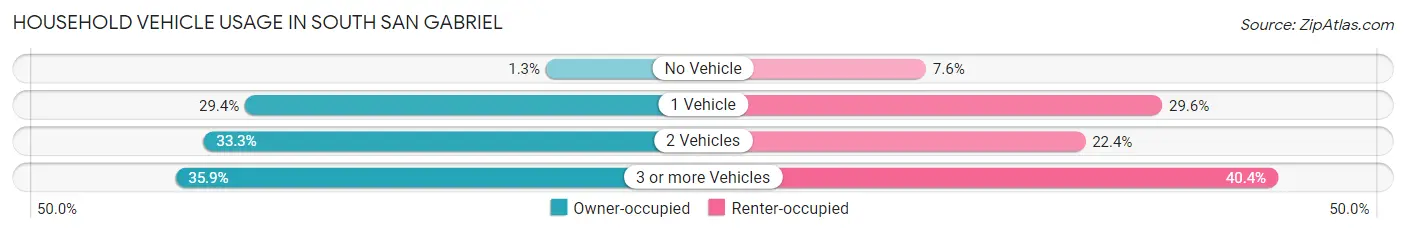
| Vehicles per Household | Owner-occupied | Renter-occupied |
| No Vehicle | 20 (1.3%) | 58 (7.6%) |
| 1 Vehicle | 438 (29.4%) | 227 (29.6%) |
| 2 Vehicles | 496 (33.3%) | 172 (22.4%) |
| 3 or more Vehicles | 535 (35.9%) | 310 (40.4%) |
| Total | 1,489 (100.0%) | 767 (100.0%) |
Real Estate & Mortgages in South San Gabriel
Real Estate and Mortgage Overview in South San Gabriel
| Characteristic | Without Mortgage | With Mortgage |
| Housing Units | 656 | 833 |
| Median Property Value | $567,700 | $675,400 |
| Median Household Income | $59,231 | $166 |
| Monthly Housing Costs | $537 | $302 |
| Real Estate Taxes | $4,272 | $9 |
Property Value by Mortgage Status in South San Gabriel
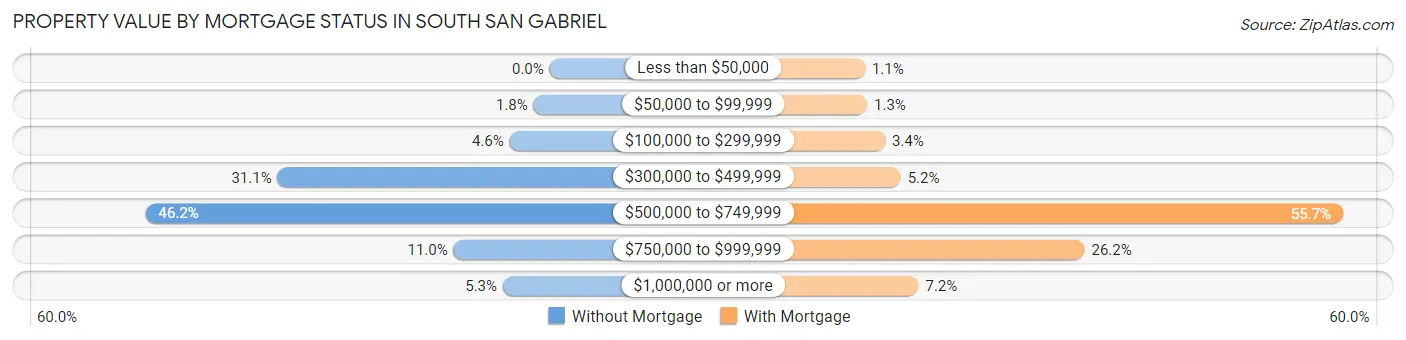
| Property Value | Without Mortgage | With Mortgage |
| Less than $50,000 | 0 (0.0%) | 9 (1.1%) |
| $50,000 to $99,999 | 12 (1.8%) | 11 (1.3%) |
| $100,000 to $299,999 | 30 (4.6%) | 28 (3.4%) |
| $300,000 to $499,999 | 204 (31.1%) | 43 (5.2%) |
| $500,000 to $749,999 | 303 (46.2%) | 464 (55.7%) |
| $750,000 to $999,999 | 72 (11.0%) | 218 (26.2%) |
| $1,000,000 or more | 35 (5.3%) | 60 (7.2%) |
| Total | 656 (100.0%) | 833 (100.0%) |
Household Income by Mortgage Status in South San Gabriel
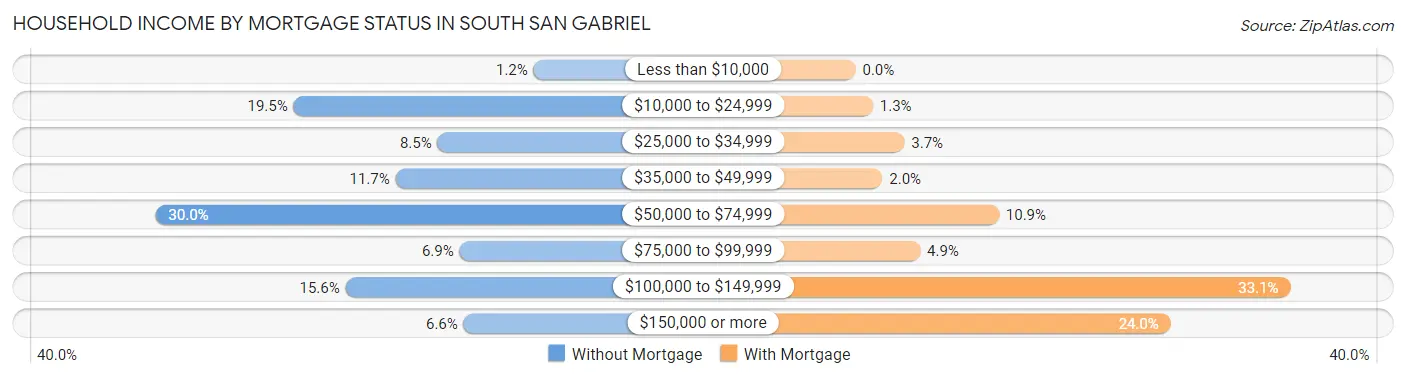
| Household Income | Without Mortgage | With Mortgage |
| Less than $10,000 | 8 (1.2%) | 0 (0.0%) |
| $10,000 to $24,999 | 128 (19.5%) | 11 (1.3%) |
| $25,000 to $34,999 | 56 (8.5%) | 31 (3.7%) |
| $35,000 to $49,999 | 77 (11.7%) | 17 (2.0%) |
| $50,000 to $74,999 | 197 (30.0%) | 91 (10.9%) |
| $75,000 to $99,999 | 45 (6.9%) | 41 (4.9%) |
| $100,000 to $149,999 | 102 (15.5%) | 276 (33.1%) |
| $150,000 or more | 43 (6.6%) | 200 (24.0%) |
| Total | 656 (100.0%) | 833 (100.0%) |
Property Value to Household Income Ratio in South San Gabriel
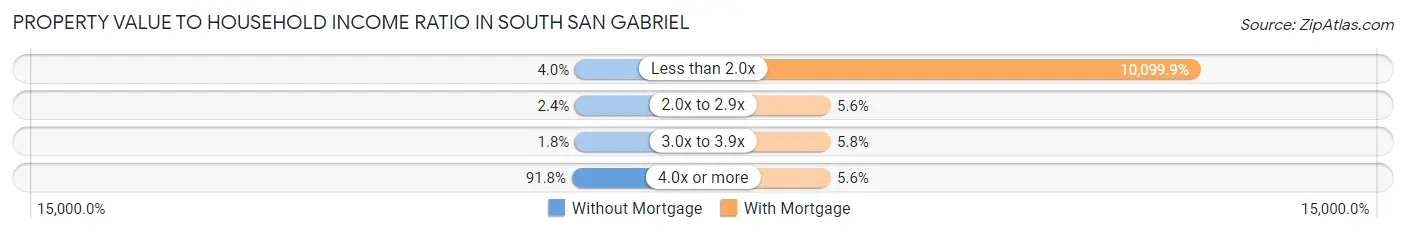
| Value-to-Income Ratio | Without Mortgage | With Mortgage |
| Less than 2.0x | 26 (4.0%) | 84,132 (10,099.9%) |
| 2.0x to 2.9x | 16 (2.4%) | 47 (5.6%) |
| 3.0x to 3.9x | 12 (1.8%) | 48 (5.8%) |
| 4.0x or more | 602 (91.8%) | 47 (5.6%) |
| Total | 656 (100.0%) | 833 (100.0%) |
Real Estate Taxes by Mortgage Status in South San Gabriel
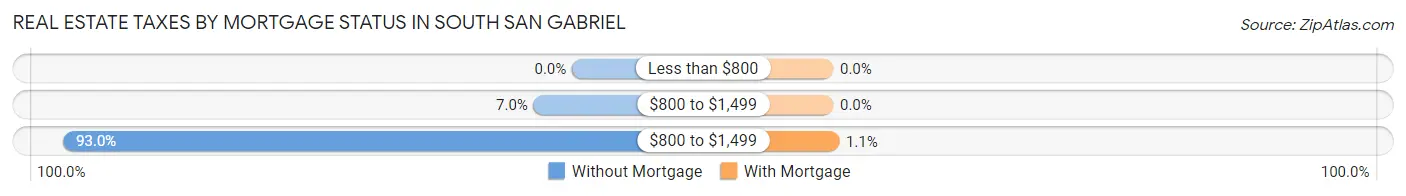
| Property Taxes | Without Mortgage | With Mortgage |
| Less than $800 | 0 (0.0%) | 0 (0.0%) |
| $800 to $1,499 | 46 (7.0%) | 0 (0.0%) |
| $800 to $1,499 | 610 (93.0%) | 9 (1.1%) |
| Total | 656 (100.0%) | 833 (100.0%) |
Health & Disability in South San Gabriel
Health Insurance Coverage by Age in South San Gabriel
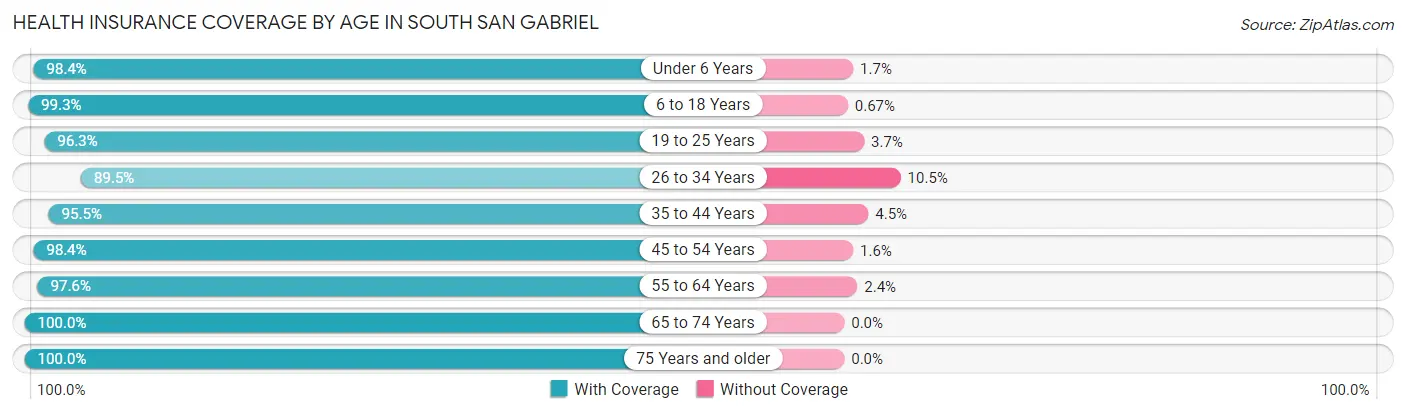
| Age Bracket | With Coverage | Without Coverage |
| Under 6 Years | 536 (98.4%) | 9 (1.7%) |
| 6 to 18 Years | 1,031 (99.3%) | 7 (0.7%) |
| 19 to 25 Years | 418 (96.3%) | 16 (3.7%) |
| 26 to 34 Years | 903 (89.5%) | 106 (10.5%) |
| 35 to 44 Years | 937 (95.5%) | 44 (4.5%) |
| 45 to 54 Years | 718 (98.4%) | 12 (1.6%) |
| 55 to 64 Years | 1,406 (97.6%) | 35 (2.4%) |
| 65 to 74 Years | 781 (100.0%) | 0 (0.0%) |
| 75 Years and older | 614 (100.0%) | 0 (0.0%) |
| Total | 7,344 (97.0%) | 229 (3.0%) |
Health Insurance Coverage by Citizenship Status in South San Gabriel
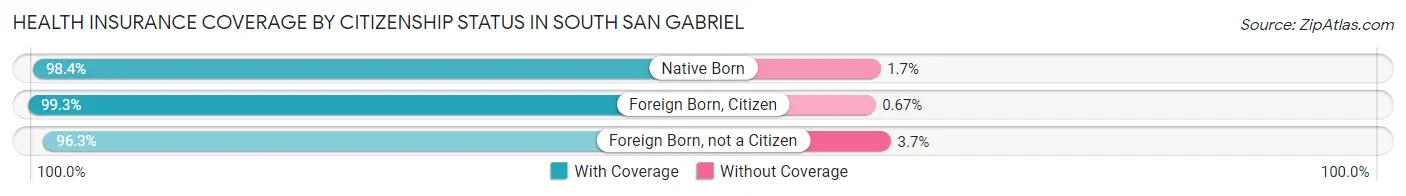
| Citizenship Status | With Coverage | Without Coverage |
| Native Born | 536 (98.4%) | 9 (1.7%) |
| Foreign Born, Citizen | 1,031 (99.3%) | 7 (0.7%) |
| Foreign Born, not a Citizen | 418 (96.3%) | 16 (3.7%) |
Health Insurance Coverage by Household Income in South San Gabriel
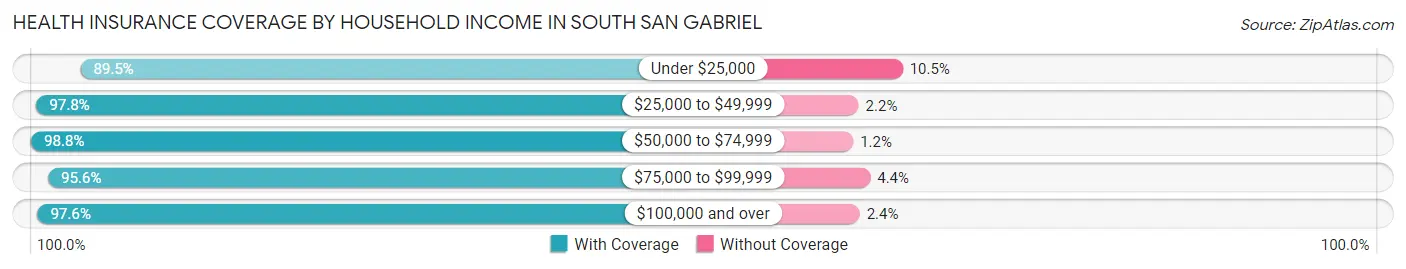
| Household Income | With Coverage | Without Coverage |
| Under $25,000 | 342 (89.5%) | 40 (10.5%) |
| $25,000 to $49,999 | 1,407 (97.8%) | 32 (2.2%) |
| $50,000 to $74,999 | 1,546 (98.8%) | 19 (1.2%) |
| $75,000 to $99,999 | 1,368 (95.6%) | 63 (4.4%) |
| $100,000 and over | 2,664 (97.6%) | 66 (2.4%) |
Public vs Private Health Insurance Coverage by Age in South San Gabriel
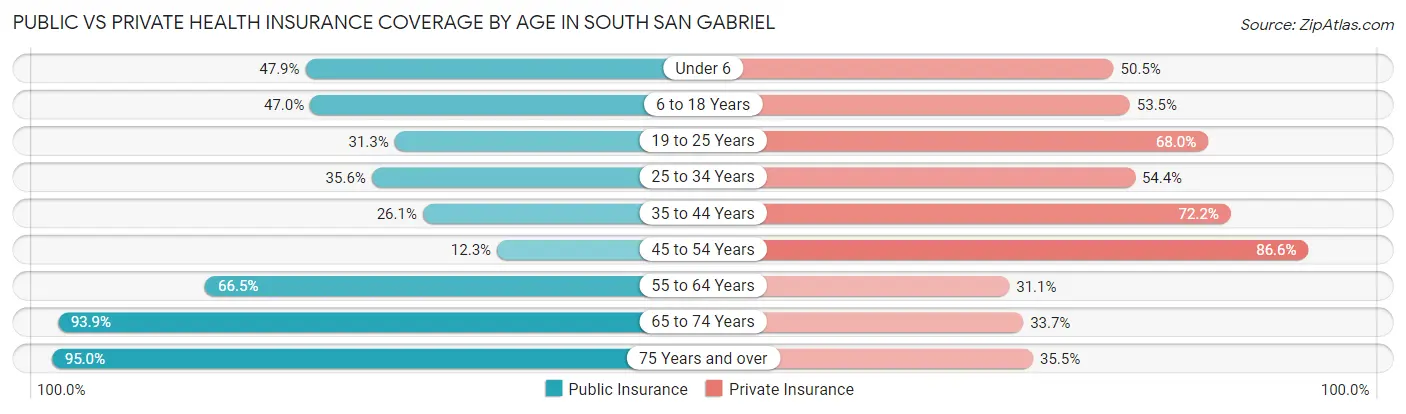
| Age Bracket | Public Insurance | Private Insurance |
| Under 6 | 261 (47.9%) | 275 (50.5%) |
| 6 to 18 Years | 488 (47.0%) | 555 (53.5%) |
| 19 to 25 Years | 136 (31.3%) | 295 (68.0%) |
| 25 to 34 Years | 359 (35.6%) | 549 (54.4%) |
| 35 to 44 Years | 256 (26.1%) | 708 (72.2%) |
| 45 to 54 Years | 90 (12.3%) | 632 (86.6%) |
| 55 to 64 Years | 958 (66.5%) | 448 (31.1%) |
| 65 to 74 Years | 733 (93.9%) | 263 (33.7%) |
| 75 Years and over | 583 (95.0%) | 218 (35.5%) |
| Total | 3,864 (51.0%) | 3,943 (52.1%) |
Disability Status by Sex by Age in South San Gabriel
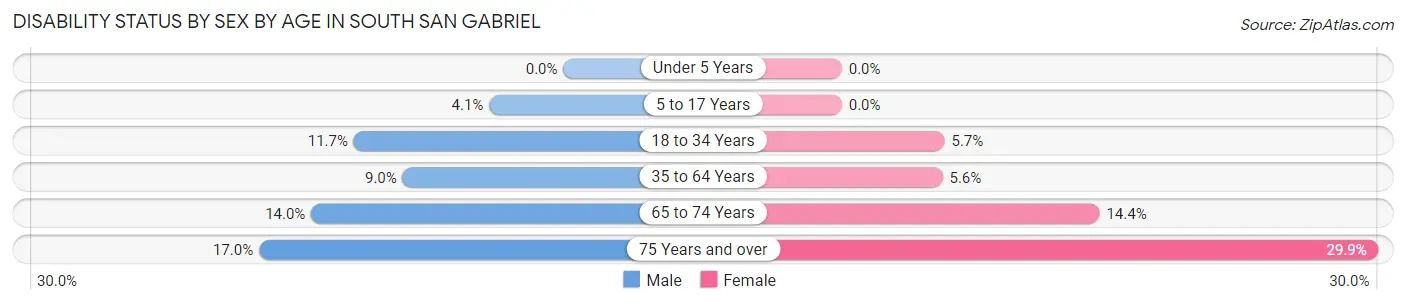
| Age Bracket | Male | Female |
| Under 5 Years | 0 (0.0%) | 0 (0.0%) |
| 5 to 17 Years | 32 (4.1%) | 0 (0.0%) |
| 18 to 34 Years | 91 (11.7%) | 41 (5.7%) |
| 35 to 64 Years | 137 (8.9%) | 91 (5.6%) |
| 65 to 74 Years | 48 (14.0%) | 63 (14.3%) |
| 75 Years and over | 40 (17.0%) | 113 (29.9%) |
Disability Class by Sex by Age in South San Gabriel
Disability Class: Hearing Difficulty
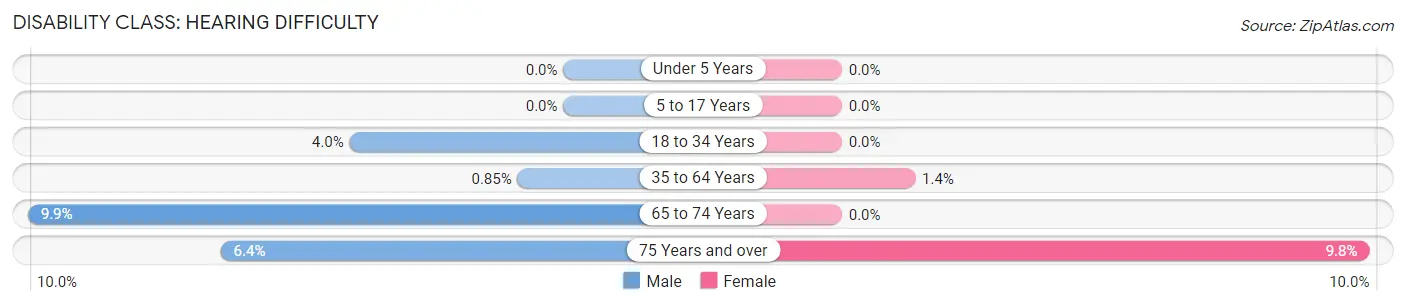
| Age Bracket | Male | Female |
| Under 5 Years | 0 (0.0%) | 0 (0.0%) |
| 5 to 17 Years | 0 (0.0%) | 0 (0.0%) |
| 18 to 34 Years | 31 (4.0%) | 0 (0.0%) |
| 35 to 64 Years | 13 (0.9%) | 22 (1.4%) |
| 65 to 74 Years | 34 (9.9%) | 0 (0.0%) |
| 75 Years and over | 15 (6.4%) | 37 (9.8%) |
Disability Class: Vision Difficulty
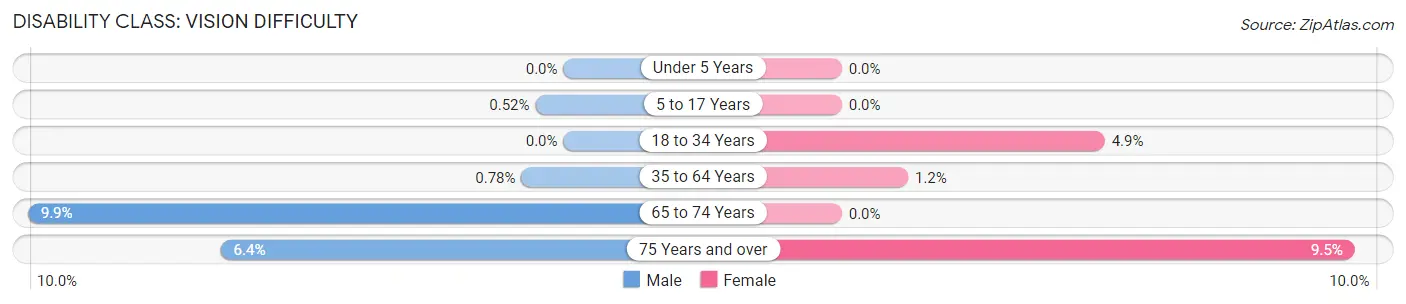
| Age Bracket | Male | Female |
| Under 5 Years | 0 (0.0%) | 0 (0.0%) |
| 5 to 17 Years | 4 (0.5%) | 0 (0.0%) |
| 18 to 34 Years | 0 (0.0%) | 35 (4.9%) |
| 35 to 64 Years | 12 (0.8%) | 20 (1.2%) |
| 65 to 74 Years | 34 (9.9%) | 0 (0.0%) |
| 75 Years and over | 15 (6.4%) | 36 (9.5%) |
Disability Class: Cognitive Difficulty
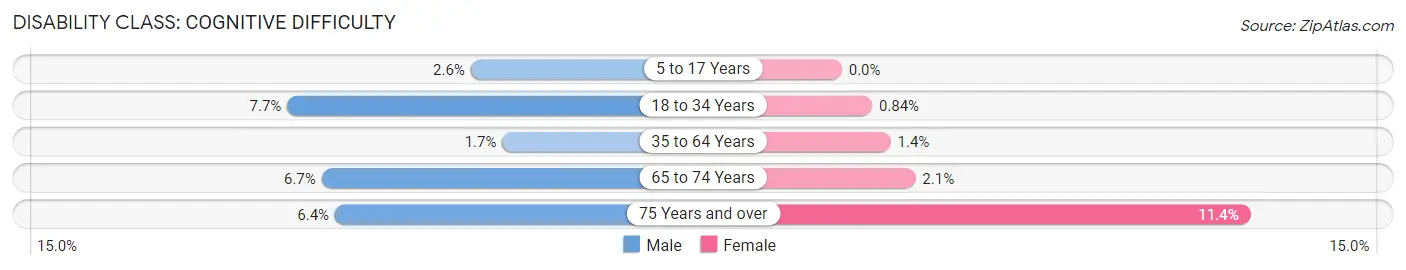
| Age Bracket | Male | Female |
| 5 to 17 Years | 20 (2.6%) | 0 (0.0%) |
| 18 to 34 Years | 60 (7.7%) | 6 (0.8%) |
| 35 to 64 Years | 26 (1.7%) | 22 (1.4%) |
| 65 to 74 Years | 23 (6.7%) | 9 (2.1%) |
| 75 Years and over | 15 (6.4%) | 43 (11.4%) |
Disability Class: Ambulatory Difficulty
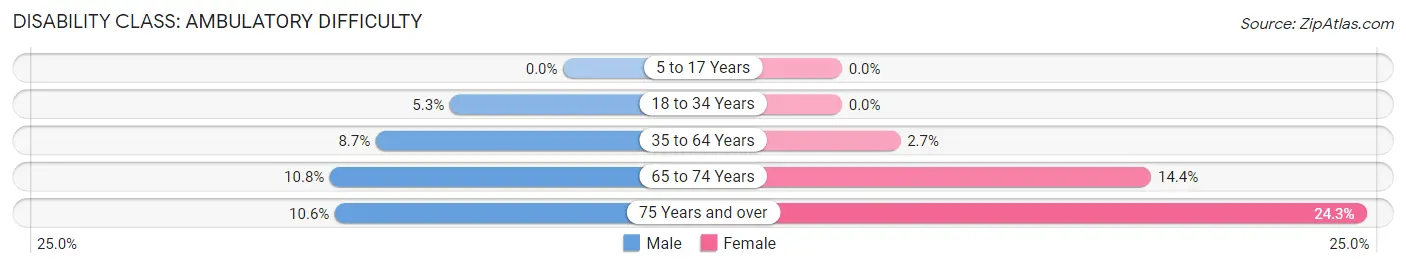
| Age Bracket | Male | Female |
| 5 to 17 Years | 0 (0.0%) | 0 (0.0%) |
| 18 to 34 Years | 41 (5.3%) | 0 (0.0%) |
| 35 to 64 Years | 133 (8.7%) | 44 (2.7%) |
| 65 to 74 Years | 37 (10.8%) | 63 (14.3%) |
| 75 Years and over | 25 (10.6%) | 92 (24.3%) |
Disability Class: Self-Care Difficulty
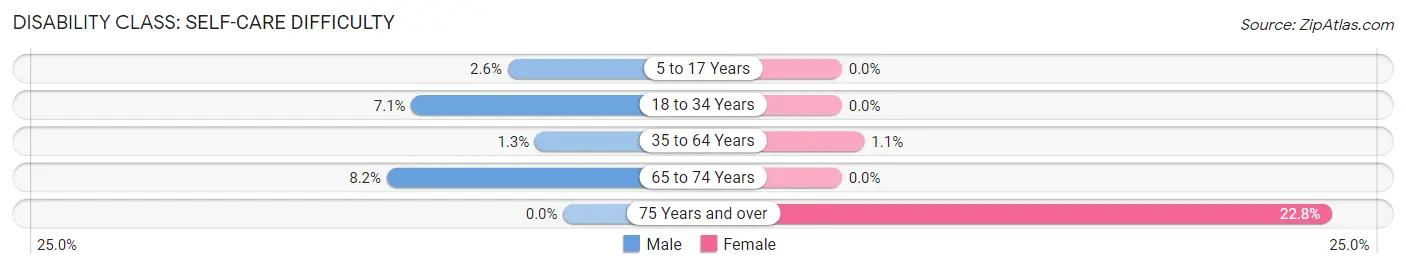
| Age Bracket | Male | Female |
| 5 to 17 Years | 20 (2.6%) | 0 (0.0%) |
| 18 to 34 Years | 55 (7.0%) | 0 (0.0%) |
| 35 to 64 Years | 20 (1.3%) | 17 (1.1%) |
| 65 to 74 Years | 28 (8.2%) | 0 (0.0%) |
| 75 Years and over | 0 (0.0%) | 86 (22.8%) |
Technology Access in South San Gabriel
Computing Device Access in South San Gabriel
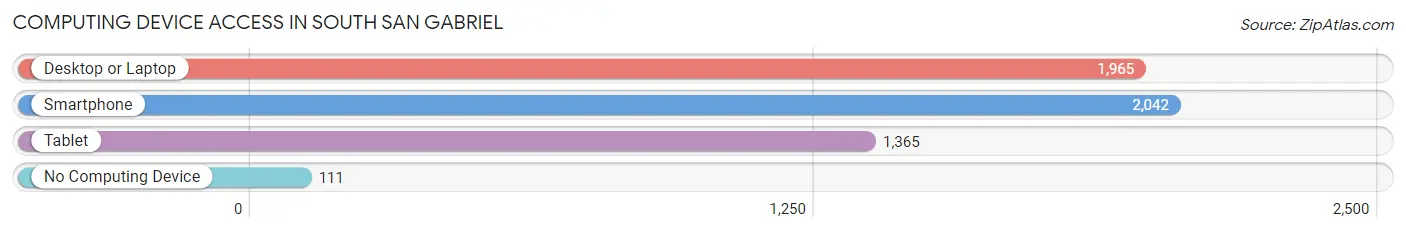
| Device Type | # Households | % Households |
| Desktop or Laptop | 1,965 | 87.1% |
| Smartphone | 2,042 | 90.5% |
| Tablet | 1,365 | 60.5% |
| No Computing Device | 111 | 4.9% |
| Total | 2,256 | 100.0% |
Internet Access in South San Gabriel
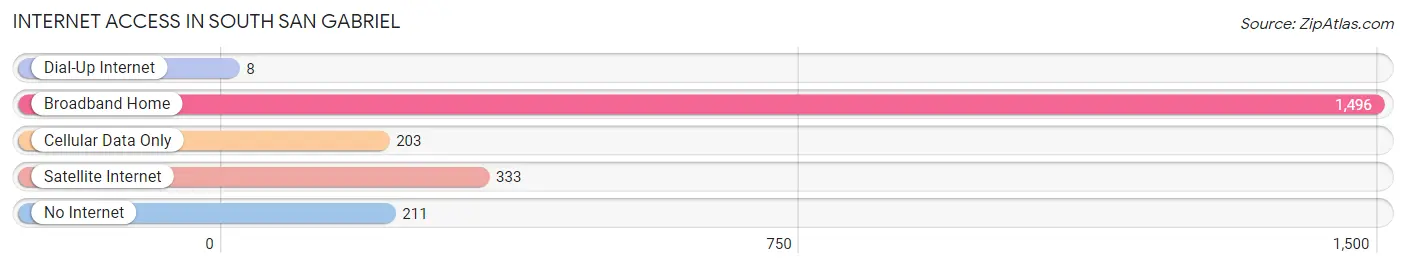
| Internet Type | # Households | % Households |
| Dial-Up Internet | 8 | 0.4% |
| Broadband Home | 1,496 | 66.3% |
| Cellular Data Only | 203 | 9.0% |
| Satellite Internet | 333 | 14.8% |
| No Internet | 211 | 9.3% |
| Total | 2,256 | 100.0% |
South San Gabriel Summary
San Gabriel is a city located in Los Angeles County, California. It is situated in the San Gabriel Valley, approximately 20 miles east of downtown Los Angeles. The city is bordered by the cities of Alhambra, Rosemead, Montebello, and Monterey Park. San Gabriel is home to a population of approximately 40,000 people.
History
The area that is now San Gabriel was originally inhabited by the Tongva people, who were the original inhabitants of the Los Angeles Basin. The Tongva were hunter-gatherers who lived in small villages and subsisted on the abundant natural resources of the area. The first Europeans to arrive in the area were Spanish missionaries, who established the Mission San Gabriel Arcángel in 1771. The mission was the fourth of the 21 missions established by the Spanish in California. The mission was the center of the local economy and served as a hub for the surrounding communities.
In 1852, the area was incorporated as the City of San Gabriel. The city was named after the mission, which was named after the Archangel Gabriel. During the late 19th century, the city experienced a period of growth and development, as the population increased and new businesses were established. The city was also home to a number of prominent families, including the Pico family, who were influential in the development of the city.
Geography
San Gabriel is located in the San Gabriel Valley, which is a region of Los Angeles County. The city is situated at the base of the San Gabriel Mountains, which are part of the Transverse Ranges. The city is bordered by the cities of Alhambra, Rosemead, Montebello, and Monterey Park. The city covers an area of 8.3 square miles and has a population density of 4,845 people per square mile.
The climate in San Gabriel is classified as a Mediterranean climate, which is characterized by warm, dry summers and mild, wet winters. The average temperature in the city is 68 degrees Fahrenheit, with an average high of 79 degrees and an average low of 57 degrees. The average annual precipitation in the city is 15.5 inches.
Economy
San Gabriel is home to a diverse economy, with a variety of industries represented in the city. The largest employers in the city are the San Gabriel Unified School District, the City of San Gabriel, and the San Gabriel Valley Medical Center. Other major employers in the city include the San Gabriel Valley Tribune, the San Gabriel Valley Water Company, and the San Gabriel Valley Regional Medical Center.
The city is also home to a number of retail and commercial businesses, including a number of restaurants, shops, and other businesses. The city is also home to a number of industrial businesses, including a number of manufacturing and distribution companies.
Demographics
As of the 2010 census, the population of San Gabriel was 39,718. The racial makeup of the city was 57.3% White, 1.3% African American, 0.7% Native American, 25.2% Asian, 0.2% Pacific Islander, 11.2% from other races, and 4.2% from two or more races. The median household income in the city was $60,945, and the median family income was $68,824. The per capita income in the city was $27,845.
San Gabriel is home to a diverse population, with a variety of ethnic and cultural backgrounds represented in the city. The city is home to a large Asian population, with the largest ethnic groups being Chinese, Filipino, and Vietnamese. The city is also home to a large Hispanic population, with the largest ethnic groups being Mexican and Salvadoran.
Common Questions
What is Per Capita Income in South San Gabriel?
Per Capita income in South San Gabriel is $25,448.
What is the Median Family Income in South San Gabriel?
Median Family Income in South San Gabriel is $75,357.
What is the Median Household income in South San Gabriel?
Median Household Income in South San Gabriel is $71,944.
What is Income or Wage Gap in South San Gabriel?
Income or Wage Gap in South San Gabriel is 25.2%.
Women in South San Gabriel earn 74.8 cents for every dollar earned by a man.
What is Inequality or Gini Index in South San Gabriel?
Inequality or Gini Index in South San Gabriel is 0.39.
What is the Total Population of South San Gabriel?
Total Population of South San Gabriel is 7,786.
What is the Total Male Population of South San Gabriel?
Total Male Population of South San Gabriel is 3,937.
What is the Total Female Population of South San Gabriel?
Total Female Population of South San Gabriel is 3,849.
What is the Ratio of Males per 100 Females in South San Gabriel?
There are 102.29 Males per 100 Females in South San Gabriel.
What is the Ratio of Females per 100 Males in South San Gabriel?
There are 97.76 Females per 100 Males in South San Gabriel.
What is the Median Population Age in South San Gabriel?
Median Population Age in South San Gabriel is 43.5 Years.
What is the Average Family Size in South San Gabriel
Average Family Size in South San Gabriel is 3.7 People.
What is the Average Household Size in South San Gabriel
Average Household Size in South San Gabriel is 3.4 People.
How Large is the Labor Force in South San Gabriel?
There are 3,849 People in the Labor Forcein in South San Gabriel.
What is the Percentage of People in the Labor Force in South San Gabriel?
58.2% of People are in the Labor Force in South San Gabriel.
What is the Unemployment Rate in South San Gabriel?
Unemployment Rate in South San Gabriel is 5.4%.