Cities with the Lowest Child Poverty Level Among Boys Under the Age of 16 in Indiana
RELATED REPORTS & OPTIONS
Lowest Poverty | Boys 0-16
Indiana
Compare Cities
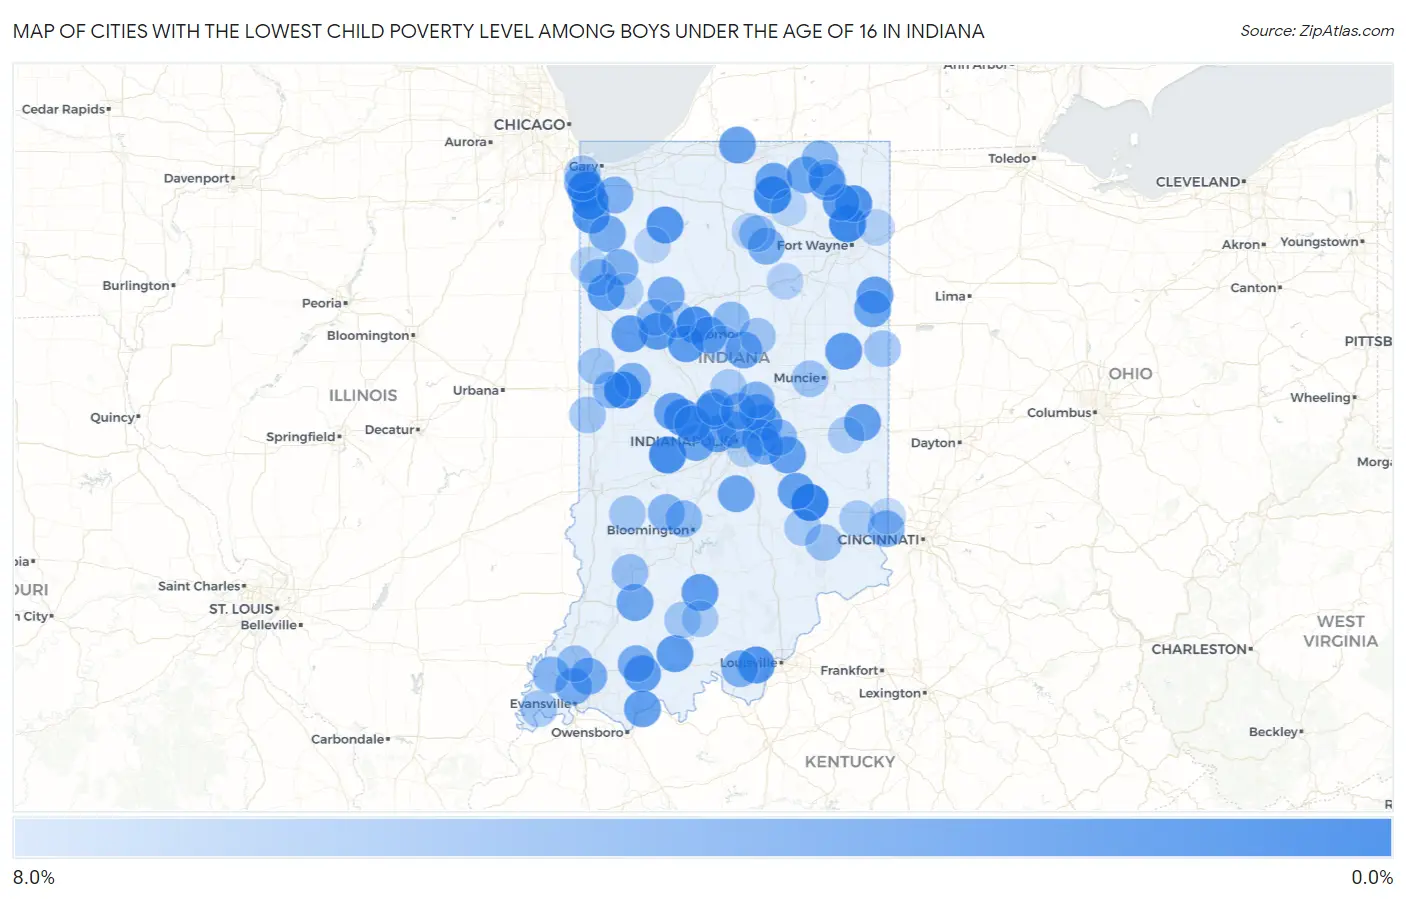
Map of Cities with the Lowest Child Poverty Level Among Boys Under the Age of 16 in Indiana
8.0%
0.0%
Cities with the Lowest Child Poverty Level Among Boys Under the Age of 16 in Indiana
| City | Child Poverty (Boys) | vs State | vs National | |
| 1. | Greensburg | 0.41% | 16.3%(-15.9)#1 | 16.9%(-16.5)#21 |
| 2. | St John | 0.66% | 16.3%(-15.7)#2 | 16.9%(-16.2)#69 |
| 3. | Huntertown | 0.93% | 16.3%(-15.4)#3 | 16.9%(-16.0)#148 |
| 4. | Hillsboro | 0.97% | 16.3%(-15.4)#4 | 16.9%(-15.9)#160 |
| 5. | Milford | 1.0% | 16.3%(-15.3)#5 | 16.9%(-15.9)#171 |
| 6. | Fillmore | 1.3% | 16.3%(-15.1)#6 | 16.9%(-15.6)#289 |
| 7. | Flora | 1.6% | 16.3%(-14.7)#7 | 16.9%(-15.3)#404 |
| 8. | Garrett | 1.8% | 16.3%(-14.6)#8 | 16.9%(-15.1)#510 |
| 9. | Jamestown | 1.9% | 16.3%(-14.4)#9 | 16.9%(-15.0)#582 |
| 10. | Lowell | 1.9% | 16.3%(-14.4)#10 | 16.9%(-15.0)#589 |
| 11. | Cedar Lake | 2.0% | 16.3%(-14.4)#11 | 16.9%(-14.9)#604 |
| 12. | Lanesville | 2.0% | 16.3%(-14.3)#12 | 16.9%(-14.9)#641 |
| 13. | North Judson | 2.1% | 16.3%(-14.2)#13 | 16.9%(-14.8)#677 |
| 14. | Battle Ground | 2.3% | 16.3%(-14.0)#14 | 16.9%(-14.6)#820 |
| 15. | Clermont | 2.4% | 16.3%(-13.9)#15 | 16.9%(-14.5)#884 |
| 16. | Goodland | 2.5% | 16.3%(-13.8)#16 | 16.9%(-14.4)#927 |
| 17. | Rossville | 2.5% | 16.3%(-13.8)#17 | 16.9%(-14.4)#949 |
| 18. | Avilla | 2.6% | 16.3%(-13.8)#18 | 16.9%(-14.3)#959 |
| 19. | Birdseye | 2.6% | 16.3%(-13.7)#19 | 16.9%(-14.3)#1,006 |
| 20. | Dale | 2.7% | 16.3%(-13.7)#20 | 16.9%(-14.2)#1,022 |
| 21. | Otterbein | 2.7% | 16.3%(-13.7)#21 | 16.9%(-14.2)#1,023 |
| 22. | Dunkirk | 2.7% | 16.3%(-13.7)#22 | 16.9%(-14.2)#1,031 |
| 23. | Mitchell | 2.8% | 16.3%(-13.6)#23 | 16.9%(-14.1)#1,078 |
| 24. | Grandview | 2.8% | 16.3%(-13.6)#24 | 16.9%(-14.1)#1,090 |
| 25. | Morristown | 3.0% | 16.3%(-13.3)#25 | 16.9%(-13.9)#1,226 |
| 26. | Greens Fork | 3.0% | 16.3%(-13.3)#26 | 16.9%(-13.9)#1,254 |
| 27. | Monroe | 3.1% | 16.3%(-13.3)#27 | 16.9%(-13.8)#1,272 |
| 28. | Granger | 3.1% | 16.3%(-13.2)#28 | 16.9%(-13.8)#1,311 |
| 29. | St Paul | 3.1% | 16.3%(-13.2)#29 | 16.9%(-13.8)#1,316 |
| 30. | Rocky Ripple | 3.2% | 16.3%(-13.1)#30 | 16.9%(-13.7)#1,374 |
| 31. | New Ross | 3.2% | 16.3%(-13.1)#31 | 16.9%(-13.7)#1,376 |
| 32. | Rome City | 3.3% | 16.3%(-13.0)#32 | 16.9%(-13.6)#1,421 |
| 33. | New Paris | 3.4% | 16.3%(-13.0)#33 | 16.9%(-13.6)#1,460 |
| 34. | Whitestown | 3.4% | 16.3%(-13.0)#34 | 16.9%(-13.5)#1,465 |
| 35. | Mccordsville | 3.4% | 16.3%(-13.0)#35 | 16.9%(-13.5)#1,474 |
| 36. | Topeka | 3.4% | 16.3%(-12.9)#36 | 16.9%(-13.5)#1,500 |
| 37. | Berne | 3.5% | 16.3%(-12.9)#37 | 16.9%(-13.4)#1,526 |
| 38. | Fishers | 3.5% | 16.3%(-12.9)#38 | 16.9%(-13.4)#1,528 |
| 39. | Danville | 3.5% | 16.3%(-12.9)#39 | 16.9%(-13.4)#1,534 |
| 40. | Lizton | 3.5% | 16.3%(-12.8)#40 | 16.9%(-13.4)#1,550 |
| 41. | Burlington | 3.5% | 16.3%(-12.8)#41 | 16.9%(-13.4)#1,551 |
| 42. | Montgomery | 3.6% | 16.3%(-12.8)#42 | 16.9%(-13.3)#1,580 |
| 43. | Sharpsville | 3.6% | 16.3%(-12.8)#43 | 16.9%(-13.3)#1,584 |
| 44. | Trafalgar | 3.6% | 16.3%(-12.7)#44 | 16.9%(-13.3)#1,601 |
| 45. | Zionsville | 3.8% | 16.3%(-12.6)#45 | 16.9%(-13.1)#1,702 |
| 46. | Cumberland | 3.8% | 16.3%(-12.5)#46 | 16.9%(-13.1)#1,715 |
| 47. | New Palestine | 3.9% | 16.3%(-12.4)#47 | 16.9%(-13.0)#1,763 |
| 48. | Monticello | 4.0% | 16.3%(-12.3)#48 | 16.9%(-12.9)#1,849 |
| 49. | Elberfeld | 4.1% | 16.3%(-12.3)#49 | 16.9%(-12.8)#1,872 |
| 50. | Holland | 4.1% | 16.3%(-12.3)#50 | 16.9%(-12.8)#1,874 |
| 51. | Darmstadt | 4.1% | 16.3%(-12.2)#51 | 16.9%(-12.8)#1,880 |
| 52. | Dyer | 4.1% | 16.3%(-12.2)#52 | 16.9%(-12.8)#1,884 |
| 53. | Roselawn | 4.2% | 16.3%(-12.2)#53 | 16.9%(-12.8)#1,892 |
| 54. | Carmel | 4.3% | 16.3%(-12.0)#54 | 16.9%(-12.6)#2,013 |
| 55. | Silver Lake | 4.3% | 16.3%(-12.0)#55 | 16.9%(-12.6)#2,020 |
| 56. | Corydon | 4.4% | 16.3%(-12.0)#56 | 16.9%(-12.5)#2,035 |
| 57. | Rensselaer | 4.5% | 16.3%(-11.8)#57 | 16.9%(-12.4)#2,106 |
| 58. | Hidden Valley | 4.5% | 16.3%(-11.8)#58 | 16.9%(-12.4)#2,109 |
| 59. | Lakes Of The Four Seasons | 4.5% | 16.3%(-11.8)#59 | 16.9%(-12.4)#2,122 |
| 60. | Wingate | 4.5% | 16.3%(-11.8)#60 | 16.9%(-12.4)#2,139 |
| 61. | Noblesville | 4.7% | 16.3%(-11.7)#61 | 16.9%(-12.2)#2,208 |
| 62. | Veedersburg | 4.8% | 16.3%(-11.5)#62 | 16.9%(-12.1)#2,297 |
| 63. | Poseyville | 5.0% | 16.3%(-11.3)#63 | 16.9%(-11.9)#2,384 |
| 64. | Spencer | 5.0% | 16.3%(-11.3)#64 | 16.9%(-11.9)#2,417 |
| 65. | Galveston | 5.2% | 16.3%(-11.1)#65 | 16.9%(-11.7)#2,535 |
| 66. | Ellettsville | 5.3% | 16.3%(-11.0)#66 | 16.9%(-11.6)#2,592 |
| 67. | Lagrange | 5.3% | 16.3%(-11.0)#67 | 16.9%(-11.6)#2,595 |
| 68. | Greenfield | 5.4% | 16.3%(-11.0)#68 | 16.9%(-11.6)#2,622 |
| 69. | Brook | 5.5% | 16.3%(-10.9)#69 | 16.9%(-11.4)#2,713 |
| 70. | Brookston | 5.5% | 16.3%(-10.8)#70 | 16.9%(-11.4)#2,726 |
| 71. | Burket | 5.6% | 16.3%(-10.8)#71 | 16.9%(-11.3)#2,758 |
| 72. | Fort Branch | 5.9% | 16.3%(-10.5)#72 | 16.9%(-11.1)#2,924 |
| 73. | Elnora | 5.9% | 16.3%(-10.5)#73 | 16.9%(-11.0)#2,943 |
| 74. | Holton | 6.0% | 16.3%(-10.3)#74 | 16.9%(-10.9)#3,020 |
| 75. | Yorktown | 6.2% | 16.3%(-10.1)#75 | 16.9%(-10.7)#3,131 |
| 76. | West Lebanon | 6.2% | 16.3%(-10.1)#76 | 16.9%(-10.7)#3,147 |
| 77. | Salamonia | 6.2% | 16.3%(-10.1)#77 | 16.9%(-10.7)#3,166 |
| 78. | Greentown | 6.4% | 16.3%(-9.96)#78 | 16.9%(-10.5)#3,238 |
| 79. | Cayuga | 6.4% | 16.3%(-9.95)#79 | 16.9%(-10.5)#3,247 |
| 80. | Mount Vernon | 6.5% | 16.3%(-9.86)#80 | 16.9%(-10.4)#3,303 |
| 81. | Clay City | 6.5% | 16.3%(-9.79)#81 | 16.9%(-10.4)#3,347 |
| 82. | Wolcottville | 6.6% | 16.3%(-9.78)#82 | 16.9%(-10.3)#3,354 |
| 83. | Munster | 6.6% | 16.3%(-9.76)#83 | 16.9%(-10.3)#3,365 |
| 84. | Westport | 6.6% | 16.3%(-9.76)#84 | 16.9%(-10.3)#3,366 |
| 85. | French Lick | 6.6% | 16.3%(-9.75)#85 | 16.9%(-10.3)#3,372 |
| 86. | Sheridan | 6.7% | 16.3%(-9.67)#86 | 16.9%(-10.2)#3,395 |
| 87. | Sunman | 6.8% | 16.3%(-9.52)#87 | 16.9%(-10.1)#3,497 |
| 88. | Paoli | 6.9% | 16.3%(-9.44)#88 | 16.9%(-10.0)#3,540 |
| 89. | Mount Auburn | 7.1% | 16.3%(-9.19)#89 | 16.9%(-9.76)#3,711 |
| 90. | Delphi | 7.3% | 16.3%(-9.04)#90 | 16.9%(-9.61)#3,784 |
| 91. | Remington | 7.3% | 16.3%(-9.01)#91 | 16.9%(-9.57)#3,802 |
| 92. | Beech Grove | 7.4% | 16.3%(-8.97)#92 | 16.9%(-9.54)#3,815 |
| 93. | Harlan | 7.4% | 16.3%(-8.93)#93 | 16.9%(-9.50)#3,835 |
| 94. | Lagro | 7.4% | 16.3%(-8.93)#94 | 16.9%(-9.50)#3,845 |
| 95. | North Webster | 7.5% | 16.3%(-8.81)#95 | 16.9%(-9.38)#3,905 |
| 96. | Russiaville | 7.6% | 16.3%(-8.77)#96 | 16.9%(-9.34)#3,919 |
| 97. | Morocco | 7.6% | 16.3%(-8.77)#97 | 16.9%(-9.34)#3,920 |
| 98. | Mentone | 7.7% | 16.3%(-8.64)#98 | 16.9%(-9.21)#3,991 |
| 99. | Medaryville | 7.7% | 16.3%(-8.64)#99 | 16.9%(-9.21)#3,993 |
| 100. | West Harrison | 7.7% | 16.3%(-8.64)#100 | 16.9%(-9.21)#4,011 |
Common Questions
What are the Top 10 Cities with the Lowest Child Poverty Level Among Boys Under the Age of 16 in Indiana?
Top 10 Cities with the Lowest Child Poverty Level Among Boys Under the Age of 16 in Indiana are:
#1
0.41%
#2
0.66%
#3
0.93%
#4
0.97%
#5
1.0%
#6
1.3%
#7
1.6%
#8
1.8%
#9
1.9%
#10
1.9%
What city has the Lowest Child Poverty Level Among Boys Under the Age of 16 in Indiana?
Greensburg has the Lowest Child Poverty Level Among Boys Under the Age of 16 in Indiana with 0.41%.
What is the Poverty Level Among Boys Under the Age of 16 in the State of Indiana?
Poverty Level Among Boys Under the Age of 16 in Indiana is 16.3%.
What is the Poverty Level Among Boys Under the Age of 16 in the United States?
Poverty Level Among Boys Under the Age of 16 in the United States is 16.9%.