Cities with the Lowest Child Poverty Level Among Boys Under the Age of 16 in Florida
RELATED REPORTS & OPTIONS
Lowest Poverty | Boys 0-16
Florida
Compare Cities
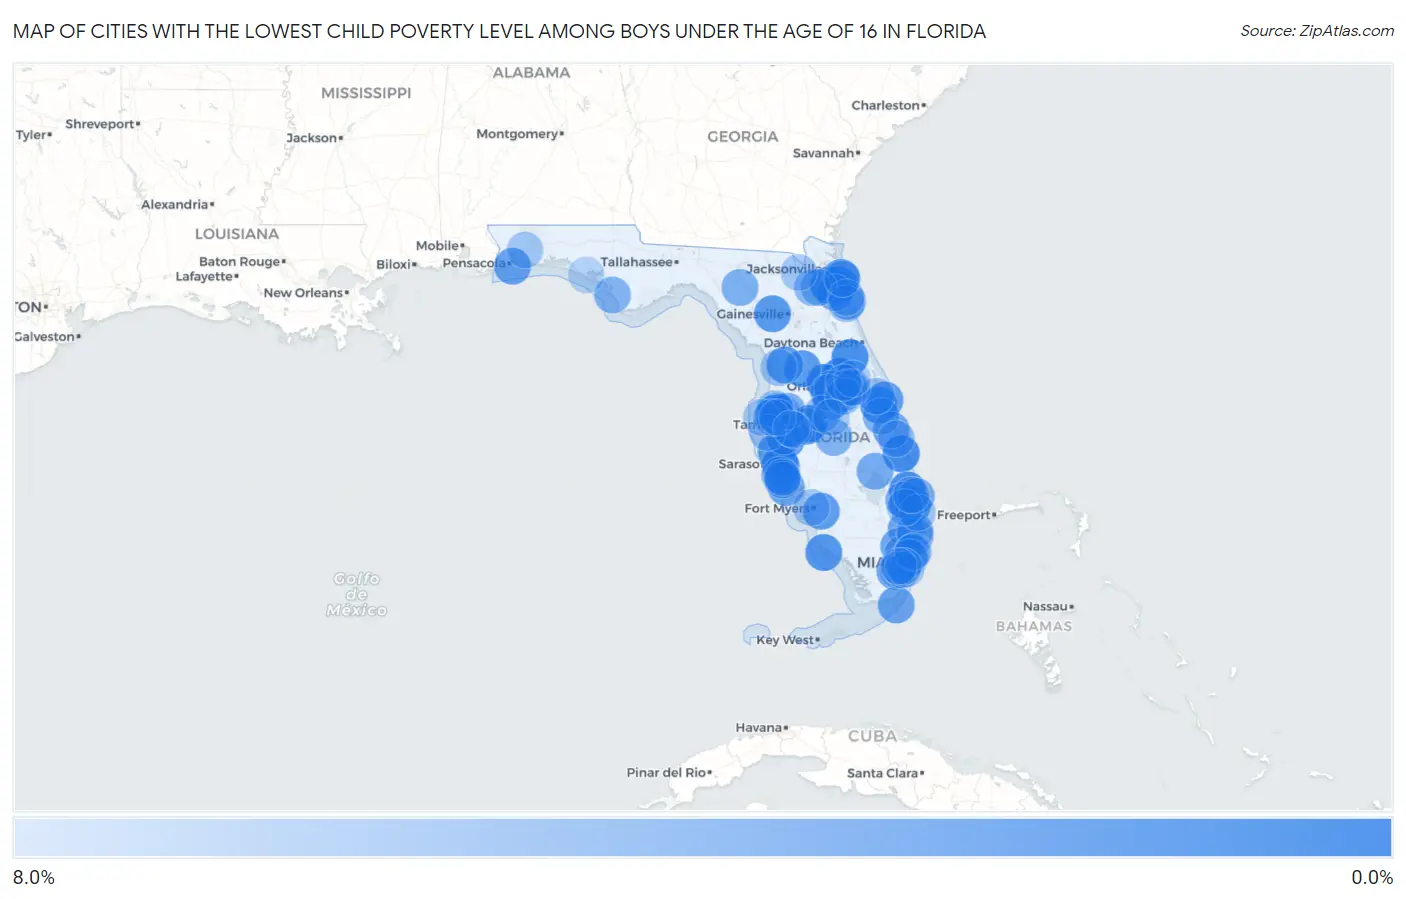
Map of Cities with the Lowest Child Poverty Level Among Boys Under the Age of 16 in Florida
8.0%
0.0%
Cities with the Lowest Child Poverty Level Among Boys Under the Age of 16 in Florida
| City | Child Poverty (Boys) | vs State | vs National | |
| 1. | Northdale | 0.32% | 18.0%(-17.7)#1 | 16.9%(-16.6)#12 |
| 2. | Lakeland Highlands | 0.59% | 18.0%(-17.4)#2 | 16.9%(-16.3)#54 |
| 3. | Wekiwa Springs | 0.62% | 18.0%(-17.4)#3 | 16.9%(-16.3)#61 |
| 4. | Montverde | 0.82% | 18.0%(-17.2)#4 | 16.9%(-16.1)#117 |
| 5. | Fruit Cove | 0.87% | 18.0%(-17.1)#5 | 16.9%(-16.0)#125 |
| 6. | St Lucie Village | 0.99% | 18.0%(-17.0)#6 | 16.9%(-15.9)#165 |
| 7. | Celebration | 1.1% | 18.0%(-16.9)#7 | 16.9%(-15.8)#221 |
| 8. | Jupiter Farms | 1.2% | 18.0%(-16.8)#8 | 16.9%(-15.7)#232 |
| 9. | Lake Helen | 1.2% | 18.0%(-16.8)#9 | 16.9%(-15.7)#237 |
| 10. | Viera West | 1.2% | 18.0%(-16.8)#10 | 16.9%(-15.7)#239 |
| 11. | Nocatee | 1.2% | 18.0%(-16.8)#11 | 16.9%(-15.7)#240 |
| 12. | Palm Valley | 1.2% | 18.0%(-16.8)#12 | 16.9%(-15.7)#263 |
| 13. | Keystone | 1.3% | 18.0%(-16.7)#13 | 16.9%(-15.6)#281 |
| 14. | Vero Lake Estates | 1.4% | 18.0%(-16.6)#14 | 16.9%(-15.5)#346 |
| 15. | Royal Palm Beach | 1.5% | 18.0%(-16.5)#15 | 16.9%(-15.4)#370 |
| 16. | Windermere | 1.6% | 18.0%(-16.4)#16 | 16.9%(-15.3)#412 |
| 17. | Lake Belvedere Estates | 1.7% | 18.0%(-16.3)#17 | 16.9%(-15.2)#438 |
| 18. | Marco Island | 1.7% | 18.0%(-16.3)#18 | 16.9%(-15.2)#469 |
| 19. | Lake Sarasota | 1.7% | 18.0%(-16.3)#19 | 16.9%(-15.2)#471 |
| 20. | Newberry | 1.8% | 18.0%(-16.2)#20 | 16.9%(-15.1)#543 |
| 21. | Coleman | 1.9% | 18.0%(-16.1)#21 | 16.9%(-15.0)#596 |
| 22. | Ellenton | 2.0% | 18.0%(-16.0)#22 | 16.9%(-14.9)#647 |
| 23. | Inverness Highlands North | 2.0% | 18.0%(-16.0)#23 | 16.9%(-14.9)#651 |
| 24. | Gateway | 2.1% | 18.0%(-15.9)#24 | 16.9%(-14.8)#715 |
| 25. | Cocoa Beach | 2.2% | 18.0%(-15.8)#25 | 16.9%(-14.7)#758 |
| 26. | Rio Pinar | 2.2% | 18.0%(-15.8)#26 | 16.9%(-14.7)#778 |
| 27. | Sun City Center | 2.2% | 18.0%(-15.8)#27 | 16.9%(-14.7)#784 |
| 28. | Country Walk | 2.3% | 18.0%(-15.7)#28 | 16.9%(-14.6)#835 |
| 29. | Virginia Gardens | 2.4% | 18.0%(-15.6)#29 | 16.9%(-14.5)#875 |
| 30. | Fuller Heights | 2.4% | 18.0%(-15.6)#30 | 16.9%(-14.5)#879 |
| 31. | Key Largo | 2.5% | 18.0%(-15.5)#31 | 16.9%(-14.4)#922 |
| 32. | Gulf Breeze | 2.6% | 18.0%(-15.4)#32 | 16.9%(-14.3)#965 |
| 33. | Parkland | 2.6% | 18.0%(-15.4)#33 | 16.9%(-14.3)#992 |
| 34. | Conway | 2.6% | 18.0%(-15.4)#34 | 16.9%(-14.3)#1,014 |
| 35. | Englewood | 2.8% | 18.0%(-15.2)#35 | 16.9%(-14.1)#1,125 |
| 36. | Fruitville | 2.9% | 18.0%(-15.1)#36 | 16.9%(-14.0)#1,143 |
| 37. | Southwest Ranches | 2.9% | 18.0%(-15.1)#37 | 16.9%(-14.0)#1,158 |
| 38. | Micco | 2.9% | 18.0%(-15.1)#38 | 16.9%(-14.0)#1,173 |
| 39. | St Augustine Beach | 3.0% | 18.0%(-15.0)#39 | 16.9%(-13.9)#1,215 |
| 40. | Apollo Beach | 3.0% | 18.0%(-15.0)#40 | 16.9%(-13.9)#1,249 |
| 41. | Miami Lakes | 3.1% | 18.0%(-14.9)#41 | 16.9%(-13.8)#1,295 |
| 42. | World Golf Village | 3.1% | 18.0%(-14.9)#42 | 16.9%(-13.8)#1,306 |
| 43. | The Acreage | 3.1% | 18.0%(-14.9)#43 | 16.9%(-13.8)#1,323 |
| 44. | Taylor Creek | 3.2% | 18.0%(-14.9)#44 | 16.9%(-13.7)#1,334 |
| 45. | North Palm Beach | 3.2% | 18.0%(-14.8)#45 | 16.9%(-13.7)#1,340 |
| 46. | Laurel | 3.2% | 18.0%(-14.8)#46 | 16.9%(-13.7)#1,364 |
| 47. | Venice Gardens | 3.3% | 18.0%(-14.7)#47 | 16.9%(-13.6)#1,401 |
| 48. | Lutz | 3.4% | 18.0%(-14.6)#48 | 16.9%(-13.5)#1,467 |
| 49. | Mayo | 3.5% | 18.0%(-14.5)#49 | 16.9%(-13.4)#1,544 |
| 50. | Lauderdale By The Sea | 3.5% | 18.0%(-14.5)#50 | 16.9%(-13.4)#1,559 |
| 51. | Lakewood Ranch | 3.5% | 18.0%(-14.5)#51 | 16.9%(-13.4)#1,564 |
| 52. | Pebble Creek | 3.5% | 18.0%(-14.5)#52 | 16.9%(-13.4)#1,565 |
| 53. | Lighthouse Point | 3.5% | 18.0%(-14.5)#53 | 16.9%(-13.4)#1,566 |
| 54. | Taft | 3.6% | 18.0%(-14.4)#54 | 16.9%(-13.3)#1,600 |
| 55. | West Melbourne | 3.6% | 18.0%(-14.4)#55 | 16.9%(-13.3)#1,611 |
| 56. | Frostproof | 3.8% | 18.0%(-14.2)#56 | 16.9%(-13.1)#1,692 |
| 57. | Mexico Beach | 3.8% | 18.0%(-14.2)#57 | 16.9%(-13.1)#1,695 |
| 58. | Sunset | 3.9% | 18.0%(-14.1)#58 | 16.9%(-13.0)#1,761 |
| 59. | Venice | 3.9% | 18.0%(-14.1)#59 | 16.9%(-13.0)#1,777 |
| 60. | Miami Shores | 4.0% | 18.0%(-14.1)#60 | 16.9%(-12.9)#1,804 |
| 61. | Middleburg | 4.0% | 18.0%(-14.0)#61 | 16.9%(-12.9)#1,848 |
| 62. | El Portal | 4.2% | 18.0%(-13.8)#62 | 16.9%(-12.7)#1,943 |
| 63. | Winter Beach | 4.3% | 18.0%(-13.7)#63 | 16.9%(-12.6)#2,015 |
| 64. | Asbury Lake | 4.4% | 18.0%(-13.7)#64 | 16.9%(-12.6)#2,034 |
| 65. | Horizon West | 4.5% | 18.0%(-13.5)#65 | 16.9%(-12.4)#2,110 |
| 66. | Cheval | 4.6% | 18.0%(-13.4)#66 | 16.9%(-12.3)#2,166 |
| 67. | Lake Alfred | 4.7% | 18.0%(-13.4)#67 | 16.9%(-12.2)#2,202 |
| 68. | Pine Ridge Cdp Collier County | 4.7% | 18.0%(-13.3)#68 | 16.9%(-12.2)#2,203 |
| 69. | Cocoa | 4.7% | 18.0%(-13.3)#69 | 16.9%(-12.2)#2,215 |
| 70. | Meadow Woods | 4.8% | 18.0%(-13.2)#70 | 16.9%(-12.1)#2,273 |
| 71. | Lecanto | 4.8% | 18.0%(-13.2)#71 | 16.9%(-12.1)#2,291 |
| 72. | Alafaya | 4.9% | 18.0%(-13.2)#72 | 16.9%(-12.1)#2,299 |
| 73. | Odessa | 4.9% | 18.0%(-13.2)#73 | 16.9%(-12.0)#2,302 |
| 74. | St Augustine Shores | 4.9% | 18.0%(-13.1)#74 | 16.9%(-12.0)#2,329 |
| 75. | Fish Hawk | 4.9% | 18.0%(-13.1)#75 | 16.9%(-12.0)#2,360 |
| 76. | The Crossings | 5.0% | 18.0%(-13.0)#76 | 16.9%(-11.9)#2,363 |
| 77. | St Augustine | 5.0% | 18.0%(-13.0)#77 | 16.9%(-11.9)#2,366 |
| 78. | Coral Gables | 5.0% | 18.0%(-13.0)#78 | 16.9%(-11.9)#2,371 |
| 79. | Lealman | 5.1% | 18.0%(-12.9)#79 | 16.9%(-11.8)#2,435 |
| 80. | Macclenny | 5.1% | 18.0%(-12.9)#80 | 16.9%(-11.8)#2,447 |
| 81. | Bradfordville | 5.1% | 18.0%(-12.9)#81 | 16.9%(-11.8)#2,487 |
| 82. | Lochmoor Waterway Estates | 5.2% | 18.0%(-12.8)#82 | 16.9%(-11.7)#2,496 |
| 83. | Dunedin | 5.2% | 18.0%(-12.8)#83 | 16.9%(-11.7)#2,530 |
| 84. | East Milton | 5.3% | 18.0%(-12.8)#84 | 16.9%(-11.6)#2,557 |
| 85. | Hypoluxo | 5.3% | 18.0%(-12.7)#85 | 16.9%(-11.6)#2,560 |
| 86. | Westchase | 5.3% | 18.0%(-12.7)#86 | 16.9%(-11.6)#2,620 |
| 87. | Golden Beach | 5.4% | 18.0%(-12.7)#87 | 16.9%(-11.5)#2,631 |
| 88. | Pinecrest | 5.5% | 18.0%(-12.5)#88 | 16.9%(-11.4)#2,708 |
| 89. | Sunny Isles Beach | 5.5% | 18.0%(-12.5)#89 | 16.9%(-11.4)#2,738 |
| 90. | Carrollwood | 5.5% | 18.0%(-12.5)#90 | 16.9%(-11.4)#2,739 |
| 91. | Wellington | 5.6% | 18.0%(-12.4)#91 | 16.9%(-11.3)#2,770 |
| 92. | Grenelefe | 5.6% | 18.0%(-12.4)#92 | 16.9%(-11.3)#2,780 |
| 93. | South Miami | 5.7% | 18.0%(-12.3)#93 | 16.9%(-11.2)#2,829 |
| 94. | Palm Beach Gardens | 5.7% | 18.0%(-12.3)#94 | 16.9%(-11.2)#2,839 |
| 95. | Sawgrass | 5.8% | 18.0%(-12.2)#95 | 16.9%(-11.1)#2,884 |
| 96. | Oviedo | 5.9% | 18.0%(-12.2)#96 | 16.9%(-11.0)#2,927 |
| 97. | Westwood Lakes | 5.9% | 18.0%(-12.2)#97 | 16.9%(-11.0)#2,929 |
| 98. | Panama City Beach | 6.0% | 18.0%(-12.1)#98 | 16.9%(-11.0)#2,981 |
| 99. | Winter Park | 6.1% | 18.0%(-11.9)#99 | 16.9%(-10.8)#3,057 |
| 100. | Bloomingdale | 6.1% | 18.0%(-11.9)#100 | 16.9%(-10.8)#3,064 |
Common Questions
What are the Top 10 Cities with the Lowest Child Poverty Level Among Boys Under the Age of 16 in Florida?
Top 10 Cities with the Lowest Child Poverty Level Among Boys Under the Age of 16 in Florida are:
#1
0.32%
#2
0.59%
#3
0.62%
#4
0.82%
#5
0.87%
#6
0.99%
#7
1.1%
#8
1.2%
#9
1.2%
#10
1.2%
What city has the Lowest Child Poverty Level Among Boys Under the Age of 16 in Florida?
Northdale has the Lowest Child Poverty Level Among Boys Under the Age of 16 in Florida with 0.32%.
What is the Poverty Level Among Boys Under the Age of 16 in the State of Florida?
Poverty Level Among Boys Under the Age of 16 in Florida is 18.0%.
What is the Poverty Level Among Boys Under the Age of 16 in the United States?
Poverty Level Among Boys Under the Age of 16 in the United States is 16.9%.