Cities with the Highest Costs of Housing as Percentage of Income in Connecticut
RELATED REPORTS & OPTIONS
Highest Housing Costs / Income
Connecticut
Compare Cities
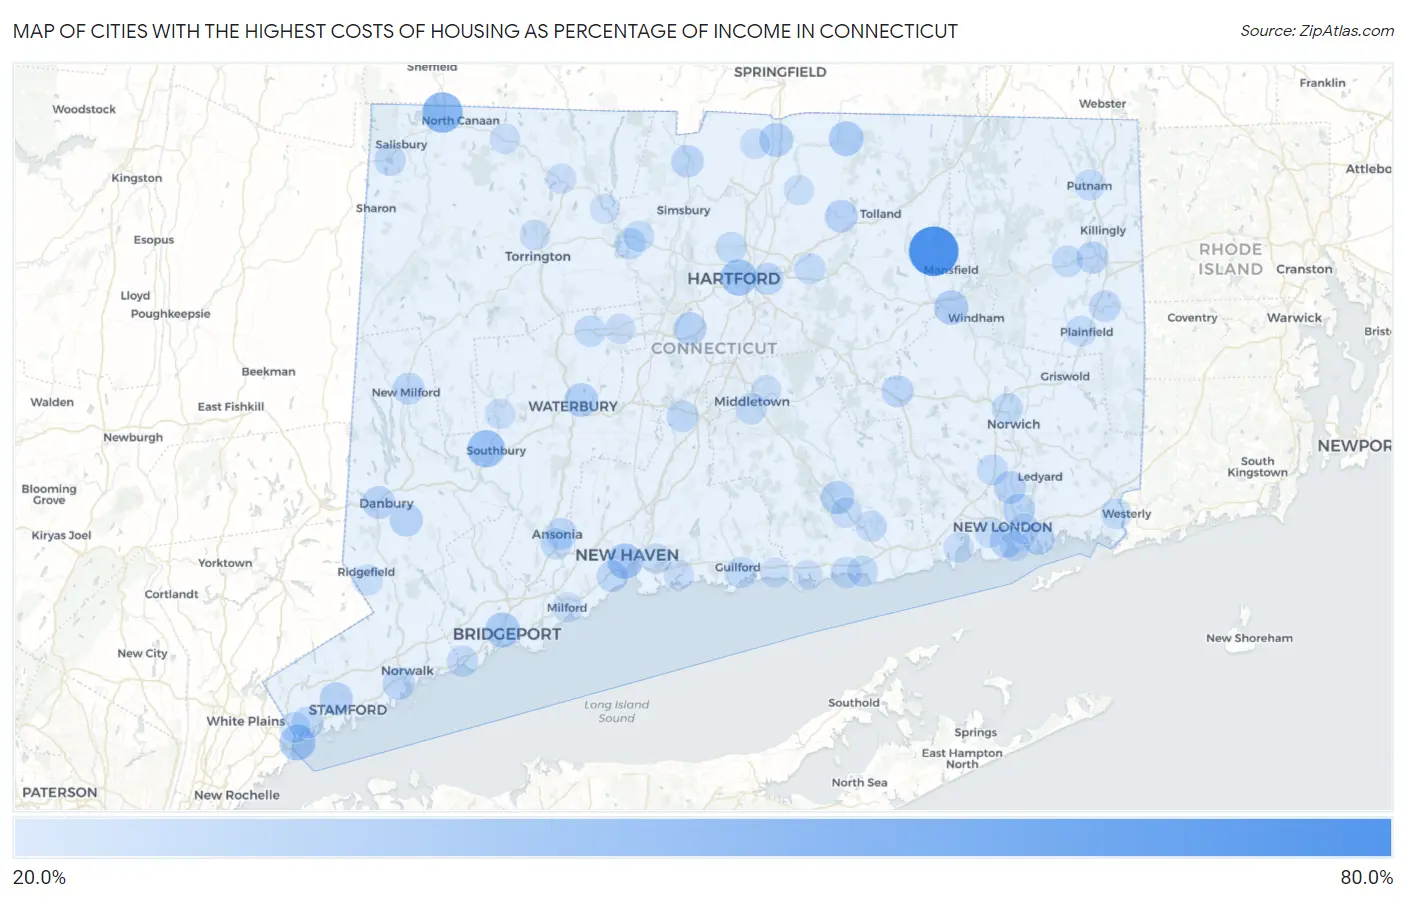
Map of Cities with the Highest Costs of Housing as Percentage of Income in Connecticut
0.0%
80.0%
Cities with the Highest Costs of Housing as Percentage of Income in Connecticut
| City | Housing Costs / Income | vs State | vs National | |
| 1. | Storrs | 67.2% | 21.8%(+45.4)#1 | 20.4%(+46.8)#34 |
| 2. | Canaan | 44.8% | 21.8%(+23.0)#2 | 20.4%(+24.5)#115 |
| 3. | Taylor Corners | 42.7% | 21.8%(+20.9)#3 | 20.4%(+22.3)#145 |
| 4. | Dayville | 37.7% | 21.8%(+15.9)#4 | 20.4%(+17.3)#259 |
| 5. | Heritage Village | 37.5% | 21.8%(+15.7)#5 | 20.4%(+17.1)#267 |
| 6. | Hartford | 35.0% | 21.8%(+13.2)#6 | 20.4%(+14.6)#405 |
| 7. | Byram | 33.8% | 21.8%(+12.0)#7 | 20.4%(+13.5)#483 |
| 8. | New Haven | 32.8% | 21.8%(+11.0)#8 | 20.4%(+12.5)#579 |
| 9. | Bridgeport | 31.8% | 21.8%(+9.98)#9 | 20.4%(+11.4)#690 |
| 10. | Somers | 31.2% | 21.8%(+9.43)#10 | 20.4%(+10.9)#758 |
| 11. | Oronoque | 31.0% | 21.8%(+9.21)#11 | 20.4%(+10.6)#799 |
| 12. | Willimantic | 30.3% | 21.8%(+8.48)#12 | 20.4%(+9.91)#914 |
| 13. | Thompsonville | 29.4% | 21.8%(+7.62)#13 | 20.4%(+9.05)#1,086 |
| 14. | Cornwall Bridge | 29.1% | 21.8%(+7.29)#14 | 20.4%(+8.72)#1,167 |
| 15. | Waterbury | 28.9% | 21.8%(+7.05)#15 | 20.4%(+8.48)#1,223 |
| 16. | Topstone | 28.8% | 21.8%(+6.96)#16 | 20.4%(+8.39)#1,247 |
| 17. | Fenwick Borough | 28.7% | 21.8%(+6.85)#17 | 20.4%(+8.28)#1,280 |
| 18. | Gaylordsville | 28.4% | 21.8%(+6.63)#18 | 20.4%(+8.05)#1,345 |
| 19. | Chester Center | 28.0% | 21.8%(+6.22)#19 | 20.4%(+7.65)#1,482 |
| 20. | Jewett City Borough | 27.9% | 21.8%(+6.11)#20 | 20.4%(+7.53)#1,529 |
| 21. | New Britain | 27.9% | 21.8%(+6.05)#21 | 20.4%(+7.48)#1,559 |
| 22. | Bethel | 27.8% | 21.8%(+6.02)#22 | 20.4%(+7.44)#1,579 |
| 23. | Stamford | 27.4% | 21.8%(+5.58)#23 | 20.4%(+7.00)#1,729 |
| 24. | New London | 27.2% | 21.8%(+5.45)#24 | 20.4%(+6.87)#1,788 |
| 25. | Danbury | 27.1% | 21.8%(+5.25)#25 | 20.4%(+6.68)#1,870 |
| 26. | Rockville | 26.9% | 21.8%(+5.05)#26 | 20.4%(+6.48)#1,963 |
| 27. | Groton Long Point Borough | 26.4% | 21.8%(+4.64)#27 | 20.4%(+6.06)#2,169 |
| 28. | Gales Ferry | 26.4% | 21.8%(+4.61)#28 | 20.4%(+6.04)#2,184 |
| 29. | Norwalk | 26.4% | 21.8%(+4.57)#29 | 20.4%(+6.00)#2,206 |
| 30. | Salmon Brook | 26.2% | 21.8%(+4.41)#30 | 20.4%(+5.84)#2,287 |
| 31. | Poquonock Bridge | 26.2% | 21.8%(+4.39)#31 | 20.4%(+5.81)#2,296 |
| 32. | Conning Towers Nautilus Park | 26.1% | 21.8%(+4.34)#32 | 20.4%(+5.76)#2,319 |
| 33. | Stonington Borough | 26.1% | 21.8%(+4.33)#33 | 20.4%(+5.76)#2,322 |
| 34. | East Brooklyn | 25.6% | 21.8%(+3.76)#34 | 20.4%(+5.19)#2,682 |
| 35. | Colchester | 25.4% | 21.8%(+3.55)#35 | 20.4%(+4.97)#2,806 |
| 36. | Bantam Borough | 25.0% | 21.8%(+3.21)#36 | 20.4%(+4.64)#3,041 |
| 37. | East Hartford | 25.0% | 21.8%(+3.19)#37 | 20.4%(+4.62)#3,055 |
| 38. | New Milford | 24.9% | 21.8%(+3.07)#38 | 20.4%(+4.50)#3,164 |
| 39. | Lordship | 24.7% | 21.8%(+2.94)#39 | 20.4%(+4.36)#3,258 |
| 40. | Ansonia | 24.6% | 21.8%(+2.83)#40 | 20.4%(+4.26)#3,339 |
| 41. | Lakeville | 24.6% | 21.8%(+2.80)#41 | 20.4%(+4.23)#3,366 |
| 42. | Meriden | 24.6% | 21.8%(+2.79)#42 | 20.4%(+4.22)#3,371 |
| 43. | Moosup | 24.4% | 21.8%(+2.62)#43 | 20.4%(+4.05)#3,504 |
| 44. | Greenwich | 24.3% | 21.8%(+2.54)#44 | 20.4%(+3.97)#3,584 |
| 45. | West Haven | 24.3% | 21.8%(+2.50)#45 | 20.4%(+3.93)#3,619 |
| 46. | South Wilton | 24.2% | 21.8%(+2.44)#46 | 20.4%(+3.86)#3,672 |
| 47. | Brooklyn | 23.8% | 21.8%(+1.97)#47 | 20.4%(+3.39)#4,083 |
| 48. | Terryville | 23.7% | 21.8%(+1.87)#48 | 20.4%(+3.30)#4,185 |
| 49. | Southport | 23.6% | 21.8%(+1.78)#49 | 20.4%(+3.20)#4,287 |
| 50. | Derby | 23.5% | 21.8%(+1.74)#50 | 20.4%(+3.17)#4,321 |
| 51. | Blue Hills | 23.5% | 21.8%(+1.73)#51 | 20.4%(+3.16)#4,331 |
| 52. | Norwich | 23.4% | 21.8%(+1.64)#52 | 20.4%(+3.06)#4,432 |
| 53. | Collinsville | 23.4% | 21.8%(+1.62)#53 | 20.4%(+3.05)#4,446 |
| 54. | Ridgebury | 23.4% | 21.8%(+1.60)#54 | 20.4%(+3.03)#4,463 |
| 55. | Guilford Center | 23.4% | 21.8%(+1.60)#55 | 20.4%(+3.03)#4,464 |
| 56. | Trumbull Center | 23.4% | 21.8%(+1.59)#56 | 20.4%(+3.02)#4,471 |
| 57. | Middletown | 23.3% | 21.8%(+1.54)#57 | 20.4%(+2.96)#4,535 |
| 58. | Pemberwick | 23.3% | 21.8%(+1.46)#58 | 20.4%(+2.89)#4,602 |
| 59. | Westbrook Center | 23.2% | 21.8%(+1.37)#59 | 20.4%(+2.80)#4,690 |
| 60. | Redding Center | 23.1% | 21.8%(+1.32)#60 | 20.4%(+2.75)#4,751 |
| 61. | New Canaan | 23.1% | 21.8%(+1.32)#61 | 20.4%(+2.74)#4,756 |
| 62. | Oxoboxo River | 23.1% | 21.8%(+1.29)#62 | 20.4%(+2.72)#4,788 |
| 63. | Essex Village | 23.1% | 21.8%(+1.26)#63 | 20.4%(+2.68)#4,820 |
| 64. | Putnam | 23.0% | 21.8%(+1.21)#64 | 20.4%(+2.64)#4,887 |
| 65. | Saybrook Manor | 23.0% | 21.8%(+1.20)#65 | 20.4%(+2.63)#4,893 |
| 66. | Manchester | 22.9% | 21.8%(+1.15)#66 | 20.4%(+2.57)#4,971 |
| 67. | Lake Chaffee | 22.9% | 21.8%(+1.09)#67 | 20.4%(+2.52)#5,031 |
| 68. | Woodmont Borough | 22.8% | 21.8%(+1.04)#68 | 20.4%(+2.47)#5,085 |
| 69. | Canton Valley | 22.8% | 21.8%(+1.03)#69 | 20.4%(+2.45)#5,111 |
| 70. | Plainfield Village | 22.8% | 21.8%(+0.996)#70 | 20.4%(+2.42)#5,153 |
| 71. | Rock Ridge | 22.6% | 21.8%(+0.837)#71 | 20.4%(+2.26)#5,360 |
| 72. | Pawcatuck | 22.6% | 21.8%(+0.751)#72 | 20.4%(+2.18)#5,465 |
| 73. | Long Hill | 22.5% | 21.8%(+0.672)#73 | 20.4%(+2.10)#5,549 |
| 74. | Deep River Center | 22.4% | 21.8%(+0.606)#74 | 20.4%(+2.03)#5,637 |
| 75. | Ridgefield | 22.4% | 21.8%(+0.557)#75 | 20.4%(+1.98)#5,696 |
| 76. | Danielson Borough | 22.3% | 21.8%(+0.474)#76 | 20.4%(+1.90)#5,803 |
| 77. | Waterford | 22.3% | 21.8%(+0.463)#77 | 20.4%(+1.89)#5,820 |
| 78. | Bigelow Corners | 22.2% | 21.8%(+0.435)#78 | 20.4%(+1.86)#5,864 |
| 79. | East Haven | 22.2% | 21.8%(+0.405)#79 | 20.4%(+1.83)#5,917 |
| 80. | Tashua | 22.1% | 21.8%(+0.249)#80 | 20.4%(+1.68)#6,140 |
| 81. | Torrington | 22.0% | 21.8%(+0.193)#81 | 20.4%(+1.62)#6,210 |
| 82. | Compo | 21.7% | 21.8%(-0.081)#82 | 20.4%(+1.35)#6,595 |
| 83. | Niantic | 21.7% | 21.8%(-0.117)#83 | 20.4%(+1.31)#6,646 |
| 84. | Milford City Balance | 21.6% | 21.8%(-0.248)#84 | 20.4%(+1.18)#6,838 |
| 85. | Woodbury Center | 21.5% | 21.8%(-0.284)#85 | 20.4%(+1.14)#6,908 |
| 86. | Branford Center | 21.5% | 21.8%(-0.312)#86 | 20.4%(+1.11)#6,944 |
| 87. | Norfolk | 21.4% | 21.8%(-0.365)#87 | 20.4%(+1.06)#7,019 |
| 88. | Winsted | 21.4% | 21.8%(-0.374)#88 | 20.4%(+1.05)#7,037 |
| 89. | Groton | 21.4% | 21.8%(-0.425)#89 | 20.4%(+1.00)#7,102 |
| 90. | Bristol | 21.3% | 21.8%(-0.533)#90 | 20.4%(+0.893)#7,284 |
| 91. | Broad Brook | 21.1% | 21.8%(-0.721)#91 | 20.4%(+0.705)#7,591 |
| 92. | Suffield Depot | 21.0% | 21.8%(-0.783)#92 | 20.4%(+0.643)#7,702 |
| 93. | Coleytown | 21.0% | 21.8%(-0.834)#93 | 20.4%(+0.592)#7,785 |
| 94. | New Hartford Center | 20.9% | 21.8%(-0.860)#94 | 20.4%(+0.566)#7,841 |
| 95. | Clinton | 20.9% | 21.8%(-0.898)#95 | 20.4%(+0.528)#7,910 |
| 96. | Newtown Borough | 20.8% | 21.8%(-1.04)#96 | 20.4%(+0.387)#8,120 |
| 97. | Portland | 20.7% | 21.8%(-1.13)#97 | 20.4%(+0.294)#8,285 |
| 98. | Madison Center | 20.6% | 21.8%(-1.20)#98 | 20.4%(+0.230)#8,410 |
| 99. | Stratford Downtown | 20.6% | 21.8%(-1.20)#99 | 20.4%(+0.223)#8,430 |
| 100. | Mamanasco Lake | 20.6% | 21.8%(-1.21)#100 | 20.4%(+0.214)#8,450 |
1
2Common Questions
What are the Top 10 Cities with the Highest Costs of Housing as Percentage of Income in Connecticut?
Top 10 Cities with the Highest Costs of Housing as Percentage of Income in Connecticut are:
#1
67.2%
#2
44.8%
#3
37.5%
#4
35.0%
#5
33.8%
#6
32.8%
#7
31.8%
#8
31.2%
#9
30.3%
#10
29.4%
What city has the Highest Costs of Housing as Percentage of Income in Connecticut?
Storrs has the Highest Costs of Housing as Percentage of Income in Connecticut with 67.2%.
What is the Average Housing Costs as Percentage of Income in the State of Connecticut?
Average Housing Costs as Percentage of Income in Connecticut is 21.8%.
What is the Average Housing Costs as Percentage of Income in the United States?
Average Housing Costs as Percentage of Income in the United States is 20.4%.