Cities with the Highest Costs of Housing as Percentage of Income in Georgia
RELATED REPORTS & OPTIONS
Highest Housing Costs / Income
Georgia
Compare Cities
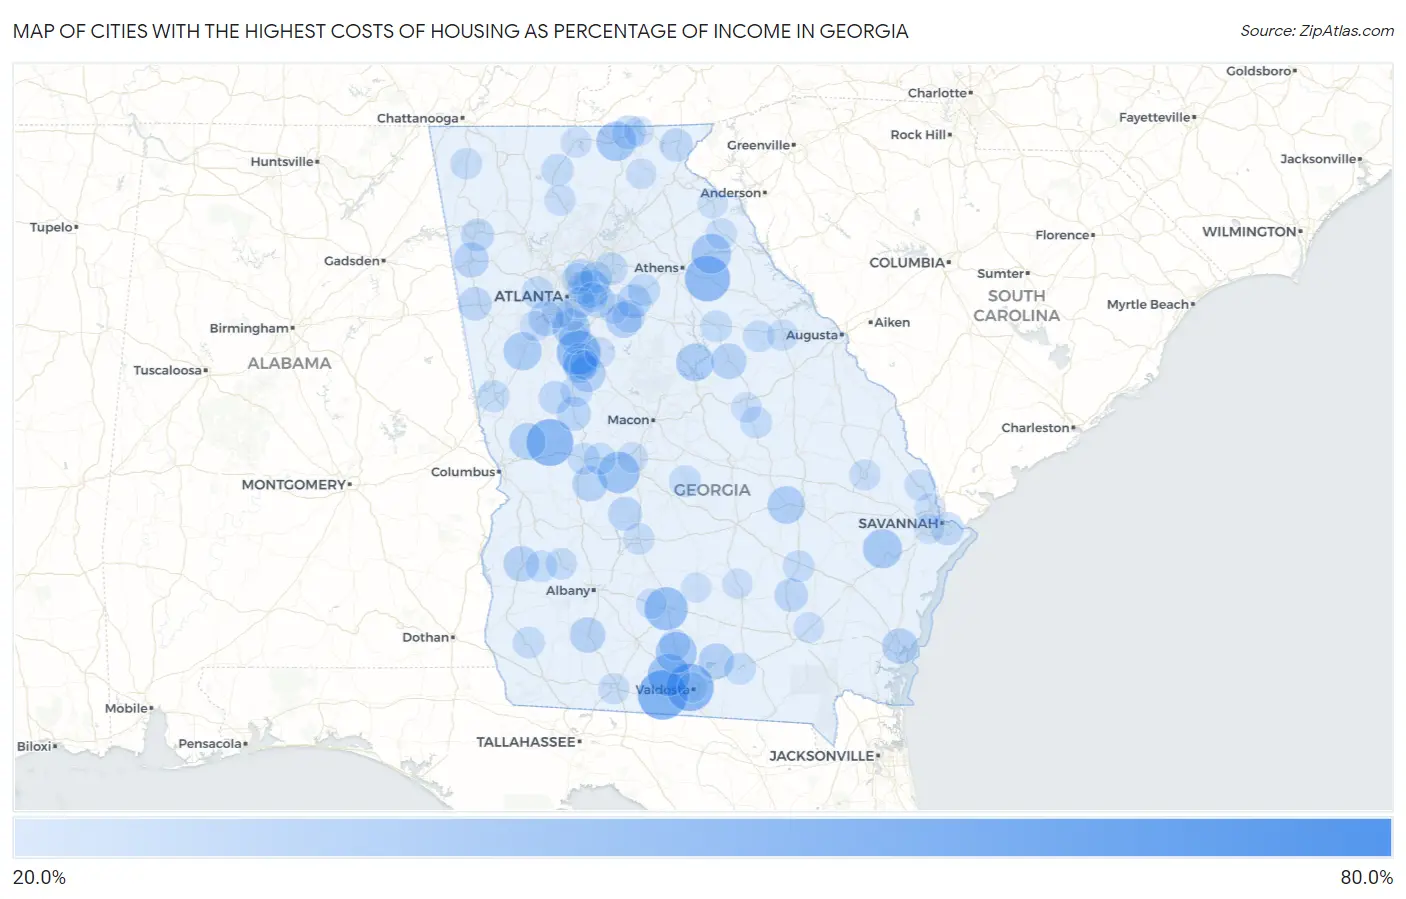
Map of Cities with the Highest Costs of Housing as Percentage of Income in Georgia
0.0%
80.0%
Cities with the Highest Costs of Housing as Percentage of Income in Georgia
| City | Housing Costs / Income | vs State | vs National | |
| 1. | Gough | 64.4% | 20.4%(+44.0)#1 | 20.4%(+44.0)#40 |
| 2. | Quitman | 46.9% | 20.4%(+26.4)#2 | 20.4%(+26.5)#98 |
| 3. | Remerton | 44.5% | 20.4%(+24.1)#3 | 20.4%(+24.2)#117 |
| 4. | Talbotton | 44.0% | 20.4%(+23.5)#4 | 20.4%(+23.6)#128 |
| 5. | Crawford | 42.3% | 20.4%(+21.9)#5 | 20.4%(+21.9)#149 |
| 6. | Sunny Side | 41.0% | 20.4%(+20.6)#6 | 20.4%(+20.6)#166 |
| 7. | Phillipsburg | 39.9% | 20.4%(+19.5)#7 | 20.4%(+19.5)#198 |
| 8. | Morven | 38.7% | 20.4%(+18.3)#8 | 20.4%(+18.4)#226 |
| 9. | Marshallville | 38.3% | 20.4%(+17.9)#9 | 20.4%(+17.9)#236 |
| 10. | Adel | 37.6% | 20.4%(+17.2)#10 | 20.4%(+17.2)#263 |
| 11. | Comer | 36.2% | 20.4%(+15.8)#11 | 20.4%(+15.9)#339 |
| 12. | Blairsville | 36.0% | 20.4%(+15.6)#12 | 20.4%(+15.6)#348 |
| 13. | Fort Stewart | 35.5% | 20.4%(+15.1)#13 | 20.4%(+15.1)#370 |
| 14. | East Newnan | 34.3% | 20.4%(+13.9)#14 | 20.4%(+13.9)#449 |
| 15. | Stone Mountain | 34.0% | 20.4%(+13.6)#15 | 20.4%(+13.6)#472 |
| 16. | Crooked Creek | 34.0% | 20.4%(+13.6)#16 | 20.4%(+13.6)#476 |
| 17. | Higgston | 33.8% | 20.4%(+13.4)#17 | 20.4%(+13.5)#485 |
| 18. | Jonesboro | 33.8% | 20.4%(+13.4)#18 | 20.4%(+13.4)#491 |
| 19. | Waverly Hall | 32.7% | 20.4%(+12.3)#19 | 20.4%(+12.4)#590 |
| 20. | Orchard Hill | 32.3% | 20.4%(+11.9)#20 | 20.4%(+11.9)#638 |
| 21. | Experiment | 32.2% | 20.4%(+11.7)#21 | 20.4%(+11.8)#645 |
| 22. | Lakeland | 32.0% | 20.4%(+11.6)#22 | 20.4%(+11.6)#665 |
| 23. | Porterdale | 31.9% | 20.4%(+11.5)#23 | 20.4%(+11.5)#676 |
| 24. | Sparta | 31.8% | 20.4%(+11.3)#24 | 20.4%(+11.4)#693 |
| 25. | Brunswick | 31.8% | 20.4%(+11.3)#25 | 20.4%(+11.4)#694 |
| 26. | Cuthbert | 31.8% | 20.4%(+11.3)#26 | 20.4%(+11.4)#695 |
| 27. | Camilla | 31.6% | 20.4%(+11.2)#27 | 20.4%(+11.3)#710 |
| 28. | Ideal | 31.4% | 20.4%(+11.0)#28 | 20.4%(+11.1)#731 |
| 29. | Cedartown | 31.1% | 20.4%(+10.7)#29 | 20.4%(+10.7)#780 |
| 30. | Union City | 30.8% | 20.4%(+10.4)#30 | 20.4%(+10.5)#823 |
| 31. | Box Springs | 30.6% | 20.4%(+10.2)#31 | 20.4%(+10.2)#863 |
| 32. | Jersey | 30.2% | 20.4%(+9.80)#32 | 20.4%(+9.84)#932 |
| 33. | Thomaston | 30.2% | 20.4%(+9.76)#33 | 20.4%(+9.80)#939 |
| 34. | Lilly | 30.1% | 20.4%(+9.67)#34 | 20.4%(+9.71)#954 |
| 35. | Young Harris | 30.0% | 20.4%(+9.56)#35 | 20.4%(+9.60)#980 |
| 36. | Griffin | 29.8% | 20.4%(+9.35)#36 | 20.4%(+9.39)#1,015 |
| 37. | Rockingham | 29.5% | 20.4%(+9.09)#37 | 20.4%(+9.13)#1,069 |
| 38. | Waco | 29.4% | 20.4%(+9.03)#38 | 20.4%(+9.07)#1,081 |
| 39. | Tiger | 29.3% | 20.4%(+8.87)#39 | 20.4%(+8.91)#1,119 |
| 40. | Lithonia | 29.2% | 20.4%(+8.82)#40 | 20.4%(+8.86)#1,134 |
| 41. | Lindale | 29.1% | 20.4%(+8.71)#41 | 20.4%(+8.75)#1,159 |
| 42. | Thunderbolt | 29.1% | 20.4%(+8.68)#42 | 20.4%(+8.72)#1,165 |
| 43. | Covington | 28.9% | 20.4%(+8.47)#43 | 20.4%(+8.51)#1,212 |
| 44. | Molena | 28.9% | 20.4%(+8.44)#44 | 20.4%(+8.48)#1,220 |
| 45. | Clarkston | 28.7% | 20.4%(+8.27)#45 | 20.4%(+8.31)#1,270 |
| 46. | Monroe | 28.6% | 20.4%(+8.16)#46 | 20.4%(+8.20)#1,297 |
| 47. | Lawrenceville | 28.6% | 20.4%(+8.16)#47 | 20.4%(+8.20)#1,300 |
| 48. | Lovejoy | 28.5% | 20.4%(+8.13)#48 | 20.4%(+8.17)#1,306 |
| 49. | Doraville | 28.4% | 20.4%(+7.94)#49 | 20.4%(+7.98)#1,373 |
| 50. | East Ellijay | 28.2% | 20.4%(+7.77)#50 | 20.4%(+7.81)#1,421 |
| 51. | Cochran | 28.0% | 20.4%(+7.59)#51 | 20.4%(+7.63)#1,492 |
| 52. | Butler | 28.0% | 20.4%(+7.57)#52 | 20.4%(+7.61)#1,497 |
| 53. | Lithia Springs | 28.0% | 20.4%(+7.56)#53 | 20.4%(+7.60)#1,499 |
| 54. | Colquitt | 27.9% | 20.4%(+7.47)#54 | 20.4%(+7.51)#1,545 |
| 55. | Lagrange | 27.9% | 20.4%(+7.46)#55 | 20.4%(+7.50)#1,550 |
| 56. | Reynolds | 27.9% | 20.4%(+7.43)#56 | 20.4%(+7.48)#1,562 |
| 57. | Baxley | 27.8% | 20.4%(+7.40)#57 | 20.4%(+7.45)#1,576 |
| 58. | Shellman | 27.8% | 20.4%(+7.38)#58 | 20.4%(+7.42)#1,586 |
| 59. | Siloam | 27.8% | 20.4%(+7.37)#59 | 20.4%(+7.41)#1,592 |
| 60. | Meansville | 27.8% | 20.4%(+7.37)#60 | 20.4%(+7.41)#1,593 |
| 61. | Lilburn | 27.8% | 20.4%(+7.34)#61 | 20.4%(+7.38)#1,601 |
| 62. | Harrison | 27.7% | 20.4%(+7.33)#62 | 20.4%(+7.37)#1,607 |
| 63. | Du Pont | 27.7% | 20.4%(+7.24)#63 | 20.4%(+7.28)#1,630 |
| 64. | Norwood | 27.6% | 20.4%(+7.15)#64 | 20.4%(+7.19)#1,659 |
| 65. | Dawson | 27.5% | 20.4%(+7.06)#65 | 20.4%(+7.10)#1,690 |
| 66. | Forest Park | 27.4% | 20.4%(+7.00)#66 | 20.4%(+7.05)#1,713 |
| 67. | Cordele | 27.4% | 20.4%(+6.97)#67 | 20.4%(+7.01)#1,721 |
| 68. | New England | 27.4% | 20.4%(+6.97)#68 | 20.4%(+7.01)#1,722 |
| 69. | College Park | 27.3% | 20.4%(+6.93)#69 | 20.4%(+6.97)#1,743 |
| 70. | Lafayette | 27.3% | 20.4%(+6.89)#70 | 20.4%(+6.93)#1,759 |
| 71. | Thomson | 27.2% | 20.4%(+6.76)#71 | 20.4%(+6.80)#1,818 |
| 72. | Springfield | 27.1% | 20.4%(+6.68)#72 | 20.4%(+6.73)#1,845 |
| 73. | Jasper | 27.1% | 20.4%(+6.67)#73 | 20.4%(+6.71)#1,854 |
| 74. | Thomasville | 27.0% | 20.4%(+6.63)#74 | 20.4%(+6.67)#1,874 |
| 75. | Sparks | 27.0% | 20.4%(+6.63)#75 | 20.4%(+6.67)#1,875 |
| 76. | Chamblee | 27.0% | 20.4%(+6.55)#76 | 20.4%(+6.59)#1,908 |
| 77. | Bowman | 26.9% | 20.4%(+6.46)#77 | 20.4%(+6.50)#1,947 |
| 78. | Statesboro | 26.9% | 20.4%(+6.46)#78 | 20.4%(+6.50)#1,950 |
| 79. | Panthersville | 26.9% | 20.4%(+6.44)#79 | 20.4%(+6.48)#1,961 |
| 80. | Port Wentworth | 26.8% | 20.4%(+6.41)#80 | 20.4%(+6.45)#1,977 |
| 81. | Fort Valley | 26.7% | 20.4%(+6.29)#81 | 20.4%(+6.34)#2,040 |
| 82. | Blue Ridge | 26.7% | 20.4%(+6.28)#82 | 20.4%(+6.32)#2,046 |
| 83. | Athens-Clarke County Unified Government (Balance) | 26.6% | 20.4%(+6.22)#83 | 20.4%(+6.26)#2,074 |
| 84. | Blackshear | 26.6% | 20.4%(+6.18)#84 | 20.4%(+6.22)#2,089 |
| 85. | Tennille | 26.5% | 20.4%(+6.06)#85 | 20.4%(+6.10)#2,154 |
| 86. | Palmetto | 26.3% | 20.4%(+5.85)#86 | 20.4%(+5.89)#2,256 |
| 87. | Yonah | 26.3% | 20.4%(+5.85)#87 | 20.4%(+5.89)#2,260 |
| 88. | Ty Ty | 26.2% | 20.4%(+5.82)#88 | 20.4%(+5.86)#2,272 |
| 89. | Locust Grove | 26.2% | 20.4%(+5.82)#89 | 20.4%(+5.86)#2,275 |
| 90. | Broxton | 26.2% | 20.4%(+5.79)#90 | 20.4%(+5.83)#2,289 |
| 91. | Savannah | 26.2% | 20.4%(+5.75)#91 | 20.4%(+5.80)#2,301 |
| 92. | Hiawassee | 26.1% | 20.4%(+5.66)#92 | 20.4%(+5.70)#2,346 |
| 93. | Ocilla | 26.1% | 20.4%(+5.64)#93 | 20.4%(+5.68)#2,356 |
| 94. | Conyers | 26.0% | 20.4%(+5.62)#94 | 20.4%(+5.67)#2,368 |
| 95. | Lavonia | 26.0% | 20.4%(+5.61)#95 | 20.4%(+5.65)#2,380 |
| 96. | Faceville | 26.0% | 20.4%(+5.61)#96 | 20.4%(+5.65)#2,386 |
| 97. | Redan | 26.0% | 20.4%(+5.55)#97 | 20.4%(+5.59)#2,422 |
| 98. | Cusseta Chattahoochee County Unified Government | 25.9% | 20.4%(+5.51)#98 | 20.4%(+5.55)#2,441 |
| 99. | Valdosta | 25.9% | 20.4%(+5.49)#99 | 20.4%(+5.53)#2,460 |
| 100. | East Griffin | 25.9% | 20.4%(+5.46)#100 | 20.4%(+5.50)#2,483 |
Common Questions
What are the Top 10 Cities with the Highest Costs of Housing as Percentage of Income in Georgia?
Top 10 Cities with the Highest Costs of Housing as Percentage of Income in Georgia are:
#1
46.9%
#2
44.5%
#3
44.0%
#4
42.3%
#5
41.0%
#6
39.9%
#7
38.7%
#8
38.3%
#9
37.6%
#10
36.2%
What city has the Highest Costs of Housing as Percentage of Income in Georgia?
Quitman has the Highest Costs of Housing as Percentage of Income in Georgia with 46.9%.
What is the Average Housing Costs as Percentage of Income in the State of Georgia?
Average Housing Costs as Percentage of Income in Georgia is 20.4%.
What is the Average Housing Costs as Percentage of Income in the United States?
Average Housing Costs as Percentage of Income in the United States is 20.4%.