Cities with the Highest Costs of Housing as Percentage of Income in Utah
RELATED REPORTS & OPTIONS
Highest Housing Costs / Income
Utah
Compare Cities
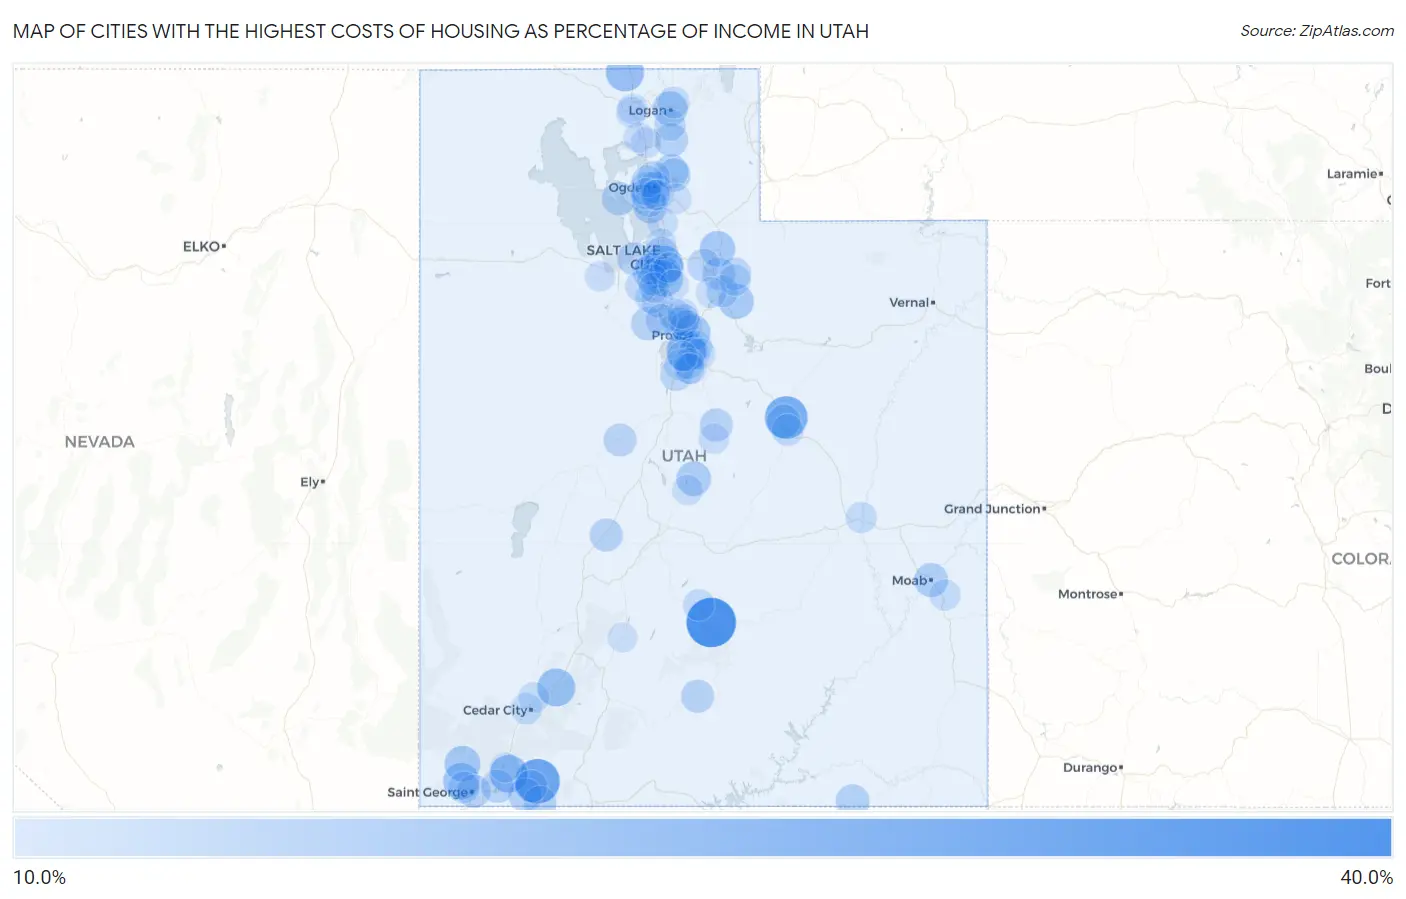
Map of Cities with the Highest Costs of Housing as Percentage of Income in Utah
0.0%
40.0%
Cities with the Highest Costs of Housing as Percentage of Income in Utah
| City | Housing Costs / Income | vs State | vs National | |
| 1. | Teasdale | 37.2% | 19.4%(+17.8)#1 | 20.4%(+16.8)#288 |
| 2. | Springdale | 32.4% | 19.4%(+12.9)#2 | 20.4%(+12.0)#622 |
| 3. | Kenilworth | 30.5% | 19.4%(+11.0)#3 | 20.4%(+10.1)#890 |
| 4. | Palmyra | 27.8% | 19.4%(+8.33)#4 | 20.4%(+7.38)#1,602 |
| 5. | South Salt Lake | 26.8% | 19.4%(+7.33)#5 | 20.4%(+6.39)#2,008 |
| 6. | Portage | 26.0% | 19.4%(+6.60)#6 | 20.4%(+5.66)#2,376 |
| 7. | La Verkin | 26.0% | 19.4%(+6.59)#7 | 20.4%(+5.65)#2,382 |
| 8. | Parowan | 26.0% | 19.4%(+6.53)#8 | 20.4%(+5.59)#2,424 |
| 9. | Ivins | 24.5% | 19.4%(+5.08)#9 | 20.4%(+4.14)#3,433 |
| 10. | Provo | 24.0% | 19.4%(+4.53)#10 | 20.4%(+3.59)#3,897 |
| 11. | Midvale | 24.0% | 19.4%(+4.52)#11 | 20.4%(+3.58)#3,903 |
| 12. | Dammeron Valley | 23.9% | 19.4%(+4.50)#12 | 20.4%(+3.55)#3,921 |
| 13. | Wanship | 23.6% | 19.4%(+4.21)#13 | 20.4%(+3.26)#4,225 |
| 14. | Timber Lakes | 23.5% | 19.4%(+4.07)#14 | 20.4%(+3.12)#4,374 |
| 15. | Logan | 23.1% | 19.4%(+3.62)#15 | 20.4%(+2.68)#4,834 |
| 16. | Manti | 22.9% | 19.4%(+3.48)#16 | 20.4%(+2.53)#5,018 |
| 17. | Vineyard | 22.8% | 19.4%(+3.40)#17 | 20.4%(+2.46)#5,100 |
| 18. | Clearfield | 22.7% | 19.4%(+3.23)#18 | 20.4%(+2.29)#5,331 |
| 19. | Moab | 22.3% | 19.4%(+2.88)#19 | 20.4%(+1.94)#5,763 |
| 20. | Kearns | 22.2% | 19.4%(+2.73)#20 | 20.4%(+1.78)#5,975 |
| 21. | Sunset | 22.1% | 19.4%(+2.71)#21 | 20.4%(+1.77)#6,002 |
| 22. | Wolf Creek | 22.1% | 19.4%(+2.67)#22 | 20.4%(+1.72)#6,062 |
| 23. | Oljato Monument Valley | 22.1% | 19.4%(+2.62)#23 | 20.4%(+1.68)#6,136 |
| 24. | Spring Glen | 22.0% | 19.4%(+2.57)#24 | 20.4%(+1.63)#6,203 |
| 25. | Hooper | 21.9% | 19.4%(+2.49)#25 | 20.4%(+1.55)#6,318 |
| 26. | Apple Valley | 21.9% | 19.4%(+2.48)#26 | 20.4%(+1.53)#6,339 |
| 27. | Avon | 21.9% | 19.4%(+2.47)#27 | 20.4%(+1.53)#6,351 |
| 28. | Salt Lake City | 21.9% | 19.4%(+2.46)#28 | 20.4%(+1.52)#6,366 |
| 29. | West Haven | 21.7% | 19.4%(+2.28)#29 | 20.4%(+1.33)#6,611 |
| 30. | Eden | 21.7% | 19.4%(+2.26)#30 | 20.4%(+1.31)#6,638 |
| 31. | St George | 21.6% | 19.4%(+2.19)#31 | 20.4%(+1.24)#6,755 |
| 32. | Hurricane | 21.6% | 19.4%(+2.15)#32 | 20.4%(+1.20)#6,805 |
| 33. | Hildale | 21.5% | 19.4%(+2.11)#33 | 20.4%(+1.17)#6,858 |
| 34. | Fairview | 21.5% | 19.4%(+2.11)#34 | 20.4%(+1.16)#6,869 |
| 35. | Meadow | 21.5% | 19.4%(+2.08)#35 | 20.4%(+1.14)#6,916 |
| 36. | White | 21.5% | 19.4%(+2.06)#36 | 20.4%(+1.12)#6,939 |
| 37. | Magna | 21.5% | 19.4%(+2.05)#37 | 20.4%(+1.11)#6,955 |
| 38. | Escalante | 21.5% | 19.4%(+2.03)#38 | 20.4%(+1.08)#6,988 |
| 39. | Eagle Mountain | 21.5% | 19.4%(+2.03)#39 | 20.4%(+1.08)#6,995 |
| 40. | Leamington | 21.4% | 19.4%(+1.93)#40 | 20.4%(+0.980)#7,134 |
| 41. | Harrisville | 21.1% | 19.4%(+1.71)#41 | 20.4%(+0.770)#7,479 |
| 42. | Hideout | 21.1% | 19.4%(+1.67)#42 | 20.4%(+0.726)#7,548 |
| 43. | Snyderville | 21.0% | 19.4%(+1.62)#43 | 20.4%(+0.671)#7,649 |
| 44. | Rockville | 20.9% | 19.4%(+1.43)#44 | 20.4%(+0.484)#7,979 |
| 45. | Kamas | 20.7% | 19.4%(+1.28)#45 | 20.4%(+0.337)#8,204 |
| 46. | American Fork | 20.7% | 19.4%(+1.24)#46 | 20.4%(+0.299)#8,276 |
| 47. | Ogden | 20.6% | 19.4%(+1.19)#47 | 20.4%(+0.245)#8,379 |
| 48. | Santaquin | 20.6% | 19.4%(+1.18)#48 | 20.4%(+0.233)#8,400 |
| 49. | Orem | 20.6% | 19.4%(+1.16)#49 | 20.4%(+0.215)#8,448 |
| 50. | Bluffdale | 20.6% | 19.4%(+1.14)#50 | 20.4%(+0.194)#8,476 |
| 51. | Brighton | 20.5% | 19.4%(+1.12)#51 | 20.4%(+0.171)#8,508 |
| 52. | Sundance | 20.5% | 19.4%(+1.08)#52 | 20.4%(+0.137)#8,575 |
| 53. | Taylorsville | 20.5% | 19.4%(+1.06)#53 | 20.4%(+0.112)#8,626 |
| 54. | Heber | 20.4% | 19.4%(+0.995)#54 | 20.4%(+0.050)#8,727 |
| 55. | Santa Clara | 20.4% | 19.4%(+0.922)#55 | 20.4%(-0.023)#8,860 |
| 56. | Marriott Slaterville | 20.3% | 19.4%(+0.887)#56 | 20.4%(-0.058)#8,914 |
| 57. | Herriman | 20.3% | 19.4%(+0.851)#57 | 20.4%(-0.094)#8,987 |
| 58. | Lindon | 20.3% | 19.4%(+0.849)#58 | 20.4%(-0.096)#8,992 |
| 59. | Price | 20.3% | 19.4%(+0.836)#59 | 20.4%(-0.109)#9,018 |
| 60. | Copperton | 20.3% | 19.4%(+0.835)#60 | 20.4%(-0.110)#9,020 |
| 61. | West Valley City | 20.2% | 19.4%(+0.805)#61 | 20.4%(-0.140)#9,086 |
| 62. | Saratoga Springs | 20.2% | 19.4%(+0.784)#62 | 20.4%(-0.161)#9,123 |
| 63. | Hyrum | 20.2% | 19.4%(+0.730)#63 | 20.4%(-0.215)#9,230 |
| 64. | Springville | 20.1% | 19.4%(+0.702)#64 | 20.4%(-0.243)#9,282 |
| 65. | North Logan | 20.1% | 19.4%(+0.670)#65 | 20.4%(-0.276)#9,330 |
| 66. | Francis | 20.1% | 19.4%(+0.621)#66 | 20.4%(-0.324)#9,420 |
| 67. | Murray | 20.0% | 19.4%(+0.576)#67 | 20.4%(-0.369)#9,504 |
| 68. | Lyman | 20.0% | 19.4%(+0.570)#68 | 20.4%(-0.376)#9,514 |
| 69. | Spanish Fork | 19.9% | 19.4%(+0.512)#69 | 20.4%(-0.433)#9,617 |
| 70. | Roy | 19.9% | 19.4%(+0.508)#70 | 20.4%(-0.437)#9,629 |
| 71. | Payson | 19.9% | 19.4%(+0.489)#71 | 20.4%(-0.456)#9,654 |
| 72. | Cedar City | 19.9% | 19.4%(+0.472)#72 | 20.4%(-0.474)#9,689 |
| 73. | Spanish Valley | 19.8% | 19.4%(+0.345)#73 | 20.4%(-0.600)#9,943 |
| 74. | South Ogden | 19.7% | 19.4%(+0.317)#74 | 20.4%(-0.629)#9,991 |
| 75. | Mapleton | 19.7% | 19.4%(+0.250)#75 | 20.4%(-0.695)#10,121 |
| 76. | Green River | 19.7% | 19.4%(+0.241)#76 | 20.4%(-0.704)#10,139 |
| 77. | West Jordan | 19.6% | 19.4%(+0.206)#77 | 20.4%(-0.740)#10,221 |
| 78. | Woodland Hills | 19.6% | 19.4%(+0.124)#78 | 20.4%(-0.821)#10,391 |
| 79. | Salem | 19.5% | 19.4%(+0.086)#79 | 20.4%(-0.859)#10,486 |
| 80. | Elk Ridge | 19.5% | 19.4%(+0.035)#80 | 20.4%(-0.910)#10,589 |
| 81. | Enoch | 19.4% | 19.4%(-0.021)#81 | 20.4%(-0.966)#10,699 |
| 82. | Midway | 19.4% | 19.4%(-0.023)#82 | 20.4%(-0.968)#10,701 |
| 83. | Tremonton | 19.3% | 19.4%(-0.094)#83 | 20.4%(-1.04)#10,844 |
| 84. | Brigham City | 19.3% | 19.4%(-0.174)#84 | 20.4%(-1.12)#11,005 |
| 85. | Sterling | 19.2% | 19.4%(-0.181)#85 | 20.4%(-1.13)#11,019 |
| 86. | Mount Pleasant | 19.2% | 19.4%(-0.271)#86 | 20.4%(-1.22)#11,281 |
| 87. | Mountain Green | 19.1% | 19.4%(-0.325)#87 | 20.4%(-1.27)#11,392 |
| 88. | Farmington | 19.1% | 19.4%(-0.360)#88 | 20.4%(-1.31)#11,458 |
| 89. | Garland | 19.1% | 19.4%(-0.365)#89 | 20.4%(-1.31)#11,475 |
| 90. | North Salt Lake | 19.1% | 19.4%(-0.368)#90 | 20.4%(-1.31)#11,482 |
| 91. | Grantsville | 19.0% | 19.4%(-0.385)#91 | 20.4%(-1.33)#11,518 |
| 92. | Corinne | 19.0% | 19.4%(-0.395)#92 | 20.4%(-1.34)#11,537 |
| 93. | South Jordan | 19.0% | 19.4%(-0.452)#93 | 20.4%(-1.40)#11,636 |
| 94. | Pleasant Grove | 19.0% | 19.4%(-0.469)#94 | 20.4%(-1.41)#11,671 |
| 95. | Millcreek | 19.0% | 19.4%(-0.475)#95 | 20.4%(-1.42)#11,686 |
| 96. | Washington Terrace | 19.0% | 19.4%(-0.477)#96 | 20.4%(-1.42)#11,692 |
| 97. | Granite | 18.9% | 19.4%(-0.497)#97 | 20.4%(-1.44)#11,727 |
| 98. | Benjamin | 18.9% | 19.4%(-0.529)#98 | 20.4%(-1.47)#11,797 |
| 99. | Toquerville | 18.9% | 19.4%(-0.540)#99 | 20.4%(-1.48)#11,821 |
| 100. | Circleville | 18.7% | 19.4%(-0.682)#100 | 20.4%(-1.63)#12,105 |
Common Questions
What are the Top 10 Cities with the Highest Costs of Housing as Percentage of Income in Utah?
Top 10 Cities with the Highest Costs of Housing as Percentage of Income in Utah are:
#1
37.2%
#2
32.4%
#3
30.5%
#4
27.8%
#5
26.8%
#6
26.0%
#7
26.0%
#8
26.0%
#9
24.5%
#10
24.0%
What city has the Highest Costs of Housing as Percentage of Income in Utah?
Teasdale has the Highest Costs of Housing as Percentage of Income in Utah with 37.2%.
What is the Average Housing Costs as Percentage of Income in the State of Utah?
Average Housing Costs as Percentage of Income in Utah is 19.4%.
What is the Average Housing Costs as Percentage of Income in the United States?
Average Housing Costs as Percentage of Income in the United States is 20.4%.