Cities with the Highest Costs of Housing as Percentage of Income in Oklahoma
RELATED REPORTS & OPTIONS
Highest Housing Costs / Income
Oklahoma
Compare Cities
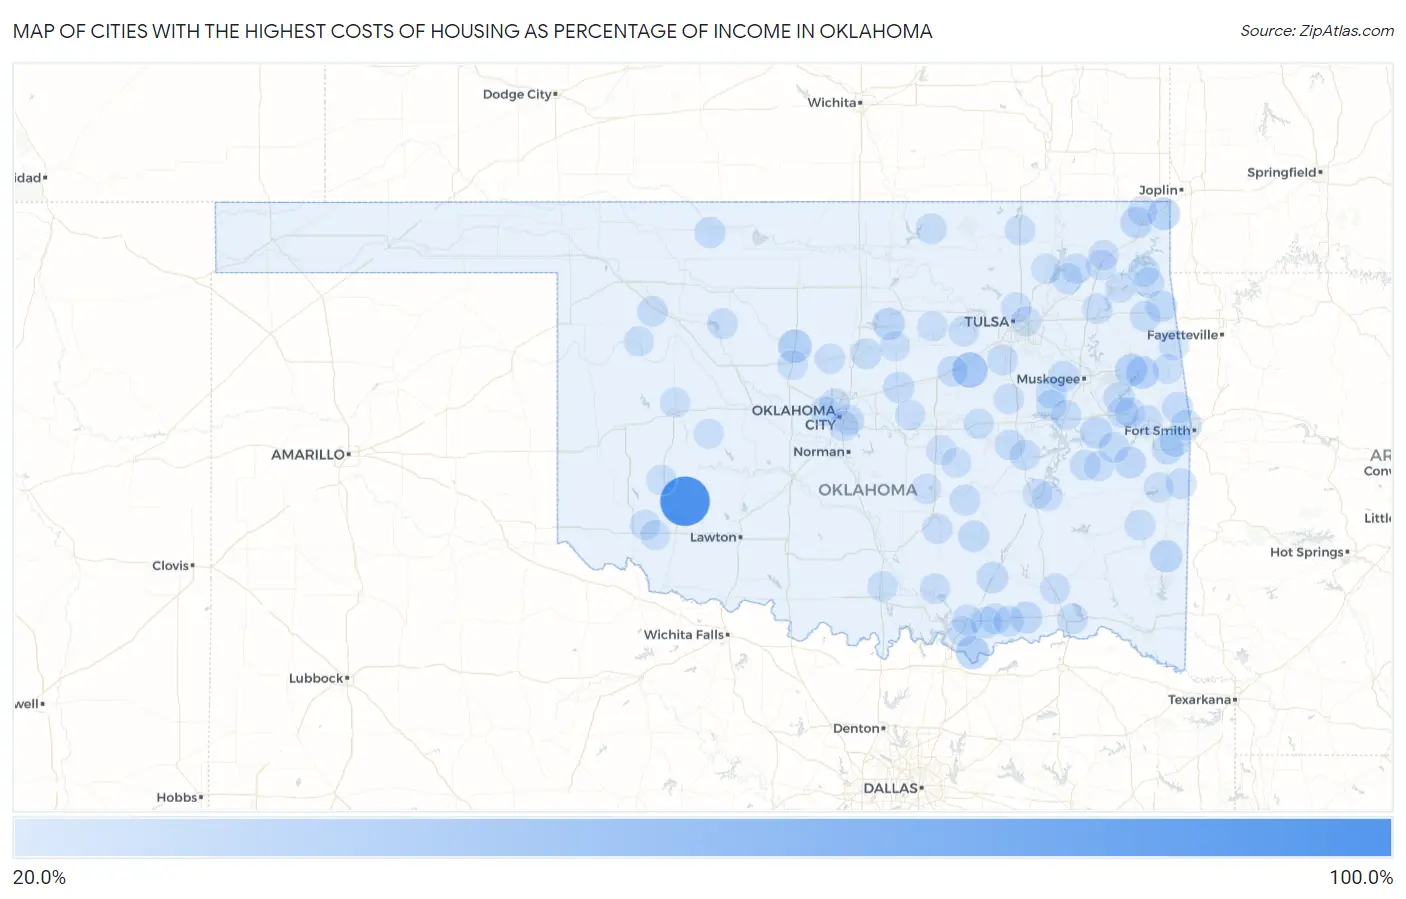
Map of Cities with the Highest Costs of Housing as Percentage of Income in Oklahoma
0.0%
100.0%
Cities with the Highest Costs of Housing as Percentage of Income in Oklahoma
| City | Housing Costs / Income | vs State | vs National | |
| 1. | Cooperton | 100.0% | 18.1%(+81.9)#1 | 20.4%(+79.6)#11 |
| 2. | Slick | 41.5% | 18.1%(+23.4)#2 | 20.4%(+21.1)#158 |
| 3. | Little | 37.3% | 18.1%(+19.2)#3 | 20.4%(+16.9)#282 |
| 4. | Dover | 34.1% | 18.1%(+16.0)#4 | 20.4%(+13.7)#465 |
| 5. | Leonard | 34.0% | 18.1%(+16.0)#5 | 20.4%(+13.7)#468 |
| 6. | Kemp | 33.6% | 18.1%(+15.5)#6 | 20.4%(+13.2)#505 |
| 7. | Tenkiller | 30.7% | 18.1%(+12.6)#7 | 20.4%(+10.3)#842 |
| 8. | Keys | 29.9% | 18.1%(+11.8)#8 | 20.4%(+9.48)#999 |
| 9. | Peoria | 29.4% | 18.1%(+11.4)#9 | 20.4%(+9.07)#1,084 |
| 10. | Smithville | 28.9% | 18.1%(+10.8)#10 | 20.4%(+8.51)#1,211 |
| 11. | Stillwater | 28.8% | 18.1%(+10.7)#11 | 20.4%(+8.43)#1,233 |
| 12. | Lake Ellsworth Addition | 28.4% | 18.1%(+10.4)#12 | 20.4%(+8.06)#1,341 |
| 13. | Mccurtain | 27.5% | 18.1%(+9.44)#13 | 20.4%(+7.14)#1,679 |
| 14. | Boswell | 27.5% | 18.1%(+9.41)#14 | 20.4%(+7.11)#1,689 |
| 15. | Porum | 27.5% | 18.1%(+9.40)#15 | 20.4%(+7.09)#1,697 |
| 16. | Dotyville | 26.6% | 18.1%(+8.55)#16 | 20.4%(+6.24)#2,082 |
| 17. | Tushka | 26.4% | 18.1%(+8.38)#17 | 20.4%(+6.07)#2,164 |
| 18. | Colcord | 25.9% | 18.1%(+7.87)#18 | 20.4%(+5.56)#2,435 |
| 19. | Centrahoma | 25.8% | 18.1%(+7.69)#19 | 20.4%(+5.38)#2,551 |
| 20. | Watova | 25.6% | 18.1%(+7.53)#20 | 20.4%(+5.23)#2,664 |
| 21. | Spiro | 25.5% | 18.1%(+7.45)#21 | 20.4%(+5.14)#2,709 |
| 22. | Blue | 25.4% | 18.1%(+7.31)#22 | 20.4%(+5.00)#2,788 |
| 23. | Warwick | 25.1% | 18.1%(+7.04)#23 | 20.4%(+4.73)#2,972 |
| 24. | Zena | 24.9% | 18.1%(+6.82)#24 | 20.4%(+4.52)#3,145 |
| 25. | Fort Coffee | 24.6% | 18.1%(+6.54)#25 | 20.4%(+4.24)#3,358 |
| 26. | Alva | 24.4% | 18.1%(+6.36)#26 | 20.4%(+4.05)#3,499 |
| 27. | Belfonte | 24.4% | 18.1%(+6.31)#27 | 20.4%(+4.01)#3,547 |
| 28. | Boynton | 24.2% | 18.1%(+6.12)#28 | 20.4%(+3.82)#3,712 |
| 29. | Stigler | 24.0% | 18.1%(+5.96)#29 | 20.4%(+3.65)#3,854 |
| 30. | Paradise Hill | 23.9% | 18.1%(+5.86)#30 | 20.4%(+3.56)#3,919 |
| 31. | Mounds | 23.8% | 18.1%(+5.78)#31 | 20.4%(+3.47)#4,007 |
| 32. | Webb City | 23.8% | 18.1%(+5.78)#32 | 20.4%(+3.47)#4,014 |
| 33. | Taft | 23.8% | 18.1%(+5.69)#33 | 20.4%(+3.38)#4,092 |
| 34. | Moffett | 23.7% | 18.1%(+5.60)#34 | 20.4%(+3.29)#4,197 |
| 35. | Twin Oaks | 23.6% | 18.1%(+5.58)#35 | 20.4%(+3.27)#4,216 |
| 36. | Allen | 23.6% | 18.1%(+5.57)#36 | 20.4%(+3.26)#4,224 |
| 37. | Langston | 23.6% | 18.1%(+5.52)#37 | 20.4%(+3.21)#4,276 |
| 38. | Longdale | 23.6% | 18.1%(+5.49)#38 | 20.4%(+3.18)#4,305 |
| 39. | Council Hill | 23.5% | 18.1%(+5.46)#39 | 20.4%(+3.15)#4,336 |
| 40. | Olive | 23.4% | 18.1%(+5.34)#40 | 20.4%(+3.04)#4,458 |
| 41. | Depew | 23.4% | 18.1%(+5.30)#41 | 20.4%(+2.99)#4,493 |
| 42. | Bokchito | 23.3% | 18.1%(+5.22)#42 | 20.4%(+2.92)#4,577 |
| 43. | Carlisle | 23.3% | 18.1%(+5.19)#43 | 20.4%(+2.88)#4,605 |
| 44. | Mutual | 23.2% | 18.1%(+5.09)#44 | 20.4%(+2.79)#4,707 |
| 45. | Quinton | 23.2% | 18.1%(+5.09)#45 | 20.4%(+2.78)#4,709 |
| 46. | Whitesboro | 23.1% | 18.1%(+5.01)#46 | 20.4%(+2.71)#4,799 |
| 47. | Durant | 23.0% | 18.1%(+4.89)#47 | 20.4%(+2.58)#4,957 |
| 48. | Bennington | 22.9% | 18.1%(+4.84)#48 | 20.4%(+2.54)#5,013 |
| 49. | Hugo | 22.9% | 18.1%(+4.78)#49 | 20.4%(+2.48)#5,079 |
| 50. | Bushyhead | 22.8% | 18.1%(+4.72)#50 | 20.4%(+2.41)#5,163 |
| 51. | Dustin | 22.7% | 18.1%(+4.65)#51 | 20.4%(+2.35)#5,239 |
| 52. | Monroe | 22.7% | 18.1%(+4.62)#52 | 20.4%(+2.31)#5,305 |
| 53. | Jay | 22.7% | 18.1%(+4.60)#53 | 20.4%(+2.30)#5,320 |
| 54. | Hanna | 22.7% | 18.1%(+4.60)#54 | 20.4%(+2.29)#5,327 |
| 55. | Del City | 22.7% | 18.1%(+4.59)#55 | 20.4%(+2.28)#5,342 |
| 56. | Big Cabin | 22.5% | 18.1%(+4.45)#56 | 20.4%(+2.14)#5,501 |
| 57. | Turley | 22.2% | 18.1%(+4.17)#57 | 20.4%(+1.86)#5,867 |
| 58. | Friendship | 22.1% | 18.1%(+4.03)#58 | 20.4%(+1.72)#6,067 |
| 59. | Lawrence Creek | 22.1% | 18.1%(+4.02)#59 | 20.4%(+1.71)#6,080 |
| 60. | Ada | 22.0% | 18.1%(+3.94)#60 | 20.4%(+1.64)#6,187 |
| 61. | Chelsea | 22.0% | 18.1%(+3.91)#61 | 20.4%(+1.61)#6,233 |
| 62. | Sportsmen Acres | 22.0% | 18.1%(+3.89)#62 | 20.4%(+1.58)#6,268 |
| 63. | Okmulgee | 22.0% | 18.1%(+3.89)#63 | 20.4%(+1.58)#6,270 |
| 64. | Tishomingo | 21.9% | 18.1%(+3.86)#64 | 20.4%(+1.56)#6,309 |
| 65. | Reagan | 21.9% | 18.1%(+3.80)#65 | 20.4%(+1.49)#6,404 |
| 66. | Dewey | 21.8% | 18.1%(+3.73)#66 | 20.4%(+1.42)#6,500 |
| 67. | Cimarron City | 21.8% | 18.1%(+3.71)#67 | 20.4%(+1.40)#6,526 |
| 68. | Westville | 21.6% | 18.1%(+3.57)#68 | 20.4%(+1.27)#6,710 |
| 69. | Checotah | 21.6% | 18.1%(+3.54)#69 | 20.4%(+1.23)#6,765 |
| 70. | Meeker | 21.6% | 18.1%(+3.48)#70 | 20.4%(+1.18)#6,837 |
| 71. | Antlers | 21.5% | 18.1%(+3.43)#71 | 20.4%(+1.12)#6,933 |
| 72. | Vian | 21.5% | 18.1%(+3.41)#72 | 20.4%(+1.10)#6,961 |
| 73. | Camargo | 21.5% | 18.1%(+3.41)#73 | 20.4%(+1.10)#6,965 |
| 74. | Okemah | 21.4% | 18.1%(+3.36)#74 | 20.4%(+1.06)#7,030 |
| 75. | Ardmore | 21.4% | 18.1%(+3.35)#75 | 20.4%(+1.05)#7,043 |
| 76. | The Village | 21.3% | 18.1%(+3.26)#76 | 20.4%(+0.950)#7,186 |
| 77. | Calera | 21.3% | 18.1%(+3.25)#77 | 20.4%(+0.948)#7,194 |
| 78. | Hobart | 21.3% | 18.1%(+3.24)#78 | 20.4%(+0.932)#7,220 |
| 79. | Yale | 21.3% | 18.1%(+3.23)#79 | 20.4%(+0.921)#7,239 |
| 80. | Arapaho | 21.3% | 18.1%(+3.23)#80 | 20.4%(+0.919)#7,242 |
| 81. | Colony | 21.3% | 18.1%(+3.22)#81 | 20.4%(+0.918)#7,245 |
| 82. | Seminole | 21.3% | 18.1%(+3.19)#82 | 20.4%(+0.885)#7,295 |
| 83. | Perkins | 21.2% | 18.1%(+3.17)#83 | 20.4%(+0.861)#7,341 |
| 84. | Konawa | 21.2% | 18.1%(+3.16)#84 | 20.4%(+0.859)#7,346 |
| 85. | Kingfisher | 21.1% | 18.1%(+3.04)#85 | 20.4%(+0.731)#7,538 |
| 86. | Spavinaw | 21.1% | 18.1%(+3.03)#86 | 20.4%(+0.728)#7,544 |
| 87. | Vinita | 21.1% | 18.1%(+3.00)#87 | 20.4%(+0.691)#7,622 |
| 88. | Commerce | 21.0% | 18.1%(+2.88)#88 | 20.4%(+0.578)#7,813 |
| 89. | Wister | 21.0% | 18.1%(+2.88)#89 | 20.4%(+0.577)#7,818 |
| 90. | Kinta | 20.9% | 18.1%(+2.82)#90 | 20.4%(+0.509)#7,942 |
| 91. | Sallisaw | 20.9% | 18.1%(+2.78)#91 | 20.4%(+0.478)#7,987 |
| 92. | Valley Brook | 20.8% | 18.1%(+2.75)#92 | 20.4%(+0.440)#8,035 |
| 93. | Headrick | 20.8% | 18.1%(+2.74)#93 | 20.4%(+0.430)#8,050 |
| 94. | Wewoka | 20.8% | 18.1%(+2.72)#94 | 20.4%(+0.410)#8,078 |
| 95. | Tulsa | 20.8% | 18.1%(+2.71)#95 | 20.4%(+0.405)#8,090 |
| 96. | Alderson | 20.7% | 18.1%(+2.66)#96 | 20.4%(+0.351)#8,177 |
| 97. | Bethany | 20.7% | 18.1%(+2.63)#97 | 20.4%(+0.326)#8,223 |
| 98. | Mcalester | 20.7% | 18.1%(+2.59)#98 | 20.4%(+0.284)#8,296 |
| 99. | Talala | 20.6% | 18.1%(+2.58)#99 | 20.4%(+0.271)#8,321 |
| 100. | Stilwell | 20.6% | 18.1%(+2.57)#100 | 20.4%(+0.262)#8,347 |
Common Questions
What are the Top 10 Cities with the Highest Costs of Housing as Percentage of Income in Oklahoma?
Top 10 Cities with the Highest Costs of Housing as Percentage of Income in Oklahoma are:
#1
100.0%
#2
41.5%
#3
34.1%
#4
33.6%
#5
30.7%
#6
29.9%
#7
29.4%
#8
28.9%
#9
28.8%
#10
27.5%
What city has the Highest Costs of Housing as Percentage of Income in Oklahoma?
Cooperton has the Highest Costs of Housing as Percentage of Income in Oklahoma with 100.0%.
What is the Average Housing Costs as Percentage of Income in the State of Oklahoma?
Average Housing Costs as Percentage of Income in Oklahoma is 18.1%.
What is the Average Housing Costs as Percentage of Income in the United States?
Average Housing Costs as Percentage of Income in the United States is 20.4%.