Cities with the Highest Costs of Housing as Percentage of Income in Rhode Island
RELATED REPORTS & OPTIONS
Highest Housing Costs / Income
Rhode Island
Compare Cities
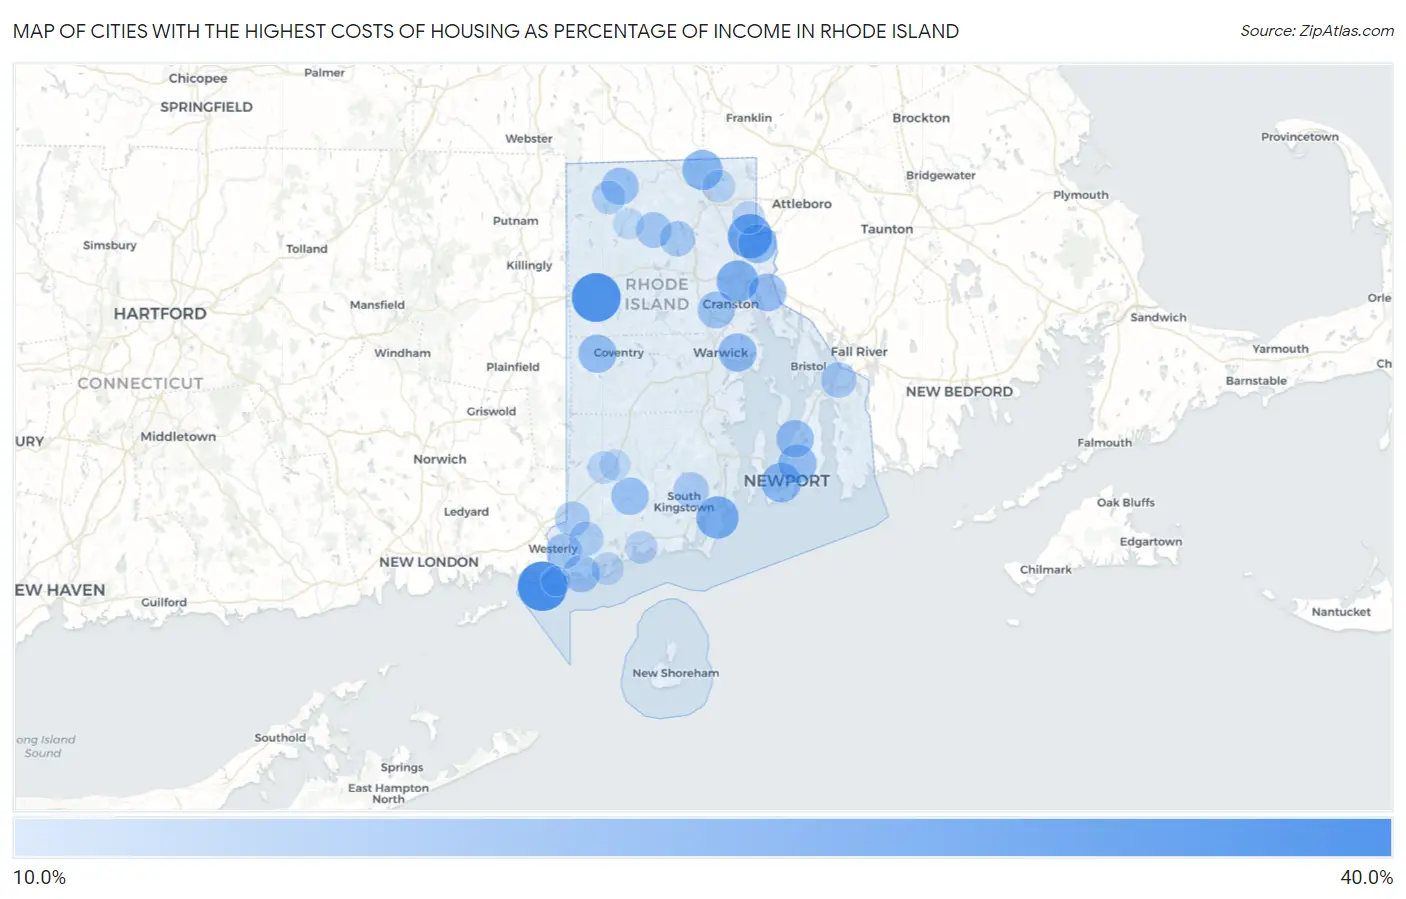
Map of Cities with the Highest Costs of Housing as Percentage of Income in Rhode Island
0.0%
40.0%
Cities with the Highest Costs of Housing as Percentage of Income in Rhode Island
| City | Housing Costs / Income | vs State | vs National | |
| 1. | Watch Hill | 36.0% | 21.4%(+14.6)#1 | 20.4%(+15.6)#351 |
| 2. | Foster Center | 35.2% | 21.4%(+13.8)#2 | 20.4%(+14.8)#390 |
| 3. | Central Falls | 30.0% | 21.4%(+8.59)#3 | 20.4%(+9.62)#976 |
| 4. | Narragansett Pier | 27.6% | 21.4%(+6.15)#4 | 20.4%(+7.18)#1,665 |
| 5. | Providence | 26.8% | 21.4%(+5.37)#5 | 20.4%(+6.40)#2,003 |
| 6. | Woonsocket | 25.0% | 21.4%(+3.62)#6 | 20.4%(+4.64)#3,042 |
| 7. | Newport | 24.4% | 21.4%(+3.02)#7 | 20.4%(+4.04)#3,506 |
| 8. | Pawtucket | 23.2% | 21.4%(+1.84)#8 | 20.4%(+2.86)#4,624 |
| 9. | Newport East | 23.0% | 21.4%(+1.63)#9 | 20.4%(+2.66)#4,861 |
| 10. | Greene | 22.8% | 21.4%(+1.37)#10 | 20.4%(+2.40)#5,185 |
| 11. | Warwick | 22.7% | 21.4%(+1.32)#11 | 20.4%(+2.35)#5,240 |
| 12. | East Providence | 22.4% | 21.4%(+1.02)#12 | 20.4%(+2.04)#5,627 |
| 13. | Melville | 22.1% | 21.4%(+0.719)#13 | 20.4%(+1.74)#6,031 |
| 14. | Carolina | 21.8% | 21.4%(+0.428)#14 | 20.4%(+1.45)#6,461 |
| 15. | Weekapaug | 21.8% | 21.4%(+0.420)#15 | 20.4%(+1.44)#6,473 |
| 16. | Harrisville | 21.5% | 21.4%(+0.115)#16 | 20.4%(+1.14)#6,913 |
| 17. | Cranston | 21.4% | 21.4%(-0.004)#17 | 20.4%(+1.02)#7,079 |
| 18. | Westerly | 19.9% | 21.4%(-1.50)#18 | 20.4%(-0.474)#9,688 |
| 19. | Harmony | 19.9% | 21.4%(-1.51)#19 | 20.4%(-0.490)#9,719 |
| 20. | Kingston | 19.6% | 21.4%(-1.84)#20 | 20.4%(-0.819)#10,386 |
| 21. | Greenville | 19.5% | 21.4%(-1.86)#21 | 20.4%(-0.836)#10,426 |
| 22. | Tiverton | 19.4% | 21.4%(-2.00)#22 | 20.4%(-0.975)#10,715 |
| 23. | Wakefield-Peace Dale | 19.0% | 21.4%(-2.38)#23 | 20.4%(-1.36)#11,571 |
| 24. | Ashaway | 18.8% | 21.4%(-2.55)#24 | 20.4%(-1.53)#11,899 |
| 25. | Bradford | 18.5% | 21.4%(-2.90)#25 | 20.4%(-1.87)#12,669 |
| 26. | Pascoag | 17.6% | 21.4%(-3.82)#26 | 20.4%(-2.80)#14,754 |
| 27. | Cumberland Hill | 16.9% | 21.4%(-4.50)#27 | 20.4%(-3.48)#16,267 |
| 28. | Valley Falls | 16.7% | 21.4%(-4.70)#28 | 20.4%(-3.67)#16,670 |
| 29. | Charlestown | 16.4% | 21.4%(-5.01)#29 | 20.4%(-3.99)#17,395 |
| 30. | Hope Valley | 16.3% | 21.4%(-5.09)#30 | 20.4%(-4.07)#17,564 |
| 31. | Quonochontaug | 16.3% | 21.4%(-5.13)#31 | 20.4%(-4.10)#17,660 |
| 32. | Wyoming | 15.2% | 21.4%(-6.22)#32 | 20.4%(-5.20)#19,919 |
| 33. | Chepachet | 15.0% | 21.4%(-6.44)#33 | 20.4%(-5.41)#20,322 |
| 34. | Misquamicut | 13.6% | 21.4%(-7.83)#34 | 20.4%(-6.80)#22,638 |
1
Common Questions
What are the Top 10 Cities with the Highest Costs of Housing as Percentage of Income in Rhode Island?
Top 10 Cities with the Highest Costs of Housing as Percentage of Income in Rhode Island are:
#1
36.0%
#2
35.2%
#3
30.0%
#4
27.6%
#5
26.8%
#6
25.0%
#7
24.4%
#8
23.2%
#9
23.0%
#10
22.8%
What city has the Highest Costs of Housing as Percentage of Income in Rhode Island?
Watch Hill has the Highest Costs of Housing as Percentage of Income in Rhode Island with 36.0%.
What is the Average Housing Costs as Percentage of Income in the State of Rhode Island?
Average Housing Costs as Percentage of Income in Rhode Island is 21.4%.
What is the Average Housing Costs as Percentage of Income in the United States?
Average Housing Costs as Percentage of Income in the United States is 20.4%.