Cities with the Highest Costs of Housing as Percentage of Income in Nebraska
RELATED REPORTS & OPTIONS
Highest Housing Costs / Income
Nebraska
Compare Cities
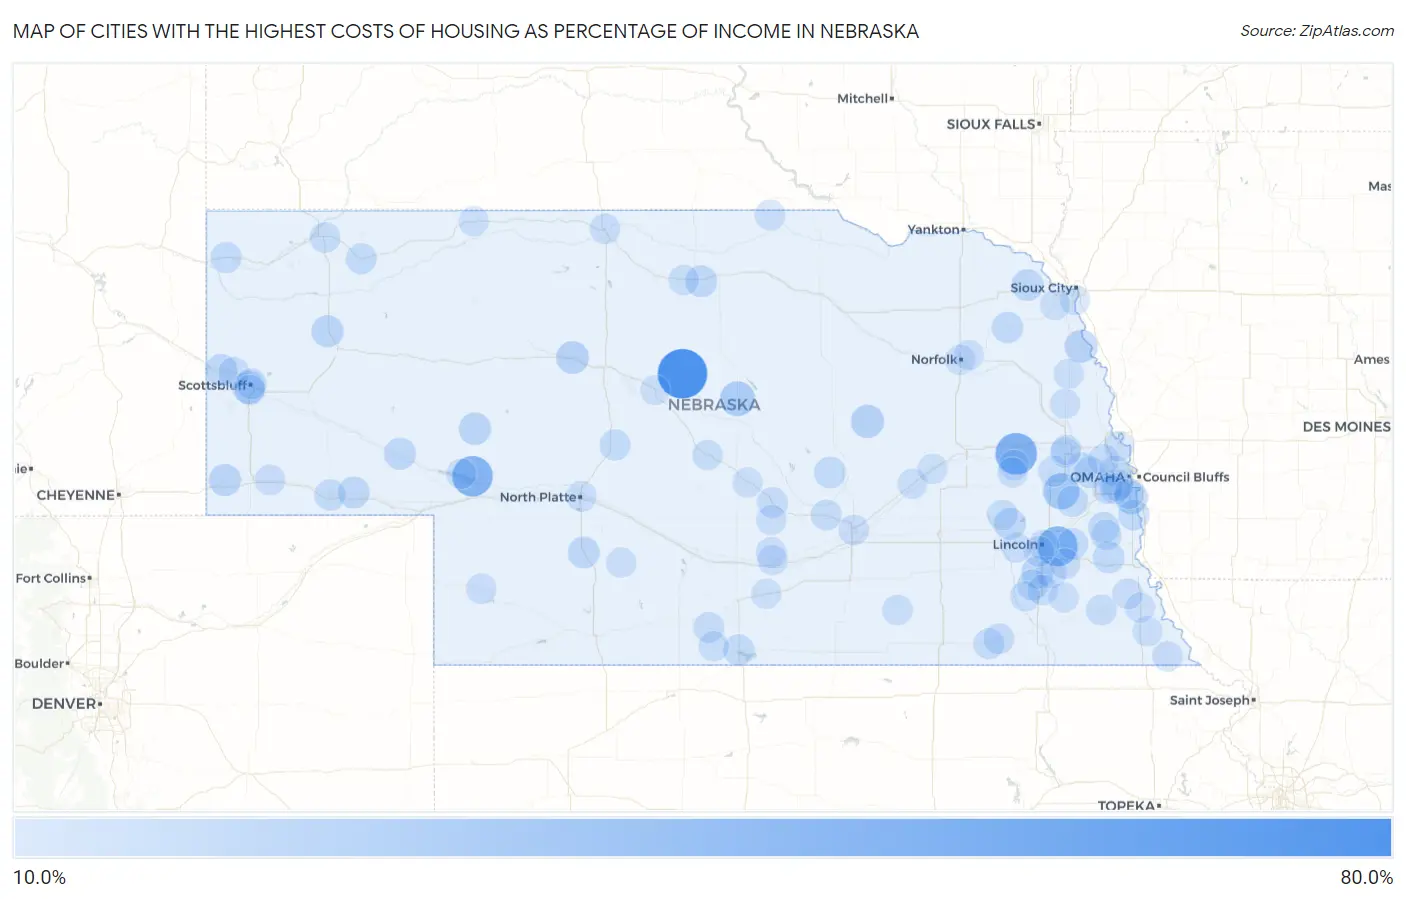
Map of Cities with the Highest Costs of Housing as Percentage of Income in Nebraska
0.0%
80.0%
Cities with the Highest Costs of Housing as Percentage of Income in Nebraska
| City | Housing Costs / Income | vs State | vs National | |
| 1. | Brewster | 77.5% | 17.9%(+59.6)#1 | 20.4%(+57.1)#24 |
| 2. | Linwood | 52.6% | 17.9%(+34.7)#2 | 20.4%(+32.2)#70 |
| 3. | Martin | 49.7% | 17.9%(+31.8)#3 | 20.4%(+29.3)#81 |
| 4. | Walton | 48.0% | 17.9%(+30.1)#4 | 20.4%(+27.6)#89 |
| 5. | Ithaca | 35.9% | 17.9%(+18.0)#5 | 20.4%(+15.5)#355 |
| 6. | Taylor | 31.7% | 17.9%(+13.8)#6 | 20.4%(+11.3)#701 |
| 7. | Primrose | 26.8% | 17.9%(+8.86)#7 | 20.4%(+6.40)#1,999 |
| 8. | Offutt Afb | 26.7% | 17.9%(+8.74)#8 | 20.4%(+6.28)#2,064 |
| 9. | Macy | 26.3% | 17.9%(+8.42)#9 | 20.4%(+5.96)#2,221 |
| 10. | Terrytown | 26.3% | 17.9%(+8.37)#10 | 20.4%(+5.91)#2,245 |
| 11. | Seneca | 25.8% | 17.9%(+7.88)#11 | 20.4%(+5.43)#2,526 |
| 12. | Arthur | 24.5% | 17.9%(+6.56)#12 | 20.4%(+4.11)#3,455 |
| 13. | Sprague | 24.5% | 17.9%(+6.54)#13 | 20.4%(+4.08)#3,473 |
| 14. | Bushnell | 24.0% | 17.9%(+6.08)#14 | 20.4%(+3.62)#3,868 |
| 15. | Berea | 24.0% | 17.9%(+6.07)#15 | 20.4%(+3.62)#3,876 |
| 16. | Morrill | 23.5% | 17.9%(+5.57)#16 | 20.4%(+3.11)#4,386 |
| 17. | Garland | 23.4% | 17.9%(+5.46)#17 | 20.4%(+3.00)#4,481 |
| 18. | Oshkosh | 23.3% | 17.9%(+5.43)#18 | 20.4%(+2.97)#4,519 |
| 19. | Long Pine | 23.1% | 17.9%(+5.13)#19 | 20.4%(+2.68)#4,830 |
| 20. | Wellfleet | 22.8% | 17.9%(+4.91)#20 | 20.4%(+2.45)#5,107 |
| 21. | Sunol | 22.7% | 17.9%(+4.83)#21 | 20.4%(+2.37)#5,215 |
| 22. | Martinsburg | 22.7% | 17.9%(+4.80)#22 | 20.4%(+2.34)#5,246 |
| 23. | Otoe | 22.5% | 17.9%(+4.58)#23 | 20.4%(+2.13)#5,518 |
| 24. | Ralston | 22.5% | 17.9%(+4.54)#24 | 20.4%(+2.08)#5,566 |
| 25. | Elba | 22.3% | 17.9%(+4.33)#25 | 20.4%(+1.88)#5,847 |
| 26. | Wayne | 21.9% | 17.9%(+3.98)#26 | 20.4%(+1.52)#6,354 |
| 27. | Sidney | 21.2% | 17.9%(+3.31)#27 | 20.4%(+0.849)#7,361 |
| 28. | Manley | 21.1% | 17.9%(+3.23)#28 | 20.4%(+0.769)#7,480 |
| 29. | Alma | 21.1% | 17.9%(+3.17)#29 | 20.4%(+0.718)#7,561 |
| 30. | Waterloo | 21.0% | 17.9%(+3.05)#30 | 20.4%(+0.597)#7,780 |
| 31. | Eagle | 21.0% | 17.9%(+3.03)#31 | 20.4%(+0.577)#7,814 |
| 32. | Memphis | 20.9% | 17.9%(+2.99)#32 | 20.4%(+0.539)#7,895 |
| 33. | Gandy | 20.7% | 17.9%(+2.83)#33 | 20.4%(+0.372)#8,146 |
| 34. | Hay Springs | 20.7% | 17.9%(+2.75)#34 | 20.4%(+0.293)#8,286 |
| 35. | Harrison | 20.6% | 17.9%(+2.72)#35 | 20.4%(+0.268)#8,332 |
| 36. | Plattsmouth | 20.6% | 17.9%(+2.65)#36 | 20.4%(+0.191)#8,479 |
| 37. | Omaha | 20.4% | 17.9%(+2.52)#37 | 20.4%(+0.068)#8,692 |
| 38. | Mitchell | 20.4% | 17.9%(+2.46)#38 | 20.4%(-0.001)#8,823 |
| 39. | Hickman | 20.3% | 17.9%(+2.41)#39 | 20.4%(-0.046)#8,895 |
| 40. | Bennington | 20.2% | 17.9%(+2.25)#40 | 20.4%(-0.211)#9,224 |
| 41. | Oxford | 20.1% | 17.9%(+2.19)#41 | 20.4%(-0.265)#9,314 |
| 42. | Hallam | 19.9% | 17.9%(+1.95)#42 | 20.4%(-0.502)#9,739 |
| 43. | Colon | 19.8% | 17.9%(+1.91)#43 | 20.4%(-0.547)#9,830 |
| 44. | Cairo | 19.8% | 17.9%(+1.91)#44 | 20.4%(-0.550)#9,837 |
| 45. | Chadron | 19.8% | 17.9%(+1.89)#45 | 20.4%(-0.565)#9,875 |
| 46. | Scottsbluff | 19.8% | 17.9%(+1.89)#46 | 20.4%(-0.571)#9,886 |
| 47. | Tecumseh | 19.7% | 17.9%(+1.76)#47 | 20.4%(-0.694)#10,120 |
| 48. | La Vista | 19.7% | 17.9%(+1.76)#48 | 20.4%(-0.697)#10,124 |
| 49. | Hazard | 19.7% | 17.9%(+1.75)#49 | 20.4%(-0.703)#10,137 |
| 50. | Fairbury | 19.6% | 17.9%(+1.73)#50 | 20.4%(-0.728)#10,193 |
| 51. | Weeping Water | 19.6% | 17.9%(+1.66)#51 | 20.4%(-0.800)#10,330 |
| 52. | Jansen | 19.6% | 17.9%(+1.64)#52 | 20.4%(-0.813)#10,372 |
| 53. | Bennet | 19.5% | 17.9%(+1.62)#53 | 20.4%(-0.840)#10,439 |
| 54. | Naper | 19.5% | 17.9%(+1.58)#54 | 20.4%(-0.880)#10,525 |
| 55. | Chalco | 19.5% | 17.9%(+1.56)#55 | 20.4%(-0.894)#10,555 |
| 56. | Lincoln | 19.4% | 17.9%(+1.50)#56 | 20.4%(-0.955)#10,676 |
| 57. | Valley | 19.4% | 17.9%(+1.49)#57 | 20.4%(-0.968)#10,702 |
| 58. | Falls City | 19.4% | 17.9%(+1.47)#58 | 20.4%(-0.983)#10,728 |
| 59. | Edgar | 19.3% | 17.9%(+1.43)#59 | 20.4%(-1.03)#10,820 |
| 60. | Dix | 19.3% | 17.9%(+1.37)#60 | 20.4%(-1.08)#10,928 |
| 61. | North Platte | 19.3% | 17.9%(+1.36)#61 | 20.4%(-1.10)#10,958 |
| 62. | Valentine | 19.2% | 17.9%(+1.30)#62 | 20.4%(-1.15)#11,070 |
| 63. | Glenwood | 19.1% | 17.9%(+1.23)#63 | 20.4%(-1.23)#11,297 |
| 64. | Grand Island | 19.1% | 17.9%(+1.22)#64 | 20.4%(-1.24)#11,323 |
| 65. | Brock | 19.1% | 17.9%(+1.20)#65 | 20.4%(-1.25)#11,358 |
| 66. | Imperial | 18.9% | 17.9%(+1.00)#66 | 20.4%(-1.45)#11,748 |
| 67. | Broken Bow | 18.9% | 17.9%(+0.994)#67 | 20.4%(-1.46)#11,771 |
| 68. | Bee | 18.9% | 17.9%(+0.980)#68 | 20.4%(-1.48)#11,806 |
| 69. | Cortland | 18.9% | 17.9%(+0.945)#69 | 20.4%(-1.51)#11,873 |
| 70. | Ainsworth | 18.8% | 17.9%(+0.872)#70 | 20.4%(-1.58)#12,013 |
| 71. | Abie | 18.7% | 17.9%(+0.791)#71 | 20.4%(-1.66)#12,183 |
| 72. | Yankee Hill | 18.7% | 17.9%(+0.749)#72 | 20.4%(-1.71)#12,285 |
| 73. | Stamford | 18.6% | 17.9%(+0.683)#73 | 20.4%(-1.77)#12,429 |
| 74. | Pleasant Dale | 18.6% | 17.9%(+0.635)#74 | 20.4%(-1.82)#12,540 |
| 75. | Moorefield | 18.5% | 17.9%(+0.620)#75 | 20.4%(-1.84)#12,576 |
| 76. | Bellevue | 18.5% | 17.9%(+0.568)#76 | 20.4%(-1.89)#12,695 |
| 77. | Axtell | 18.5% | 17.9%(+0.539)#77 | 20.4%(-1.92)#12,771 |
| 78. | Clarks | 18.4% | 17.9%(+0.507)#78 | 20.4%(-1.95)#12,842 |
| 79. | Adams | 18.4% | 17.9%(+0.496)#79 | 20.4%(-1.96)#12,879 |
| 80. | Clatonia | 18.4% | 17.9%(+0.493)#80 | 20.4%(-1.96)#12,885 |
| 81. | Gering | 18.4% | 17.9%(+0.461)#81 | 20.4%(-1.99)#12,944 |
| 82. | Uehling | 18.4% | 17.9%(+0.454)#82 | 20.4%(-2.00)#12,962 |
| 83. | Norfolk | 18.4% | 17.9%(+0.432)#83 | 20.4%(-2.02)#13,014 |
| 84. | Stella | 18.3% | 17.9%(+0.391)#84 | 20.4%(-2.07)#13,108 |
| 85. | Pleasanton | 18.3% | 17.9%(+0.386)#85 | 20.4%(-2.07)#13,126 |
| 86. | Kearney | 18.3% | 17.9%(+0.374)#86 | 20.4%(-2.08)#13,154 |
| 87. | Fort Calhoun | 18.3% | 17.9%(+0.373)#87 | 20.4%(-2.08)#13,157 |
| 88. | Mason City | 18.3% | 17.9%(+0.356)#88 | 20.4%(-2.10)#13,190 |
| 89. | Dunning | 18.3% | 17.9%(+0.338)#89 | 20.4%(-2.12)#13,232 |
| 90. | Inglewood | 18.3% | 17.9%(+0.333)#90 | 20.4%(-2.12)#13,246 |
| 91. | Fremont | 18.2% | 17.9%(+0.324)#91 | 20.4%(-2.13)#13,271 |
| 92. | Bruno | 18.2% | 17.9%(+0.299)#92 | 20.4%(-2.16)#13,327 |
| 93. | Dakota City | 18.2% | 17.9%(+0.289)#93 | 20.4%(-2.17)#13,348 |
| 94. | Lyons | 18.2% | 17.9%(+0.277)#94 | 20.4%(-2.18)#13,373 |
| 95. | Hubbard | 18.2% | 17.9%(+0.266)#95 | 20.4%(-2.19)#13,402 |
| 96. | Merriman | 18.2% | 17.9%(+0.260)#96 | 20.4%(-2.20)#13,416 |
| 97. | Silver Creek | 18.2% | 17.9%(+0.250)#97 | 20.4%(-2.21)#13,440 |
| 98. | Woodland Park | 18.1% | 17.9%(+0.226)#98 | 20.4%(-2.23)#13,497 |
| 99. | Lemoyne | 18.1% | 17.9%(+0.206)#99 | 20.4%(-2.25)#13,533 |
| 100. | Auburn | 18.1% | 17.9%(+0.152)#100 | 20.4%(-2.30)#13,647 |
Common Questions
What are the Top 10 Cities with the Highest Costs of Housing as Percentage of Income in Nebraska?
Top 10 Cities with the Highest Costs of Housing as Percentage of Income in Nebraska are:
What city has the Highest Costs of Housing as Percentage of Income in Nebraska?
Brewster has the Highest Costs of Housing as Percentage of Income in Nebraska with 77.5%.
What is the Average Housing Costs as Percentage of Income in the State of Nebraska?
Average Housing Costs as Percentage of Income in Nebraska is 17.9%.
What is the Average Housing Costs as Percentage of Income in the United States?
Average Housing Costs as Percentage of Income in the United States is 20.4%.