Angels, CA Map & Demographics
Angels Map
Angels Overview
$32,304
PER CAPITA INCOME
$59,808
AVG FAMILY INCOME
$55,147
AVG HOUSEHOLD INCOME
51.0%
WAGE / INCOME GAP [ % ]
49.0¢/ $1
WAGE / INCOME GAP [ $ ]
0.43
INEQUALITY / GINI INDEX
3,714
TOTAL POPULATION
1,649
MALE POPULATION
2,065
FEMALE POPULATION
79.85
MALES / 100 FEMALES
125.23
FEMALES / 100 MALES
54.3
MEDIAN AGE
2.8
AVG FAMILY SIZE
2.3
AVG HOUSEHOLD SIZE
1,476
LABOR FORCE [ PEOPLE ]
46.3%
PERCENT IN LABOR FORCE
6.9%
UNEMPLOYMENT RATE
Income in Angels
Income Overview in Angels
Per Capita Income in Angels is $32,304, while median incomes of families and households are $59,808 and $55,147 respectively.
| Characteristic | Number | Measure |
| Per Capita Income | 3,714 | $32,304 |
| Median Family Income | 1,114 | $59,808 |
| Mean Family Income | 1,114 | $87,177 |
| Median Household Income | 1,576 | $55,147 |
| Mean Household Income | 1,576 | $73,003 |
| Income Deficit | 1,114 | $0 |
| Wage / Income Gap (%) | 3,714 | 50.96% |
| Wage / Income Gap ($) | 3,714 | 49.04¢ per $1 |
| Gini / Inequality Index | 3,714 | 0.43 |
Earnings by Sex in Angels
Average Earnings in Angels are $30,606, $46,032 for men and $22,572 for women, a difference of 51.0%.
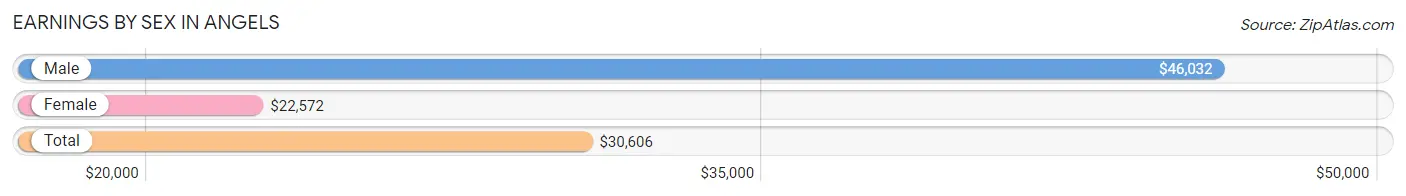
| Sex | Number | Average Earnings |
| Male | 563 (37.8%) | $46,032 |
| Female | 927 (62.2%) | $22,572 |
| Total | 1,490 (100.0%) | $30,606 |
Earnings by Sex by Income Bracket in Angels
The most common earnings brackets in Angels are $100,000+ for men (115 | 20.4%) and $25,000 to $29,999 for women (127 | 13.7%).
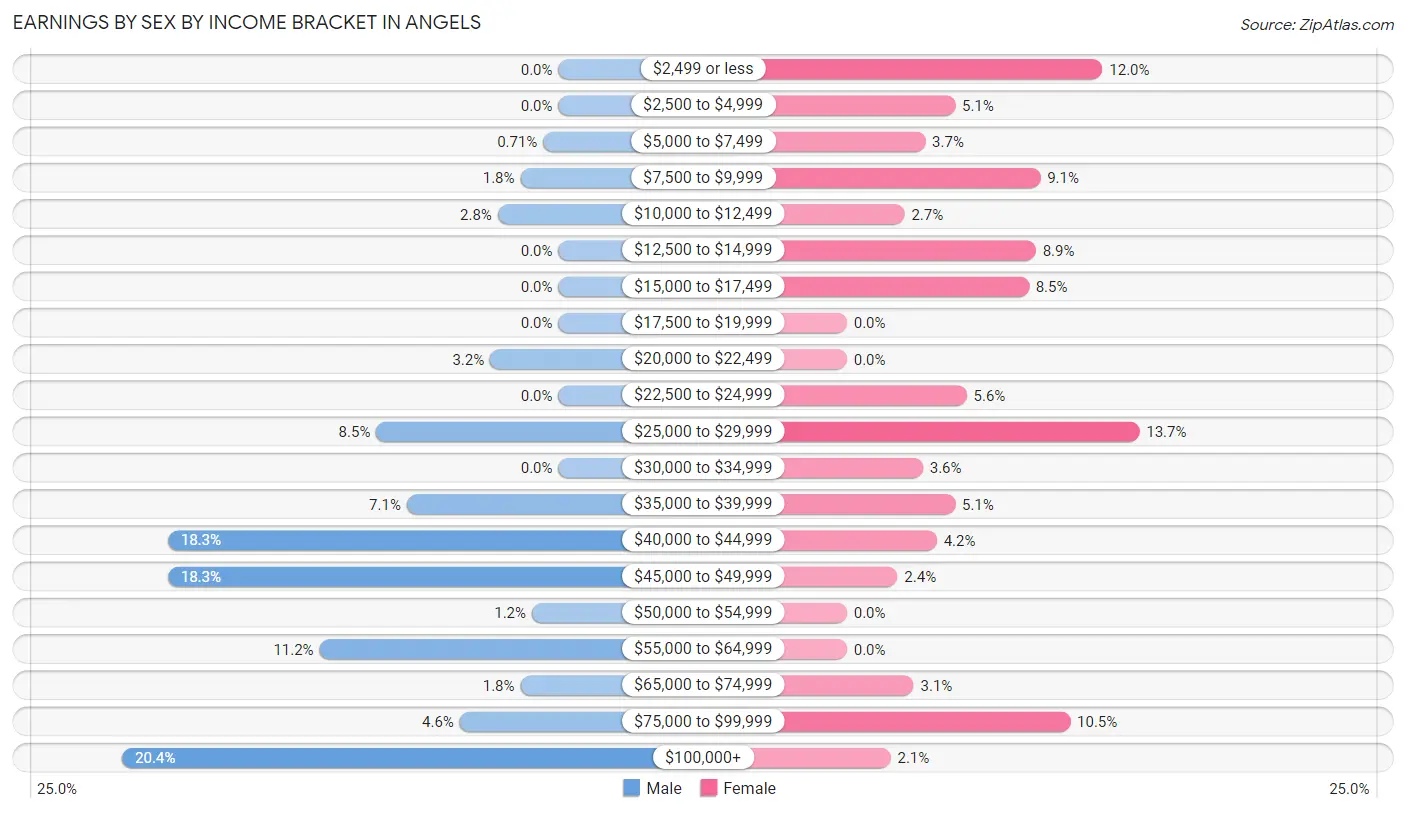
| Income | Male | Female |
| $2,499 or less | 0 (0.0%) | 111 (12.0%) |
| $2,500 to $4,999 | 0 (0.0%) | 47 (5.1%) |
| $5,000 to $7,499 | 4 (0.7%) | 34 (3.7%) |
| $7,500 to $9,999 | 10 (1.8%) | 84 (9.1%) |
| $10,000 to $12,499 | 16 (2.8%) | 25 (2.7%) |
| $12,500 to $14,999 | 0 (0.0%) | 82 (8.8%) |
| $15,000 to $17,499 | 0 (0.0%) | 79 (8.5%) |
| $17,500 to $19,999 | 0 (0.0%) | 0 (0.0%) |
| $20,000 to $22,499 | 18 (3.2%) | 0 (0.0%) |
| $22,500 to $24,999 | 0 (0.0%) | 52 (5.6%) |
| $25,000 to $29,999 | 48 (8.5%) | 127 (13.7%) |
| $30,000 to $34,999 | 0 (0.0%) | 33 (3.6%) |
| $35,000 to $39,999 | 40 (7.1%) | 47 (5.1%) |
| $40,000 to $44,999 | 103 (18.3%) | 39 (4.2%) |
| $45,000 to $49,999 | 103 (18.3%) | 22 (2.4%) |
| $50,000 to $54,999 | 7 (1.2%) | 0 (0.0%) |
| $55,000 to $64,999 | 63 (11.2%) | 0 (0.0%) |
| $65,000 to $74,999 | 10 (1.8%) | 29 (3.1%) |
| $75,000 to $99,999 | 26 (4.6%) | 97 (10.5%) |
| $100,000+ | 115 (20.4%) | 19 (2.1%) |
| Total | 563 (100.0%) | 927 (100.0%) |
Earnings by Sex by Educational Attainment in Angels
Average earnings in Angels are $46,663 for men and $27,835 for women, a difference of 40.4%. Men with an educational attainment of graduate degree enjoy the highest average annual earnings of $145,450, while those with less than high school education earn the least with $40,521. Women with an educational attainment of graduate degree earn the most with the average annual earnings of $98,661, while those with bachelor's degree education have the smallest earnings of $8,438.
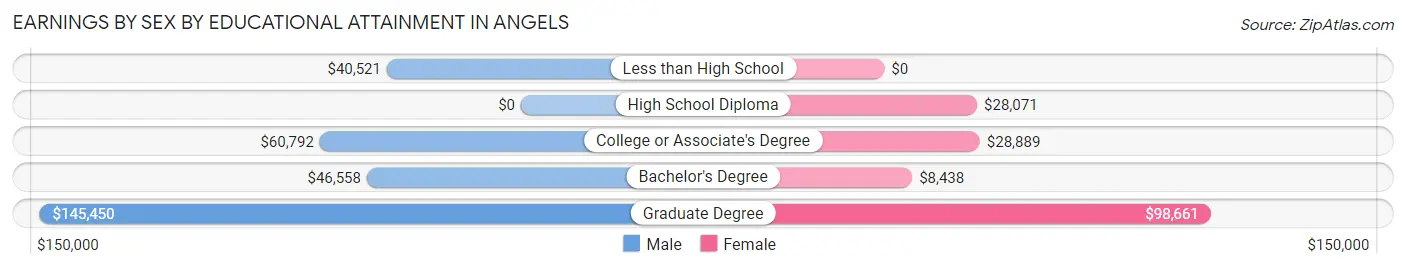
| Educational Attainment | Male Income | Female Income |
| Less than High School | $40,521 | $0 |
| High School Diploma | - | - |
| College or Associate's Degree | $60,792 | $28,889 |
| Bachelor's Degree | $46,558 | $8,438 |
| Graduate Degree | $145,450 | $98,661 |
| Total | $46,663 | $27,835 |
Family Income in Angels
Family Income Brackets in Angels
According to the Angels family income data, there are 344 families falling into the $50,000 to $74,999 income range, which is the most common income bracket and makes up 30.9% of all families. Conversely, the $10,000 to $14,999 income bracket is the least frequent group with only 13 families (1.2%) belonging to this category.
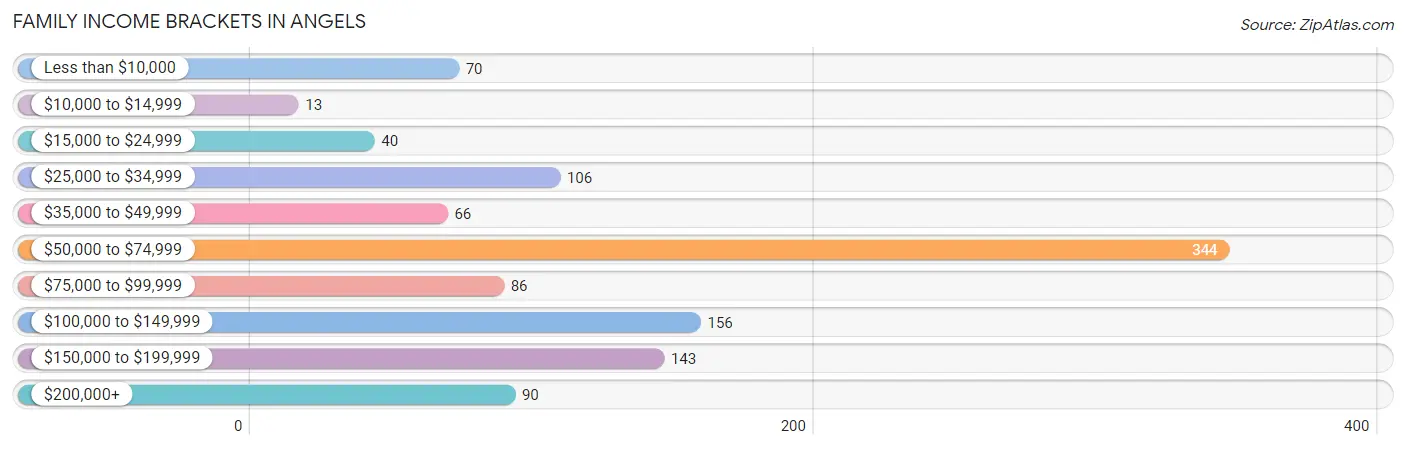
| Income Bracket | # Families | % Families |
| Less than $10,000 | 70 | 6.3% |
| $10,000 to $14,999 | 13 | 1.2% |
| $15,000 to $24,999 | 40 | 3.6% |
| $25,000 to $34,999 | 106 | 9.5% |
| $35,000 to $49,999 | 66 | 5.9% |
| $50,000 to $74,999 | 344 | 30.9% |
| $75,000 to $99,999 | 86 | 7.7% |
| $100,000 to $149,999 | 156 | 14.0% |
| $150,000 to $199,999 | 143 | 12.8% |
| $200,000+ | 90 | 8.1% |
Family Income by Famaliy Size in Angels
4-person families (27 | 2.4%) account for the highest median family income in Angels with $119,375 per family, while 2-person families (762 | 68.4%) have the highest median income of $31,428 per family member.
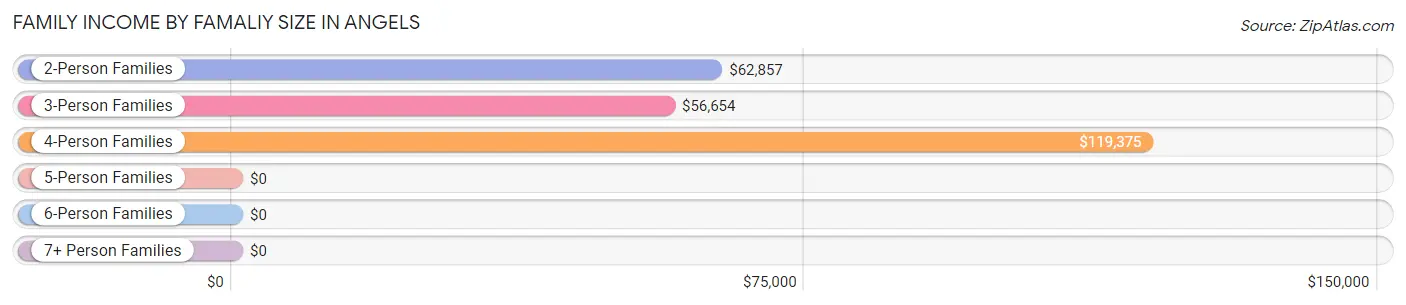
| Income Bracket | # Families | Median Income |
| 2-Person Families | 762 (68.4%) | $62,857 |
| 3-Person Families | 209 (18.8%) | $56,654 |
| 4-Person Families | 27 (2.4%) | $119,375 |
| 5-Person Families | 116 (10.4%) | $0 |
| 6-Person Families | 0 (0.0%) | $0 |
| 7+ Person Families | 0 (0.0%) | $0 |
| Total | 1,114 (100.0%) | $59,808 |
Family Income by Number of Earners in Angels
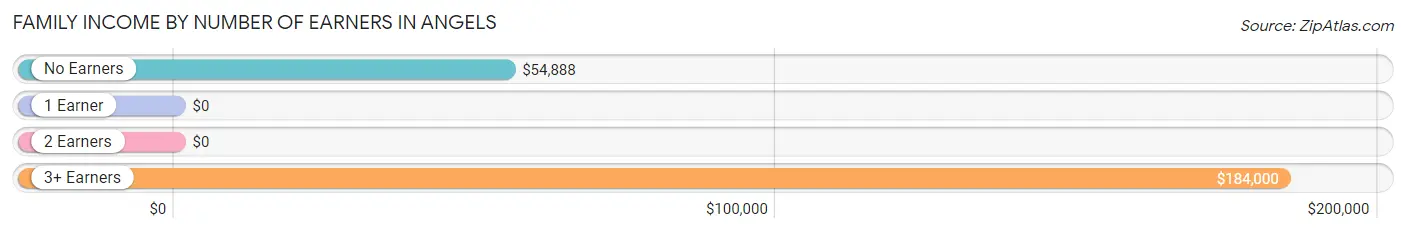
| Number of Earners | # Families | Median Income |
| No Earners | 375 (33.7%) | $54,888 |
| 1 Earner | 360 (32.3%) | $0 |
| 2 Earners | 325 (29.2%) | $0 |
| 3+ Earners | 54 (4.9%) | $184,000 |
| Total | 1,114 (100.0%) | $59,808 |
Household Income in Angels
Household Income Brackets in Angels
With 463 households falling in the category, the $50,000 to $74,999 income range is the most frequent in Angels, accounting for 29.4% of all households. In contrast, only 82 households (5.2%) fall into the $10,000 to $14,999 income bracket, making it the least populous group.
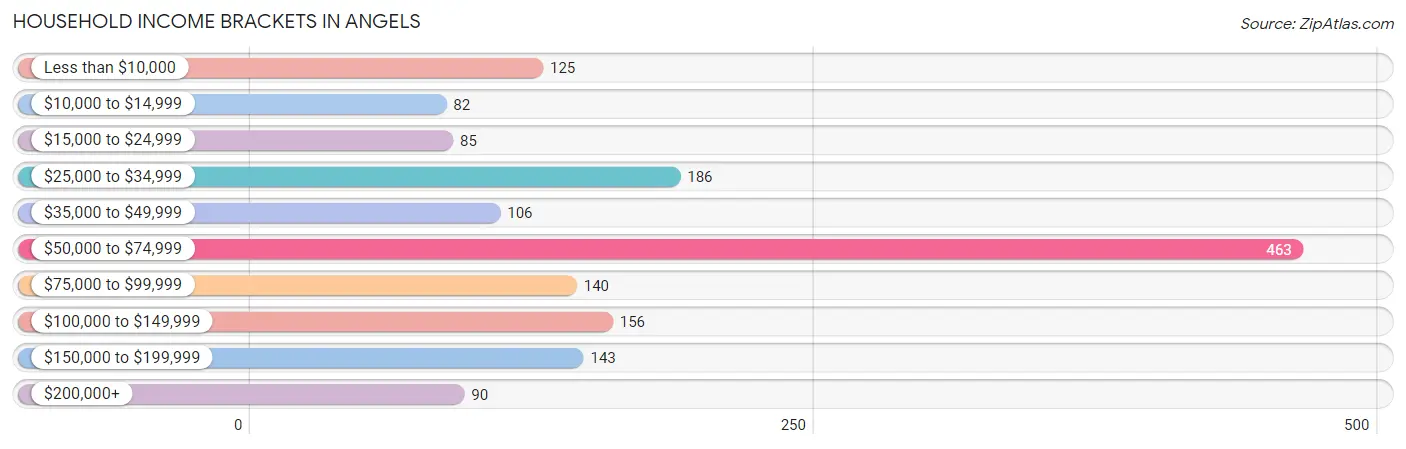
| Income Bracket | # Households | % Households |
| Less than $10,000 | 125 | 7.9% |
| $10,000 to $14,999 | 82 | 5.2% |
| $15,000 to $24,999 | 85 | 5.4% |
| $25,000 to $34,999 | 186 | 11.8% |
| $35,000 to $49,999 | 106 | 6.7% |
| $50,000 to $74,999 | 463 | 29.4% |
| $75,000 to $99,999 | 140 | 8.9% |
| $100,000 to $149,999 | 156 | 9.9% |
| $150,000 to $199,999 | 143 | 9.1% |
| $200,000+ | 90 | 5.7% |
Household Income by Householder Age in Angels
The median household income in Angels is $55,147, with the highest median household income of $58,036 found in the 45 to 64 years age bracket for the primary householder. A total of 578 households (36.7%) fall into this category. Meanwhile, the 15 to 24 years age bracket for the primary householder has the lowest median household income of $0, with 33 households (2.1%) in this group.
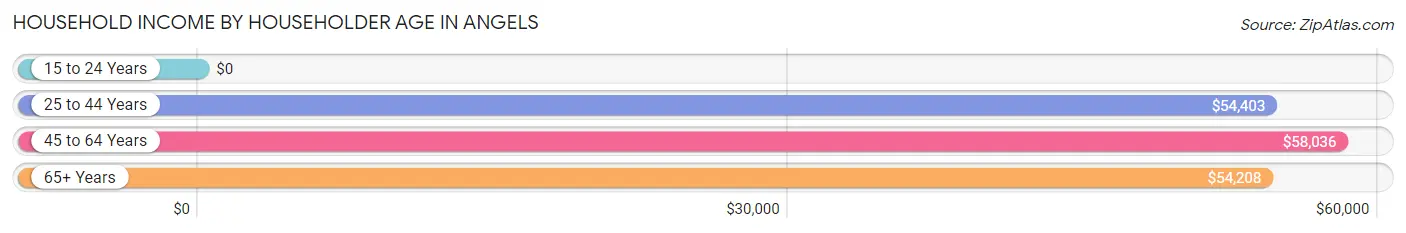
| Income Bracket | # Households | Median Income |
| 15 to 24 Years | 33 (2.1%) | $0 |
| 25 to 44 Years | 274 (17.4%) | $54,403 |
| 45 to 64 Years | 578 (36.7%) | $58,036 |
| 65+ Years | 691 (43.9%) | $54,208 |
| Total | 1,576 (100.0%) | $55,147 |
Poverty in Angels
Income Below Poverty by Sex and Age in Angels
With 7.1% poverty level for males and 16.2% for females among the residents of Angels, under 5 year old males and 75 year old and over females are the most vulnerable to poverty, with 9 males (20.0%) and 89 females (40.6%) in their respective age groups living below the poverty level.
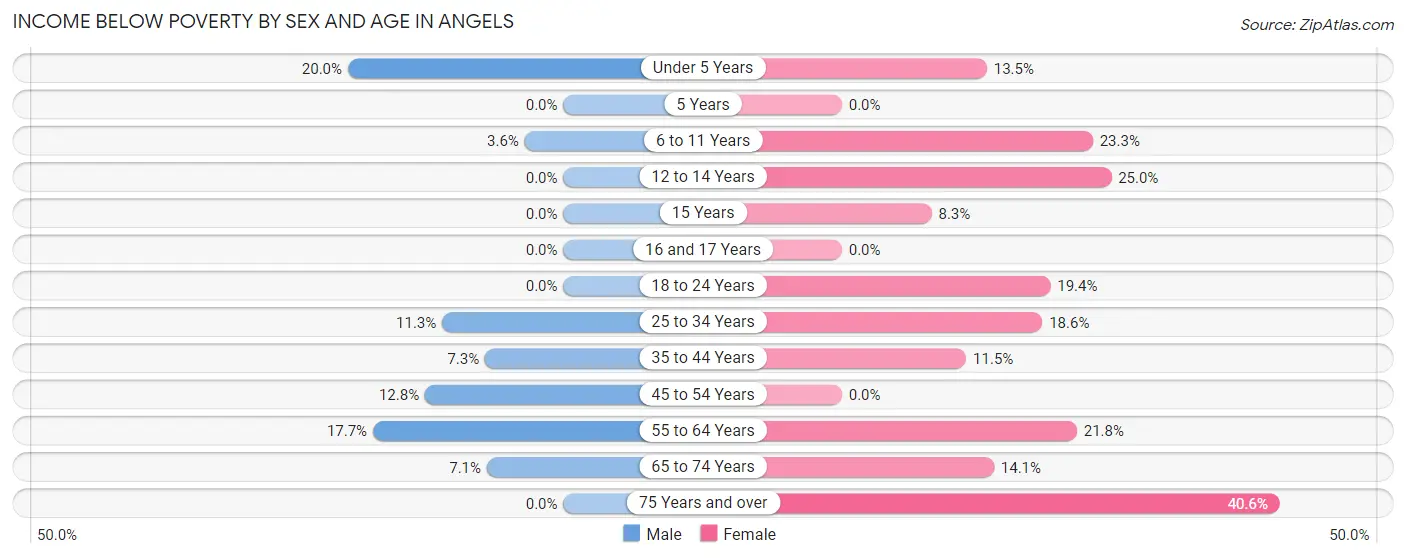
| Age Bracket | Male | Female |
| Under 5 Years | 9 (20.0%) | 7 (13.5%) |
| 5 Years | 0 (0.0%) | 0 (0.0%) |
| 6 to 11 Years | 8 (3.6%) | 17 (23.3%) |
| 12 to 14 Years | 0 (0.0%) | 6 (25.0%) |
| 15 Years | 0 (0.0%) | 5 (8.3%) |
| 16 and 17 Years | 0 (0.0%) | 0 (0.0%) |
| 18 to 24 Years | 0 (0.0%) | 36 (19.4%) |
| 25 to 34 Years | 9 (11.3%) | 8 (18.6%) |
| 35 to 44 Years | 12 (7.3%) | 27 (11.5%) |
| 45 to 54 Years | 14 (12.8%) | 0 (0.0%) |
| 55 to 64 Years | 41 (17.7%) | 70 (21.8%) |
| 65 to 74 Years | 24 (7.1%) | 69 (14.1%) |
| 75 Years and over | 0 (0.0%) | 89 (40.6%) |
| Total | 117 (7.1%) | 334 (16.2%) |
Income Above Poverty by Sex and Age in Angels
According to the poverty statistics in Angels, males aged 12 to 14 years and females aged 16 and 17 years are the age groups that are most secure financially, with 100.0% of males and 100.0% of females in these age groups living above the poverty line.
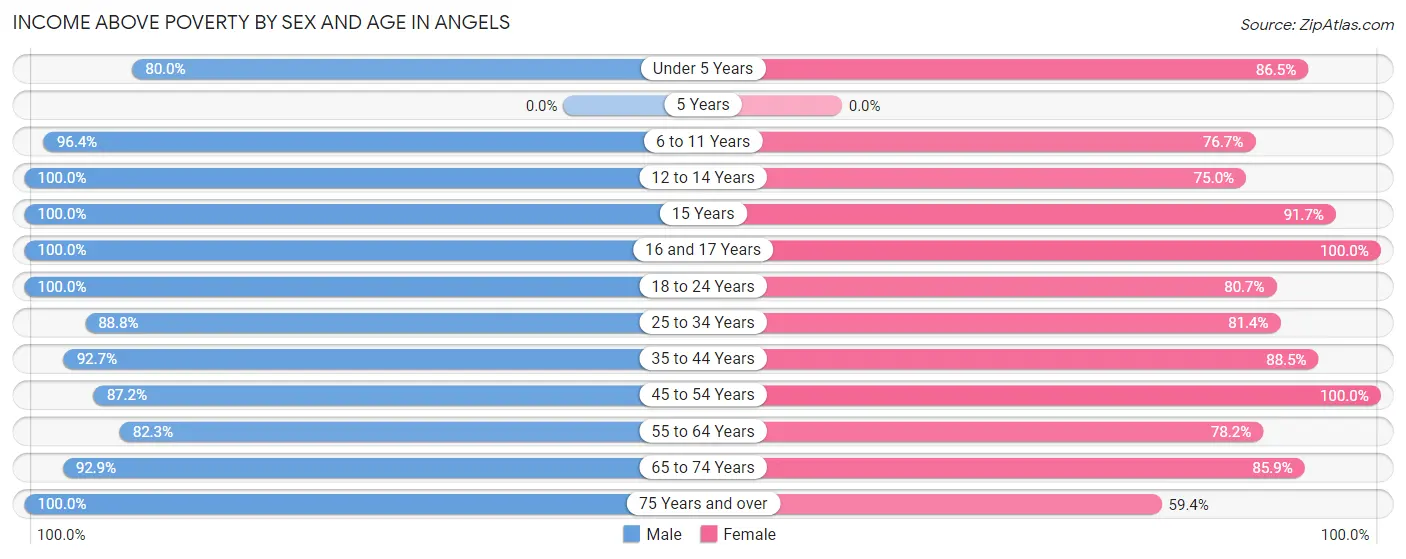
| Age Bracket | Male | Female |
| Under 5 Years | 36 (80.0%) | 45 (86.5%) |
| 5 Years | 0 (0.0%) | 0 (0.0%) |
| 6 to 11 Years | 215 (96.4%) | 56 (76.7%) |
| 12 to 14 Years | 42 (100.0%) | 18 (75.0%) |
| 15 Years | 8 (100.0%) | 55 (91.7%) |
| 16 and 17 Years | 146 (100.0%) | 22 (100.0%) |
| 18 to 24 Years | 72 (100.0%) | 150 (80.6%) |
| 25 to 34 Years | 71 (88.7%) | 35 (81.4%) |
| 35 to 44 Years | 153 (92.7%) | 207 (88.5%) |
| 45 to 54 Years | 95 (87.2%) | 342 (100.0%) |
| 55 to 64 Years | 191 (82.3%) | 251 (78.2%) |
| 65 to 74 Years | 314 (92.9%) | 420 (85.9%) |
| 75 Years and over | 189 (100.0%) | 130 (59.4%) |
| Total | 1,532 (92.9%) | 1,731 (83.8%) |
Income Below Poverty Among Married-Couple Families in Angels
The poverty statistics for married-couple families in Angels show that 6.9% or 60 of the total 871 families live below the poverty line. Families with 1 or 2 children have the highest poverty rate of 14.8%, comprising of 13 families. On the other hand, families with no children have the lowest poverty rate of 5.6%, which includes 39 families.
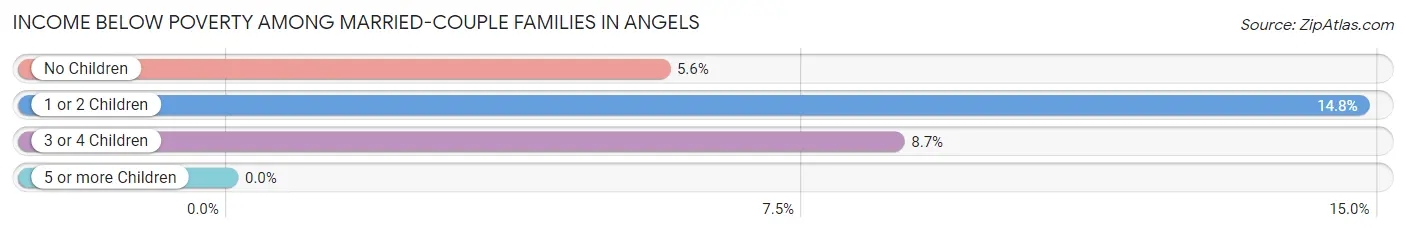
| Children | Above Poverty | Below Poverty |
| No Children | 652 (94.4%) | 39 (5.6%) |
| 1 or 2 Children | 75 (85.2%) | 13 (14.8%) |
| 3 or 4 Children | 84 (91.3%) | 8 (8.7%) |
| 5 or more Children | 0 (0.0%) | 0 (0.0%) |
| Total | 811 (93.1%) | 60 (6.9%) |
Income Below Poverty Among Single-Parent Households in Angels
According to the poverty data in Angels, 14.3% or 4 single-father households and 14.4% or 31 single-mother households are living below the poverty line. Among single-father households, those with 1 or 2 children have the highest poverty rate, with 4 households (100.0%) experiencing poverty. Likewise, among single-mother households, those with no children have the highest poverty rate, with 31 households (39.2%) falling below the poverty line.
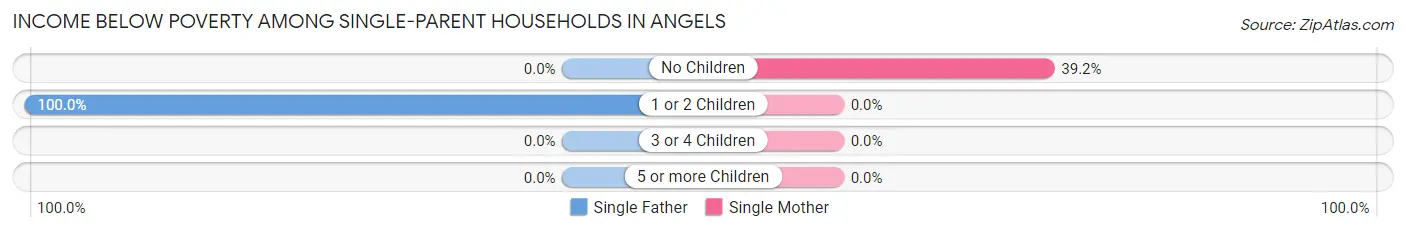
| Children | Single Father | Single Mother |
| No Children | 0 (0.0%) | 31 (39.2%) |
| 1 or 2 Children | 4 (100.0%) | 0 (0.0%) |
| 3 or 4 Children | 0 (0.0%) | 0 (0.0%) |
| 5 or more Children | 0 (0.0%) | 0 (0.0%) |
| Total | 4 (14.3%) | 31 (14.4%) |
Income Below Poverty Among Married-Couple vs Single-Parent Households in Angels
The poverty data for Angels shows that 60 of the married-couple family households (6.9%) and 35 of the single-parent households (14.4%) are living below the poverty level. Within the married-couple family households, those with 1 or 2 children have the highest poverty rate, with 13 households (14.8%) falling below the poverty line. Among the single-parent households, those with no children have the highest poverty rate, with 31 household (30.1%) living below poverty.
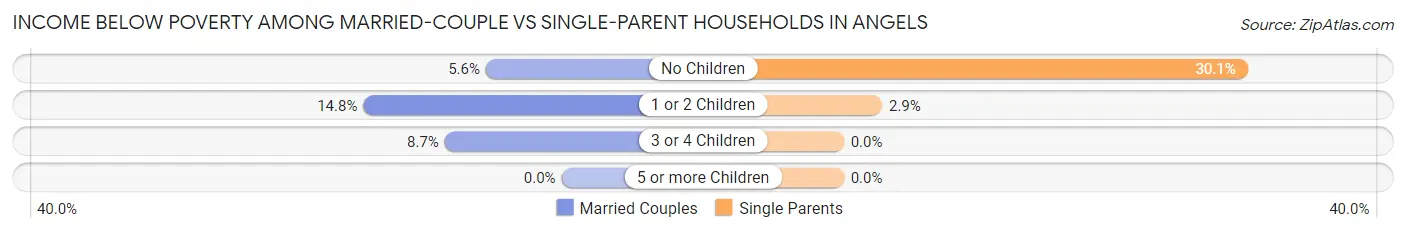
| Children | Married-Couple Families | Single-Parent Households |
| No Children | 39 (5.6%) | 31 (30.1%) |
| 1 or 2 Children | 13 (14.8%) | 4 (2.9%) |
| 3 or 4 Children | 8 (8.7%) | 0 (0.0%) |
| 5 or more Children | 0 (0.0%) | 0 (0.0%) |
| Total | 60 (6.9%) | 35 (14.4%) |
Race in Angels
The most populous races in Angels are White / Caucasian (3,031 | 81.6%), Two or more Races (337 | 9.1%), and Hispanic or Latino (323 | 8.7%).
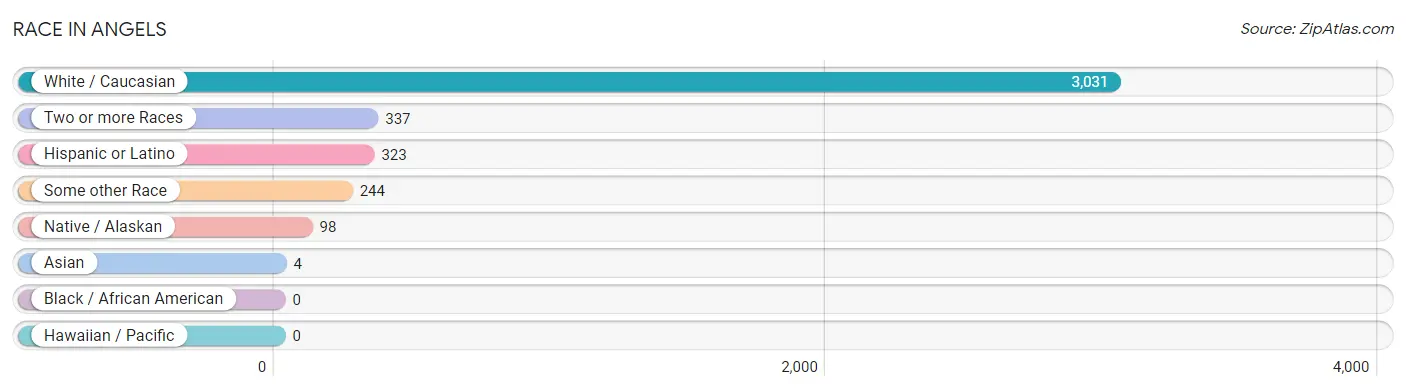
| Race | # Population | % Population |
| Asian | 4 | 0.1% |
| Black / African American | 0 | 0.0% |
| Hawaiian / Pacific | 0 | 0.0% |
| Hispanic or Latino | 323 | 8.7% |
| Native / Alaskan | 98 | 2.6% |
| White / Caucasian | 3,031 | 81.6% |
| Two or more Races | 337 | 9.1% |
| Some other Race | 244 | 6.6% |
| Total | 3,714 | 100.0% |
Ancestry in Angels
The most populous ancestries reported in Angels are German (1,140 | 30.7%), Irish (647 | 17.4%), English (635 | 17.1%), Italian (376 | 10.1%), and Mexican (311 | 8.4%), together accounting for 83.7% of all Angels residents.
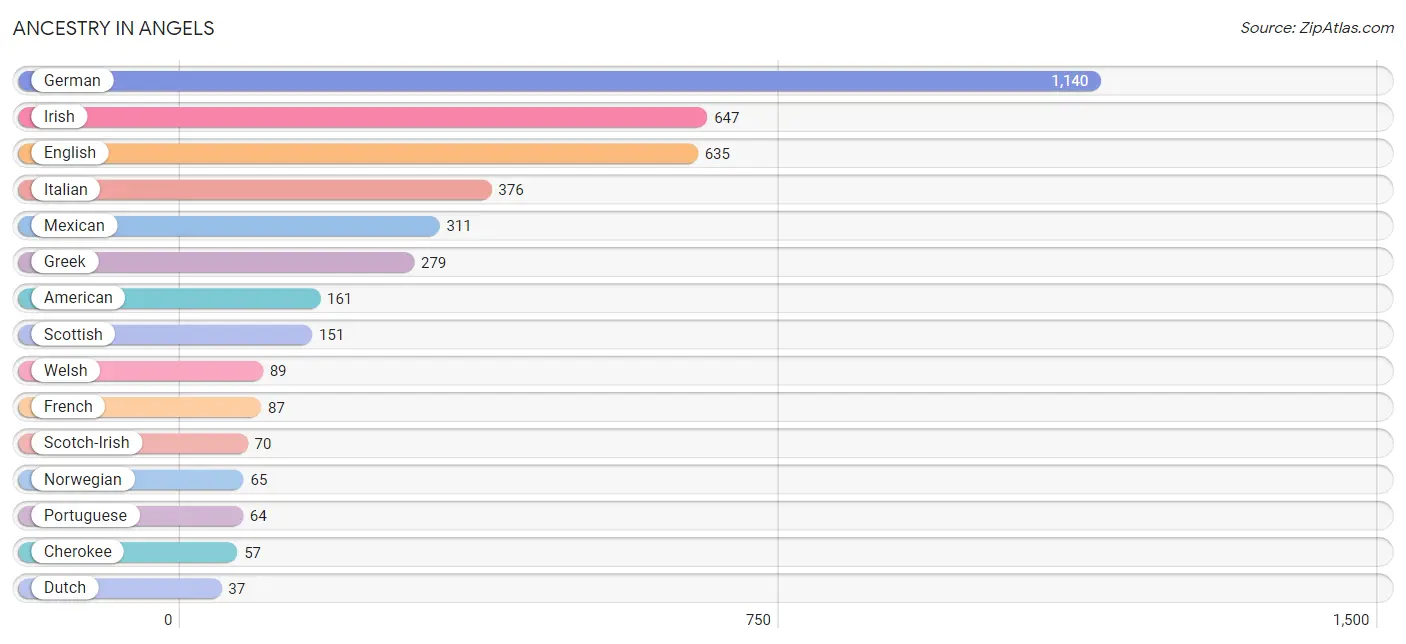
| Ancestry | # Population | % Population |
| American | 161 | 4.3% |
| British | 10 | 0.3% |
| Cherokee | 57 | 1.5% |
| Choctaw | 33 | 0.9% |
| Dutch | 37 | 1.0% |
| English | 635 | 17.1% |
| European | 33 | 0.9% |
| French | 87 | 2.3% |
| French American Indian | 5 | 0.1% |
| German | 1,140 | 30.7% |
| Greek | 279 | 7.5% |
| Hopi | 12 | 0.3% |
| Indian (Asian) | 36 | 1.0% |
| Irish | 647 | 17.4% |
| Italian | 376 | 10.1% |
| Korean | 4 | 0.1% |
| Lithuanian | 6 | 0.2% |
| Mexican | 311 | 8.4% |
| Northern European | 22 | 0.6% |
| Norwegian | 65 | 1.8% |
| Polish | 26 | 0.7% |
| Portuguese | 64 | 1.7% |
| Scandinavian | 19 | 0.5% |
| Scotch-Irish | 70 | 1.9% |
| Scottish | 151 | 4.1% |
| Spanish | 12 | 0.3% |
| Swedish | 32 | 0.9% |
| Welsh | 89 | 2.4% | View All 28 Rows |
Immigrants in Angels
The most numerous immigrant groups reported in Angels came from Latin America (51 | 1.4%), Central America (26 | 0.7%), Mexico (26 | 0.7%), Chile (25 | 0.7%), and South America (25 | 0.7%), together accounting for 4.1% of all Angels residents.
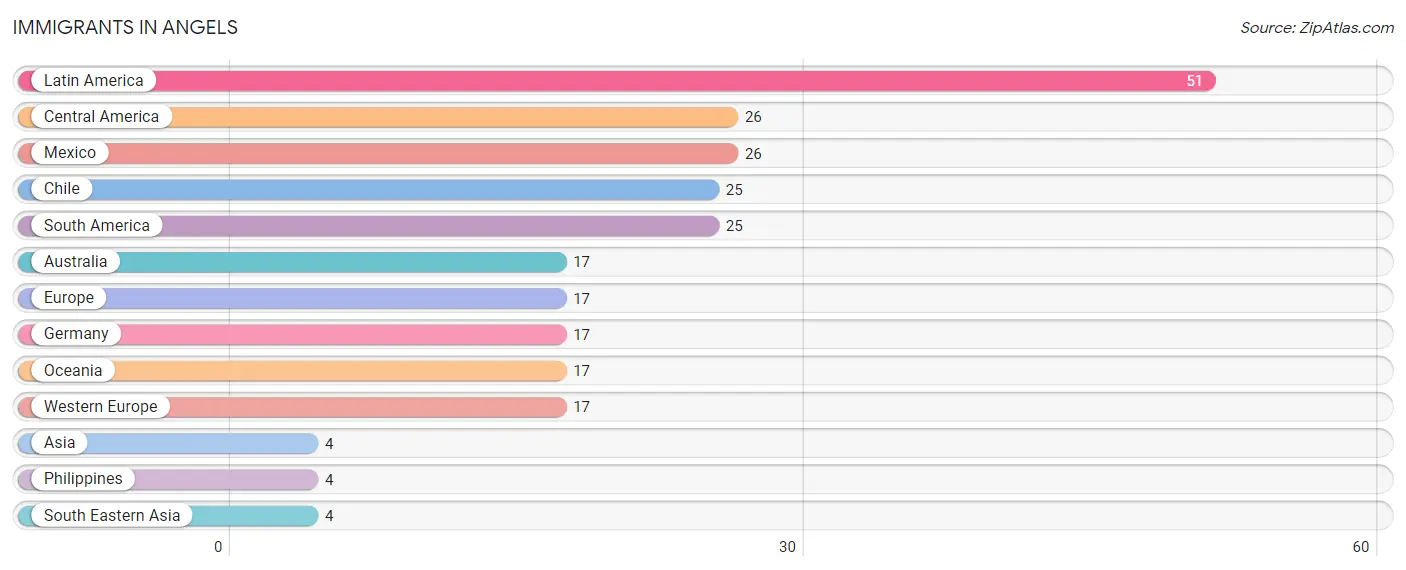
| Immigration Origin | # Population | % Population |
| Asia | 4 | 0.1% |
| Australia | 17 | 0.5% |
| Central America | 26 | 0.7% |
| Chile | 25 | 0.7% |
| Europe | 17 | 0.5% |
| Germany | 17 | 0.5% |
| Latin America | 51 | 1.4% |
| Mexico | 26 | 0.7% |
| Oceania | 17 | 0.5% |
| Philippines | 4 | 0.1% |
| South America | 25 | 0.7% |
| South Eastern Asia | 4 | 0.1% |
| Western Europe | 17 | 0.5% | View All 13 Rows |
Sex and Age in Angels
Sex and Age in Angels
The most populous age groups in Angels are 5 to 9 Years (202 | 12.2%) for men and 70 to 74 Years (276 | 13.4%) for women.
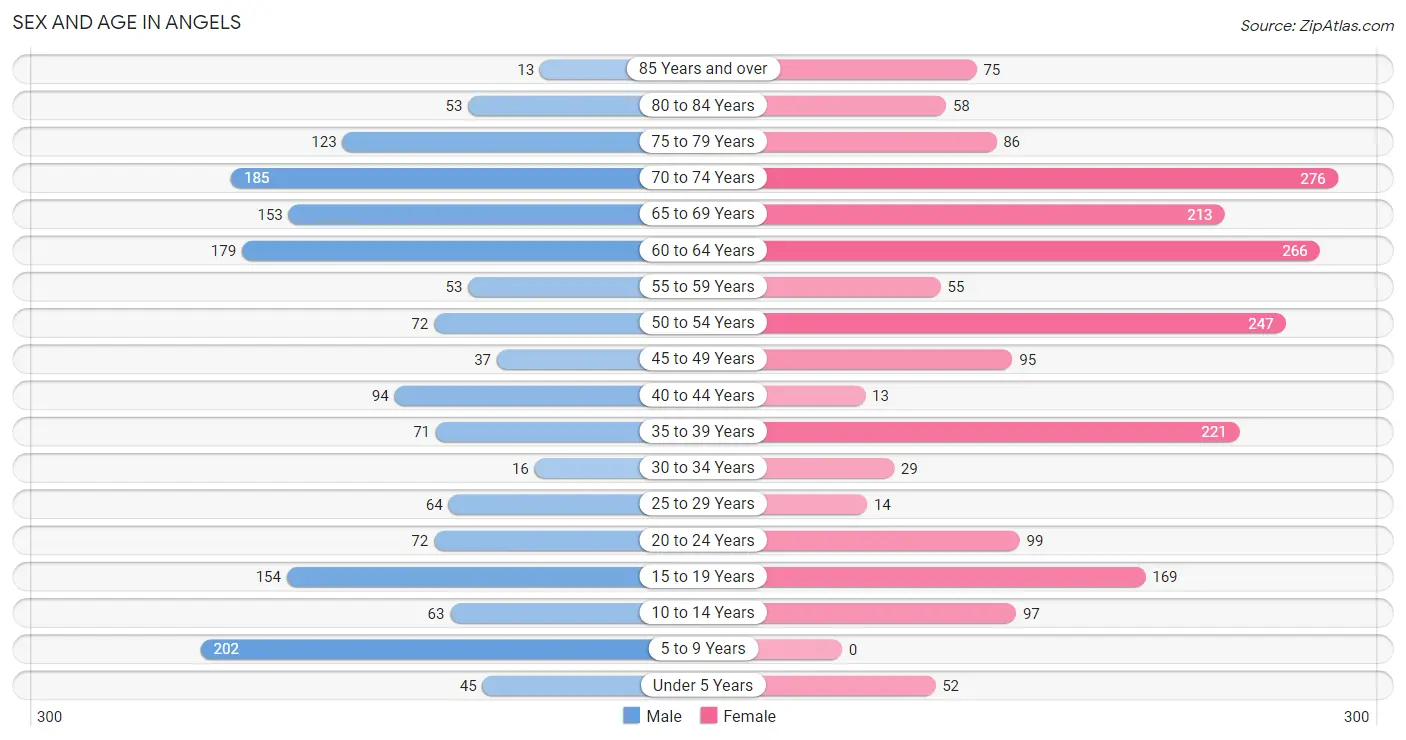
| Age Bracket | Male | Female |
| Under 5 Years | 45 (2.7%) | 52 (2.5%) |
| 5 to 9 Years | 202 (12.2%) | 0 (0.0%) |
| 10 to 14 Years | 63 (3.8%) | 97 (4.7%) |
| 15 to 19 Years | 154 (9.3%) | 169 (8.2%) |
| 20 to 24 Years | 72 (4.4%) | 99 (4.8%) |
| 25 to 29 Years | 64 (3.9%) | 14 (0.7%) |
| 30 to 34 Years | 16 (1.0%) | 29 (1.4%) |
| 35 to 39 Years | 71 (4.3%) | 221 (10.7%) |
| 40 to 44 Years | 94 (5.7%) | 13 (0.6%) |
| 45 to 49 Years | 37 (2.2%) | 95 (4.6%) |
| 50 to 54 Years | 72 (4.4%) | 247 (12.0%) |
| 55 to 59 Years | 53 (3.2%) | 55 (2.7%) |
| 60 to 64 Years | 179 (10.9%) | 266 (12.9%) |
| 65 to 69 Years | 153 (9.3%) | 213 (10.3%) |
| 70 to 74 Years | 185 (11.2%) | 276 (13.4%) |
| 75 to 79 Years | 123 (7.5%) | 86 (4.2%) |
| 80 to 84 Years | 53 (3.2%) | 58 (2.8%) |
| 85 Years and over | 13 (0.8%) | 75 (3.6%) |
| Total | 1,649 (100.0%) | 2,065 (100.0%) |
Families and Households in Angels
Median Family Size in Angels
The median family size in Angels is 2.78 persons per family, with single male/father families (28 | 2.5%) accounting for the largest median family size of 8.21 persons per family. On the other hand, single female/mother families (215 | 19.3%) represent the smallest median family size with 2.56 persons per family.
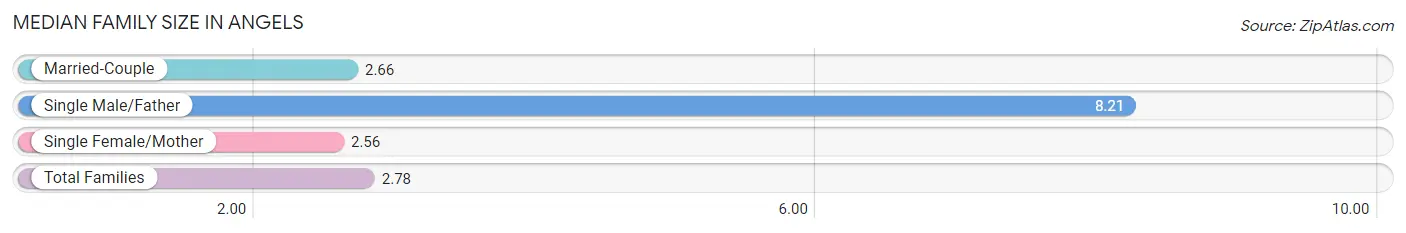
| Family Type | # Families | Family Size |
| Married-Couple | 871 (78.2%) | 2.66 |
| Single Male/Father | 28 (2.5%) | 8.21 |
| Single Female/Mother | 215 (19.3%) | 2.56 |
| Total Families | 1,114 (100.0%) | 2.78 |
Median Household Size in Angels
The median household size in Angels is 2.34 persons per household, with single male/father households (28 | 1.8%) accounting for the largest median household size of 8.21 persons per household. non-family households (462 | 29.3%) represent the smallest median household size with 1.08 persons per household.
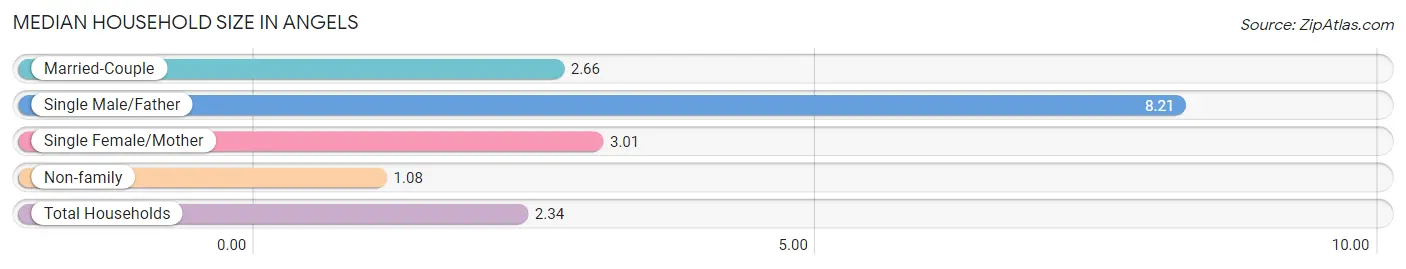
| Household Type | # Households | Household Size |
| Married-Couple | 871 (55.3%) | 2.66 |
| Single Male/Father | 28 (1.8%) | 8.21 |
| Single Female/Mother | 215 (13.6%) | 3.01 |
| Non-family | 462 (29.3%) | 1.08 |
| Total Households | 1,576 (100.0%) | 2.34 |
Household Size by Marriage Status in Angels
Out of a total of 1,576 households in Angels, 1,114 (70.7%) are family households, while 462 (29.3%) are nonfamily households. The most numerous type of family households are 2-person households, comprising 724, and the most common type of nonfamily households are 1-person households, comprising 431.
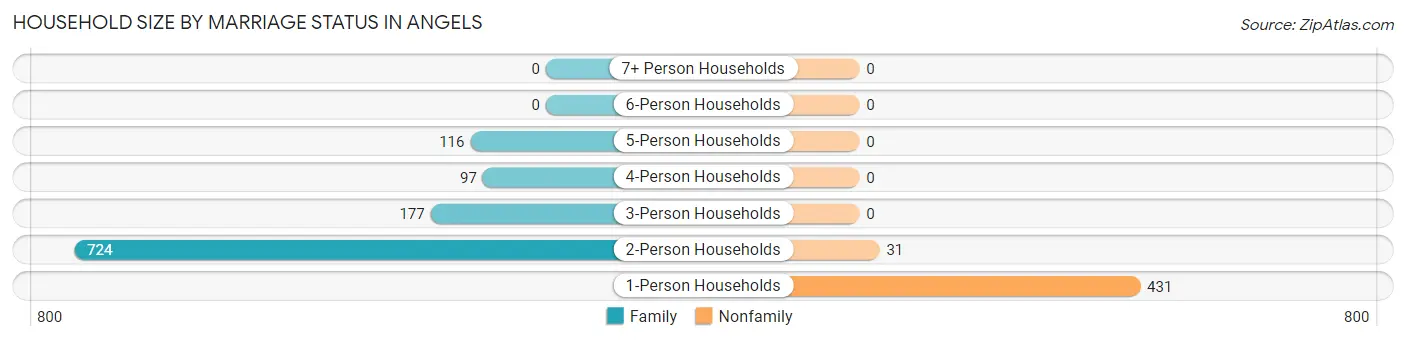
| Household Size | Family Households | Nonfamily Households |
| 1-Person Households | - | 431 (27.4%) |
| 2-Person Households | 724 (45.9%) | 31 (2.0%) |
| 3-Person Households | 177 (11.2%) | 0 (0.0%) |
| 4-Person Households | 97 (6.1%) | 0 (0.0%) |
| 5-Person Households | 116 (7.4%) | 0 (0.0%) |
| 6-Person Households | 0 (0.0%) | 0 (0.0%) |
| 7+ Person Households | 0 (0.0%) | 0 (0.0%) |
| Total | 1,114 (70.7%) | 462 (29.3%) |
Female Fertility in Angels
Fertility by Age in Angels
Average fertility rate in Angels is 59.0 births per 1,000 women. Women in the age bracket of 35 to 50 years have the highest fertility rate with 88.0 births per 1,000 women. Women in the age bracket of 35 to 50 years acount for 80.0% of all women with births.
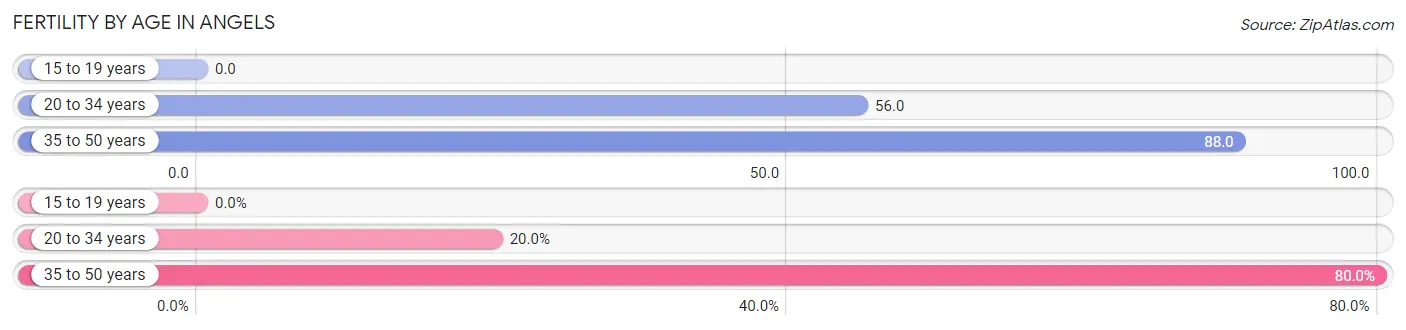
| Age Bracket | Women with Births | Births / 1,000 Women |
| 15 to 19 years | 0 (0.0%) | 0.0 |
| 20 to 34 years | 8 (20.0%) | 56.0 |
| 35 to 50 years | 32 (80.0%) | 88.0 |
| Total | 40 (100.0%) | 59.0 |
Fertility by Age by Marriage Status in Angels
20.0% of women with births (40) in Angels are married. The highest percentage of unmarried women with births falls into 35 to 50 years age bracket with 100.0% of them unmarried at the time of birth, while the lowest percentage of unmarried women with births belong to 20 to 34 years age bracket with 0.0% of them unmarried.
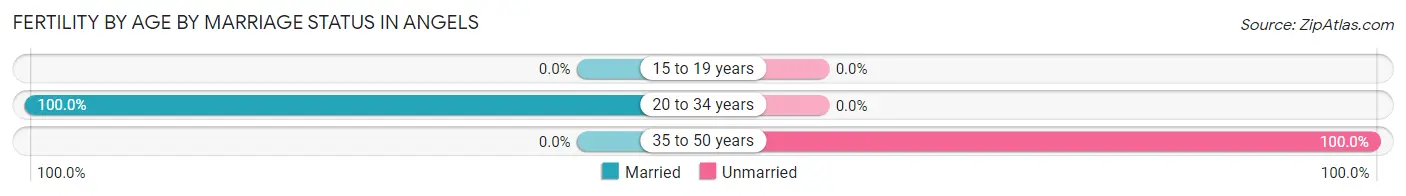
| Age Bracket | Married | Unmarried |
| 15 to 19 years | 0 (0.0%) | 0 (0.0%) |
| 20 to 34 years | 8 (100.0%) | 0 (0.0%) |
| 35 to 50 years | 0 (0.0%) | 32 (100.0%) |
| Total | 8 (20.0%) | 32 (80.0%) |
Fertility by Education in Angels
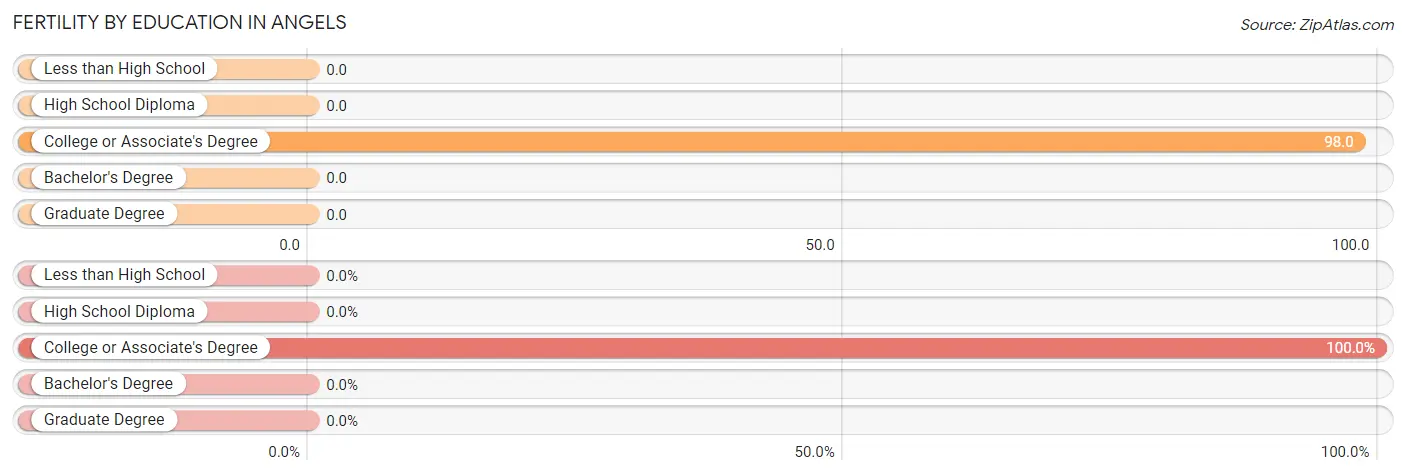
| Educational Attainment | Women with Births | Births / 1,000 Women |
| Less than High School | 0 (0.0%) | 0.0 |
| High School Diploma | 0 (0.0%) | 0.0 |
| College or Associate's Degree | 40 (100.0%) | 98.0 |
| Bachelor's Degree | 0 (0.0%) | 0.0 |
| Graduate Degree | 0 (0.0%) | 0.0 |
| Total | 40 (100.0%) | 59.0 |
Fertility by Education by Marriage Status in Angels
80.0% of women with births in Angels are unmarried. Women with the educational attainment of college or associate's degree are most likely to be married with 20.0% of them married at childbirth, while women with the educational attainment of college or associate's degree are least likely to be married with 80.0% of them unmarried at childbirth.
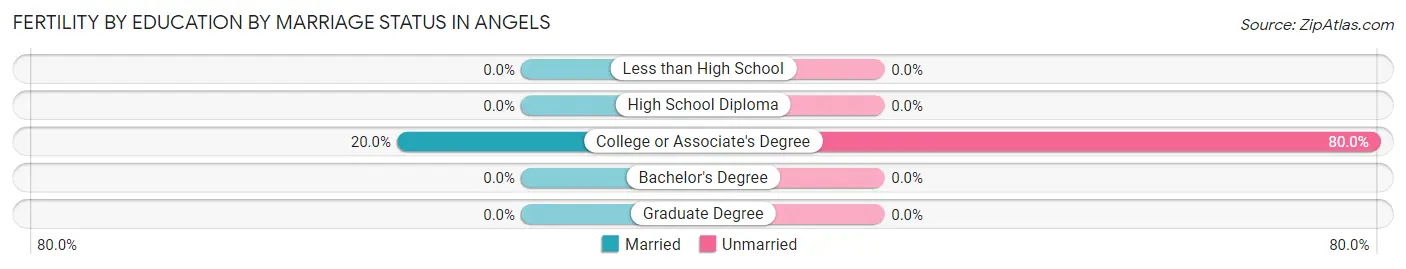
| Educational Attainment | Married | Unmarried |
| Less than High School | 0 (0.0%) | 0 (0.0%) |
| High School Diploma | 0 (0.0%) | 0 (0.0%) |
| College or Associate's Degree | 8 (20.0%) | 32 (80.0%) |
| Bachelor's Degree | 0 (0.0%) | 0 (0.0%) |
| Graduate Degree | 0 (0.0%) | 0 (0.0%) |
| Total | 8 (20.0%) | 32 (80.0%) |
Employment Characteristics in Angels
Employment by Class of Employer in Angels
Among the 1,314 employed individuals in Angels, private company employees (541 | 41.2%), self-employed (not incorporated) (274 | 20.8%), and local government employees (242 | 18.4%) make up the most common classes of employment.
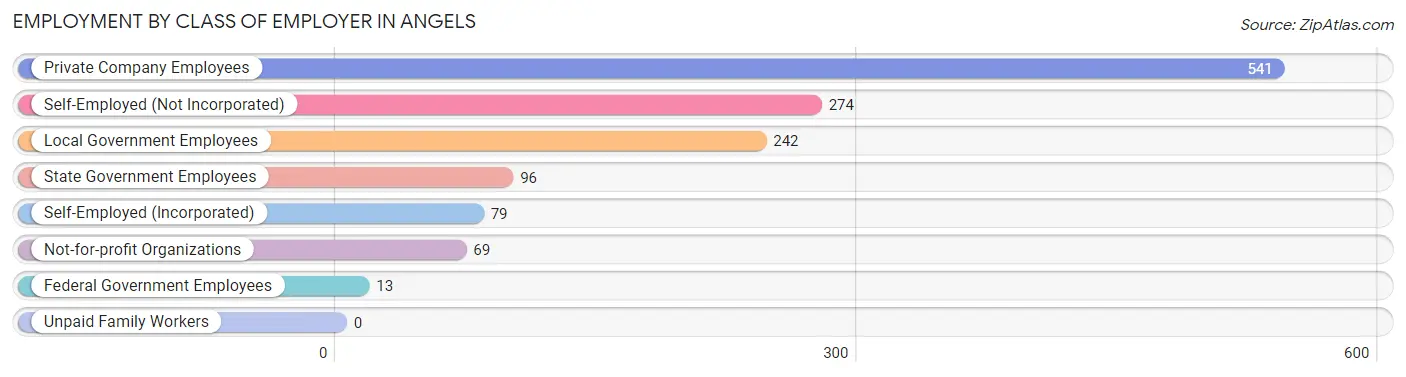
| Employer Class | # Employees | % Employees |
| Private Company Employees | 541 | 41.2% |
| Self-Employed (Incorporated) | 79 | 6.0% |
| Self-Employed (Not Incorporated) | 274 | 20.8% |
| Not-for-profit Organizations | 69 | 5.2% |
| Local Government Employees | 242 | 18.4% |
| State Government Employees | 96 | 7.3% |
| Federal Government Employees | 13 | 1.0% |
| Unpaid Family Workers | 0 | 0.0% |
| Total | 1,314 | 100.0% |
Employment Status by Age in Angels
According to the labor force statistics for Angels, out of the total population over 16 years of age (3,187), 46.3% or 1,476 individuals are in the labor force, with 6.9% or 102 of them unemployed. The age group with the highest labor force participation rate is 45 to 54 years, with 93.1% or 420 individuals in the labor force. Within the labor force, the 45 to 54 years age range has the highest percentage of unemployed individuals, with 21.7% or 91 of them being unemployed.
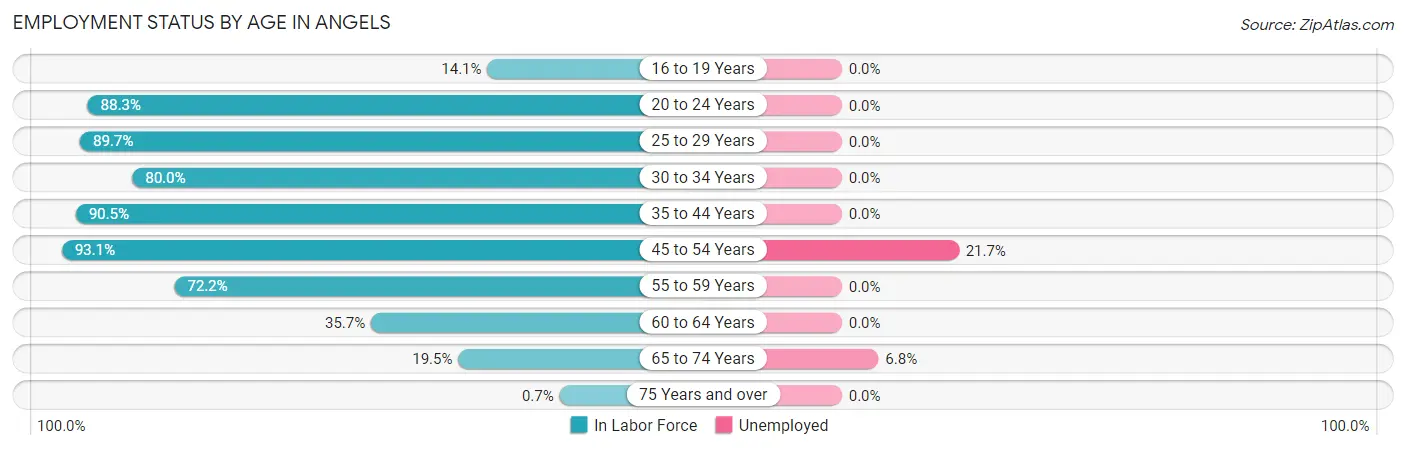
| Age Bracket | In Labor Force | Unemployed |
| 16 to 19 Years | 36 (14.1%) | 0 (0.0%) |
| 20 to 24 Years | 151 (88.3%) | 0 (0.0%) |
| 25 to 29 Years | 70 (89.7%) | 0 (0.0%) |
| 30 to 34 Years | 36 (80.0%) | 0 (0.0%) |
| 35 to 44 Years | 361 (90.5%) | 0 (0.0%) |
| 45 to 54 Years | 420 (93.1%) | 91 (21.7%) |
| 55 to 59 Years | 78 (72.2%) | 0 (0.0%) |
| 60 to 64 Years | 159 (35.7%) | 0 (0.0%) |
| 65 to 74 Years | 161 (19.5%) | 11 (6.8%) |
| 75 Years and over | 3 (0.7%) | 0 (0.0%) |
| Total | 1,476 (46.3%) | 102 (6.9%) |
Employment Status by Educational Attainment in Angels
According to labor force statistics for Angels, 73.7% of individuals (1,125) out of the total population between 25 and 64 years of age (1,526) are in the labor force, with 8.1% or 91 of them being unemployed. The group with the highest labor force participation rate are those with the educational attainment of less than high school, with 88.2% or 90 individuals in the labor force. Within the labor force, individuals with college / associate degree education have the highest percentage of unemployment, with 12.9% or 75 of them being unemployed.
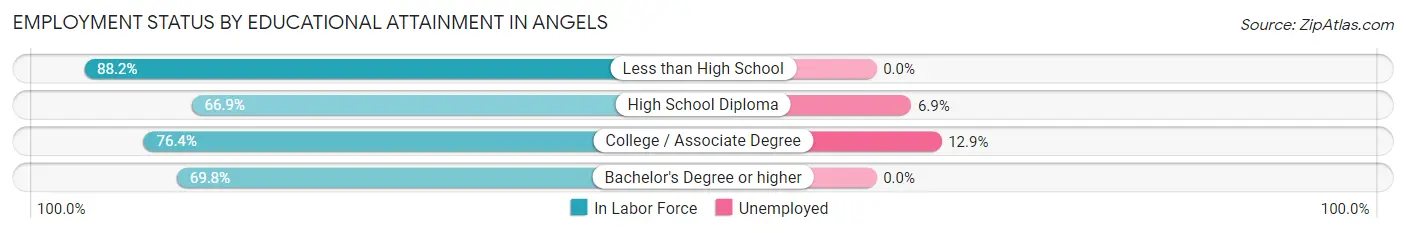
| Educational Attainment | In Labor Force | Unemployed |
| Less than High School | 90 (88.2%) | 0 (0.0%) |
| High School Diploma | 232 (66.9%) | 24 (6.9%) |
| College / Associate Degree | 582 (76.4%) | 98 (12.9%) |
| Bachelor's Degree or higher | 220 (69.8%) | 0 (0.0%) |
| Total | 1,125 (73.7%) | 124 (8.1%) |
Employment Occupations by Sex in Angels
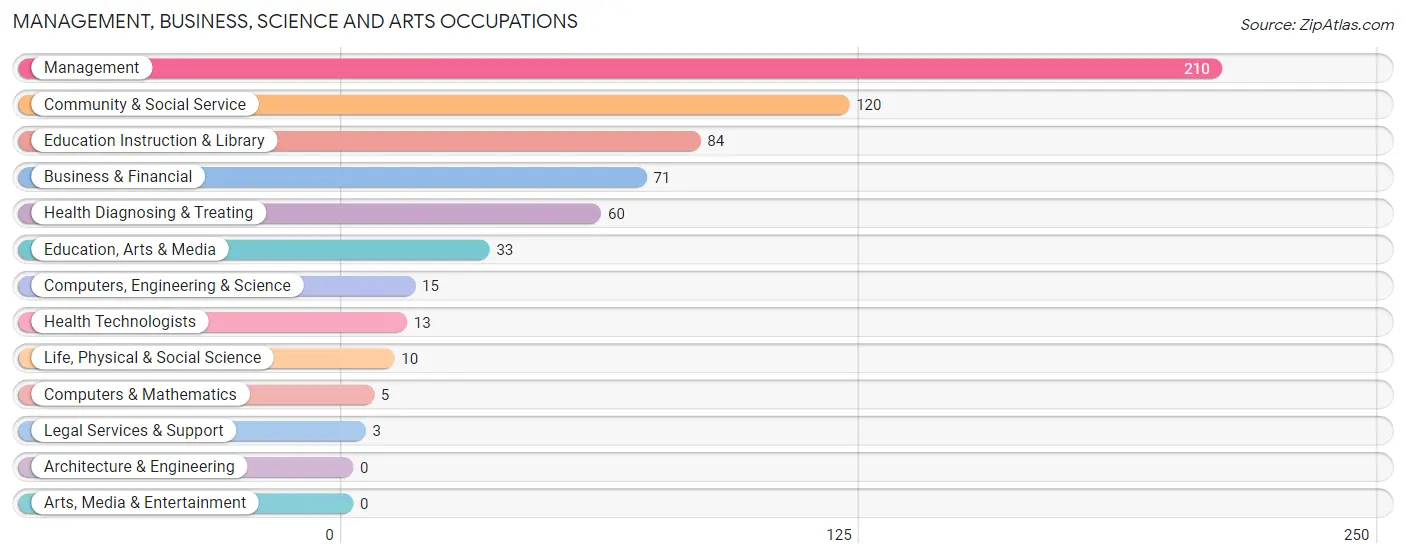
Management, Business, Science and Arts Occupations
The most common Management, Business, Science and Arts occupations in Angels are Management (210 | 15.3%), Community & Social Service (120 | 8.7%), Education Instruction & Library (84 | 6.1%), Business & Financial (71 | 5.2%), and Health Diagnosing & Treating (60 | 4.4%).
Management, Business, Science and Arts Occupations by Sex
Within the Management, Business, Science and Arts occupations in Angels, the most male-oriented occupations are Computers & Mathematics (100.0%), Legal Services & Support (100.0%), and Health Technologists (100.0%), while the most female-oriented occupations are Life, Physical & Social Science (100.0%), Education, Arts & Media (100.0%), and Business & Financial (94.4%).
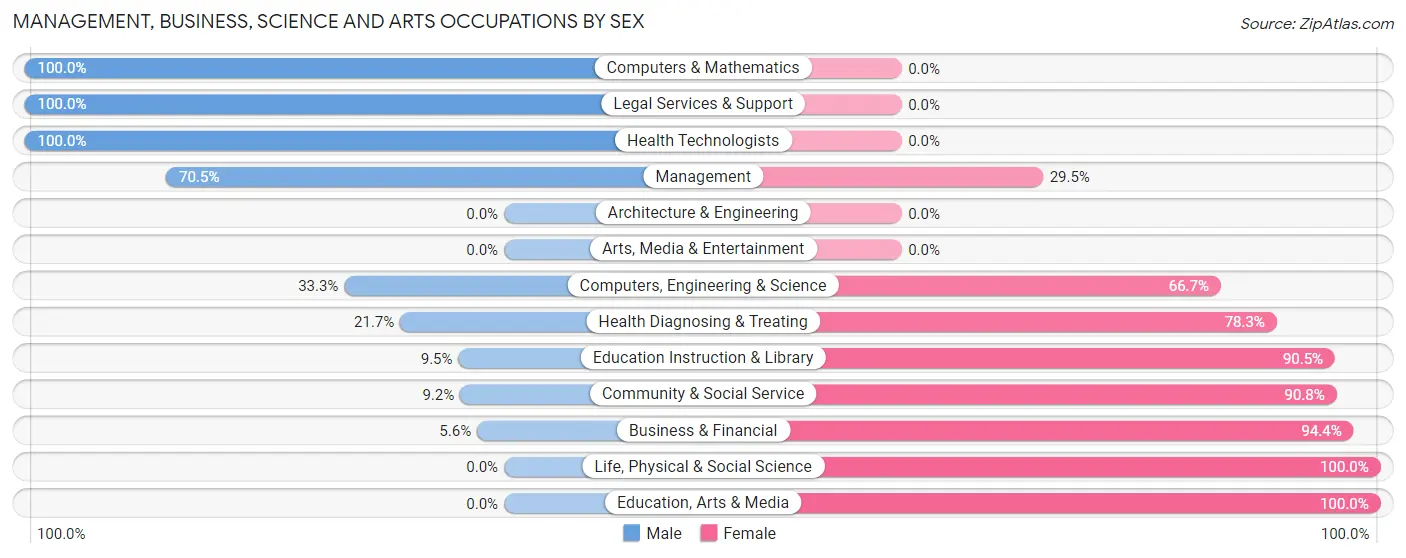
| Occupation | Male | Female |
| Management | 148 (70.5%) | 62 (29.5%) |
| Business & Financial | 4 (5.6%) | 67 (94.4%) |
| Computers, Engineering & Science | 5 (33.3%) | 10 (66.7%) |
| Computers & Mathematics | 5 (100.0%) | 0 (0.0%) |
| Architecture & Engineering | 0 (0.0%) | 0 (0.0%) |
| Life, Physical & Social Science | 0 (0.0%) | 10 (100.0%) |
| Community & Social Service | 11 (9.2%) | 109 (90.8%) |
| Education, Arts & Media | 0 (0.0%) | 33 (100.0%) |
| Legal Services & Support | 3 (100.0%) | 0 (0.0%) |
| Education Instruction & Library | 8 (9.5%) | 76 (90.5%) |
| Arts, Media & Entertainment | 0 (0.0%) | 0 (0.0%) |
| Health Diagnosing & Treating | 13 (21.7%) | 47 (78.3%) |
| Health Technologists | 13 (100.0%) | 0 (0.0%) |
| Total (Category) | 181 (38.0%) | 295 (62.0%) |
| Total (Overall) | 545 (39.7%) | 828 (60.3%) |
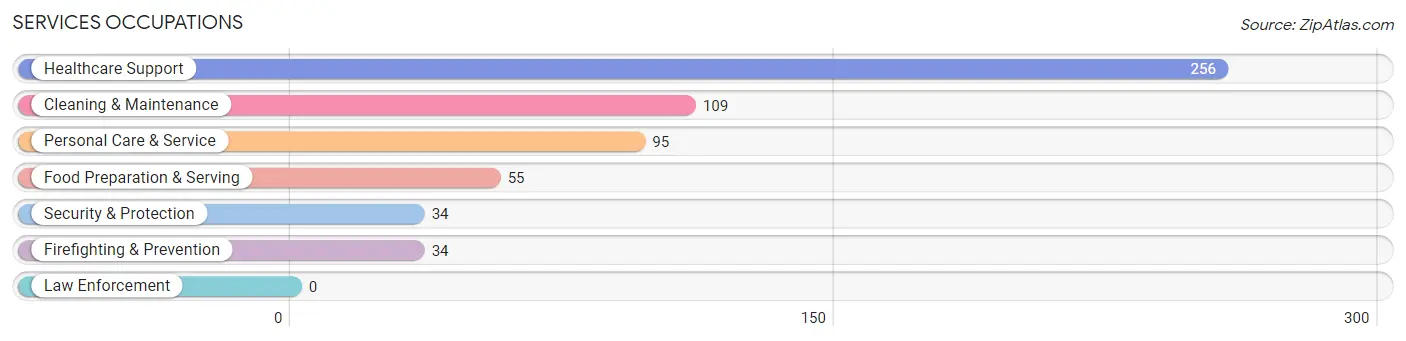
Services Occupations
The most common Services occupations in Angels are Healthcare Support (256 | 18.6%), Cleaning & Maintenance (109 | 7.9%), Personal Care & Service (95 | 6.9%), Food Preparation & Serving (55 | 4.0%), and Security & Protection (34 | 2.5%).
Services Occupations by Sex
Within the Services occupations in Angels, the most male-oriented occupations are Cleaning & Maintenance (70.6%), Security & Protection (61.8%), and Firefighting & Prevention (61.8%), while the most female-oriented occupations are Healthcare Support (100.0%), Food Preparation & Serving (85.5%), and Personal Care & Service (51.6%).
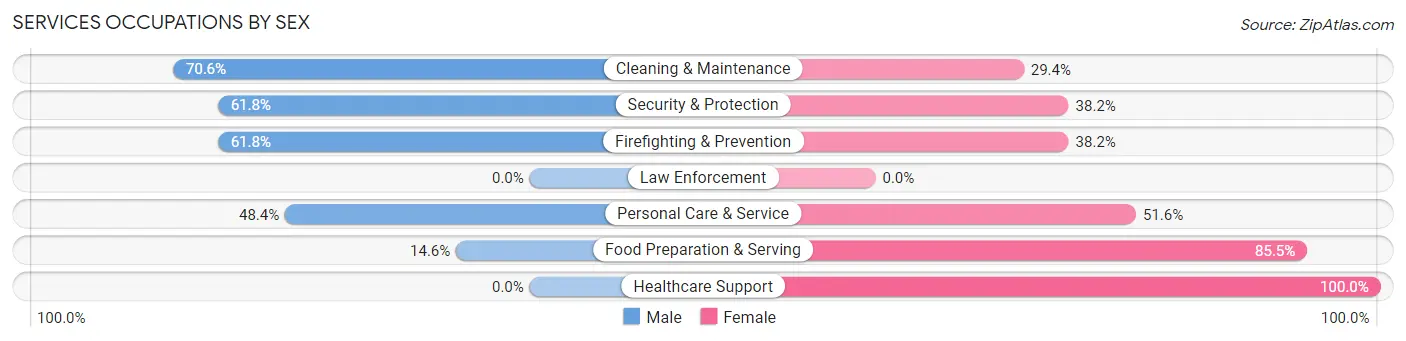
| Occupation | Male | Female |
| Healthcare Support | 0 (0.0%) | 256 (100.0%) |
| Security & Protection | 21 (61.8%) | 13 (38.2%) |
| Firefighting & Prevention | 21 (61.8%) | 13 (38.2%) |
| Law Enforcement | 0 (0.0%) | 0 (0.0%) |
| Food Preparation & Serving | 8 (14.5%) | 47 (85.5%) |
| Cleaning & Maintenance | 77 (70.6%) | 32 (29.4%) |
| Personal Care & Service | 46 (48.4%) | 49 (51.6%) |
| Total (Category) | 152 (27.7%) | 397 (72.3%) |
| Total (Overall) | 545 (39.7%) | 828 (60.3%) |
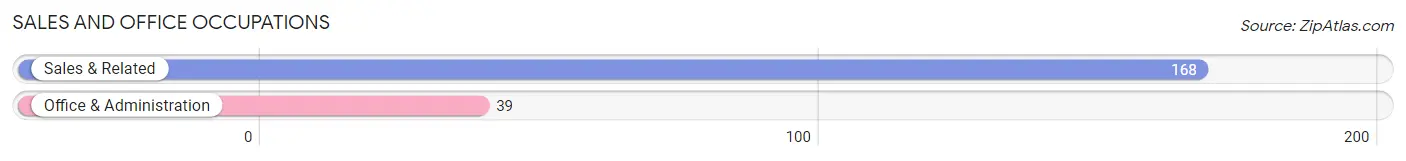
Sales and Office Occupations
The most common Sales and Office occupations in Angels are Sales & Related (168 | 12.2%), and Office & Administration (39 | 2.8%).
Sales and Office Occupations by Sex
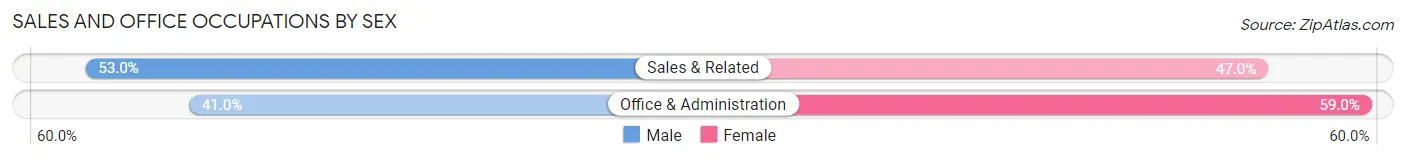
| Occupation | Male | Female |
| Sales & Related | 89 (53.0%) | 79 (47.0%) |
| Office & Administration | 16 (41.0%) | 23 (59.0%) |
| Total (Category) | 105 (50.7%) | 102 (49.3%) |
| Total (Overall) | 545 (39.7%) | 828 (60.3%) |
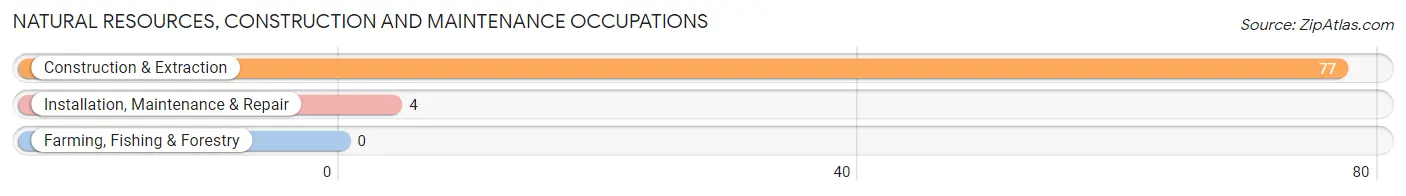
Natural Resources, Construction and Maintenance Occupations
The most common Natural Resources, Construction and Maintenance occupations in Angels are Construction & Extraction (77 | 5.6%), and Installation, Maintenance & Repair (4 | 0.3%).
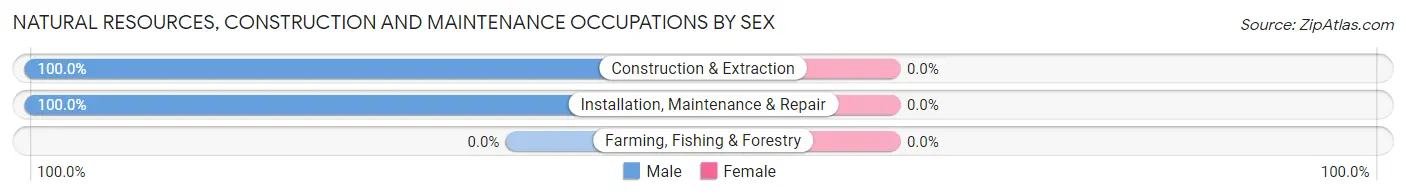
Natural Resources, Construction and Maintenance Occupations by Sex
| Occupation | Male | Female |
| Farming, Fishing & Forestry | 0 (0.0%) | 0 (0.0%) |
| Construction & Extraction | 77 (100.0%) | 0 (0.0%) |
| Installation, Maintenance & Repair | 4 (100.0%) | 0 (0.0%) |
| Total (Category) | 81 (100.0%) | 0 (0.0%) |
| Total (Overall) | 545 (39.7%) | 828 (60.3%) |
Production, Transportation and Moving Occupations
The most common Production, Transportation and Moving occupations in Angels are , and Production (60 | 4.4%).
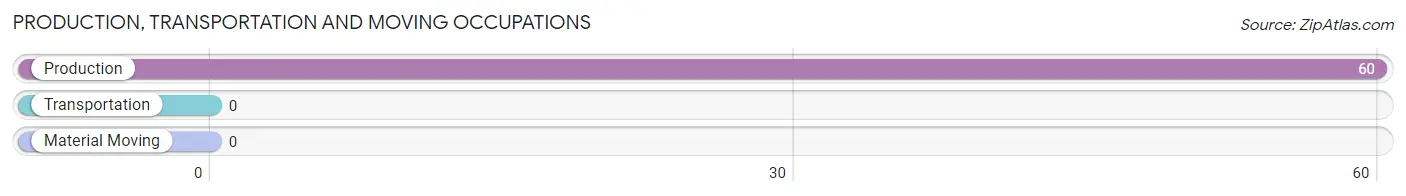
Production, Transportation and Moving Occupations by Sex
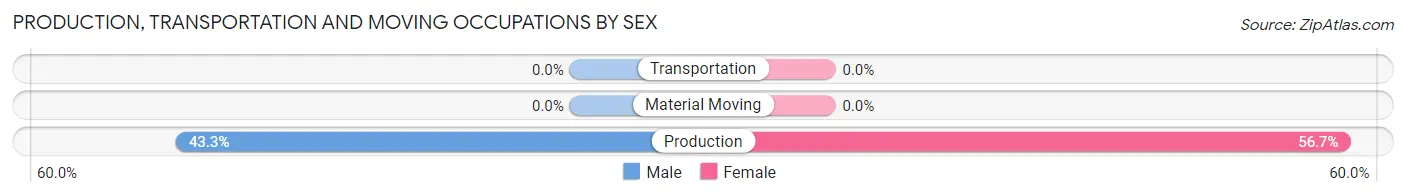
| Occupation | Male | Female |
| Production | 26 (43.3%) | 34 (56.7%) |
| Transportation | 0 (0.0%) | 0 (0.0%) |
| Material Moving | 0 (0.0%) | 0 (0.0%) |
| Total (Category) | 26 (43.3%) | 34 (56.7%) |
| Total (Overall) | 545 (39.7%) | 828 (60.3%) |
Employment Industries by Sex in Angels
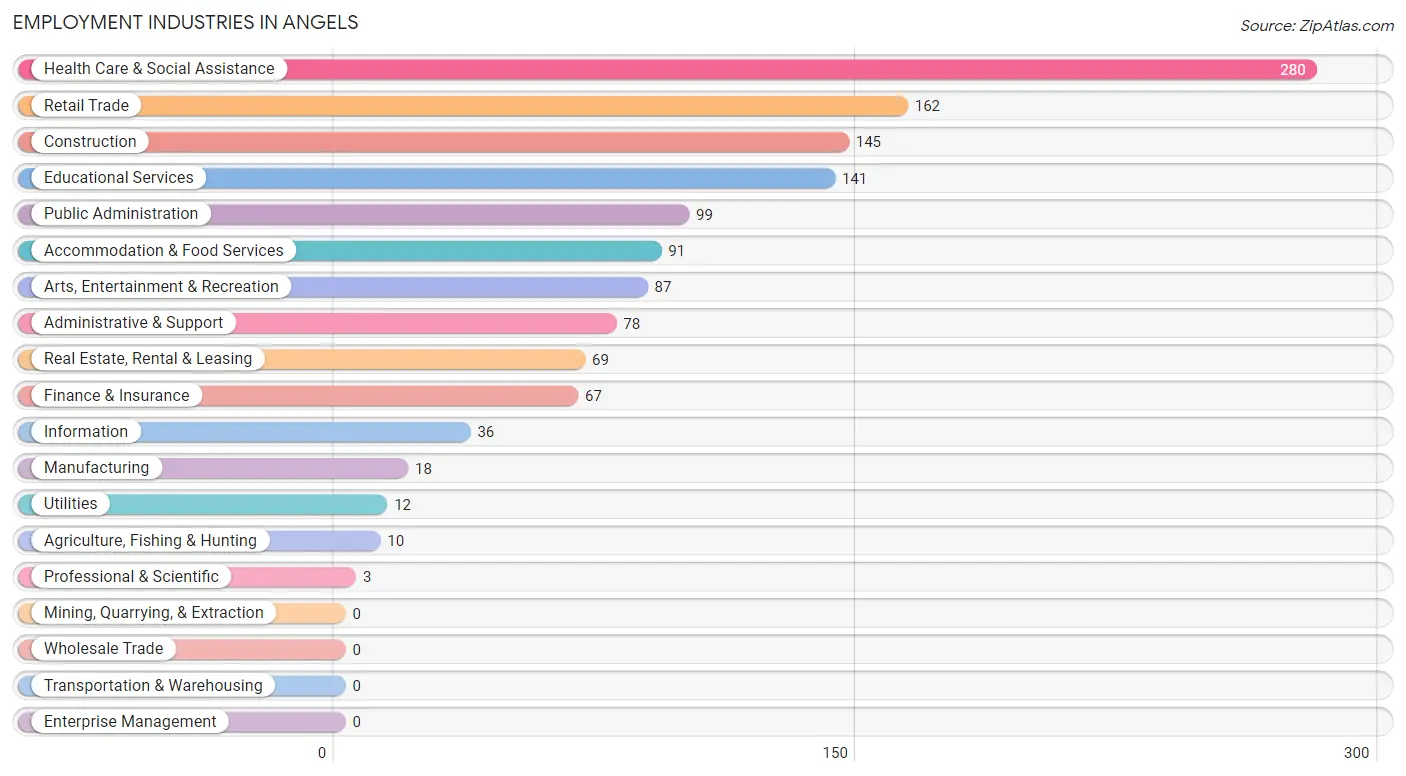
Employment Industries in Angels
The major employment industries in Angels include Health Care & Social Assistance (280 | 20.4%), Retail Trade (162 | 11.8%), Construction (145 | 10.6%), Educational Services (141 | 10.3%), and Public Administration (99 | 7.2%).
Employment Industries by Sex in Angels
The Angels industries that see more men than women are Agriculture, Fishing & Hunting (100.0%), Utilities (100.0%), and Real Estate, Rental & Leasing (100.0%), whereas the industries that tend to have a higher number of women are Information (100.0%), Finance & Insurance (100.0%), and Health Care & Social Assistance (95.4%).
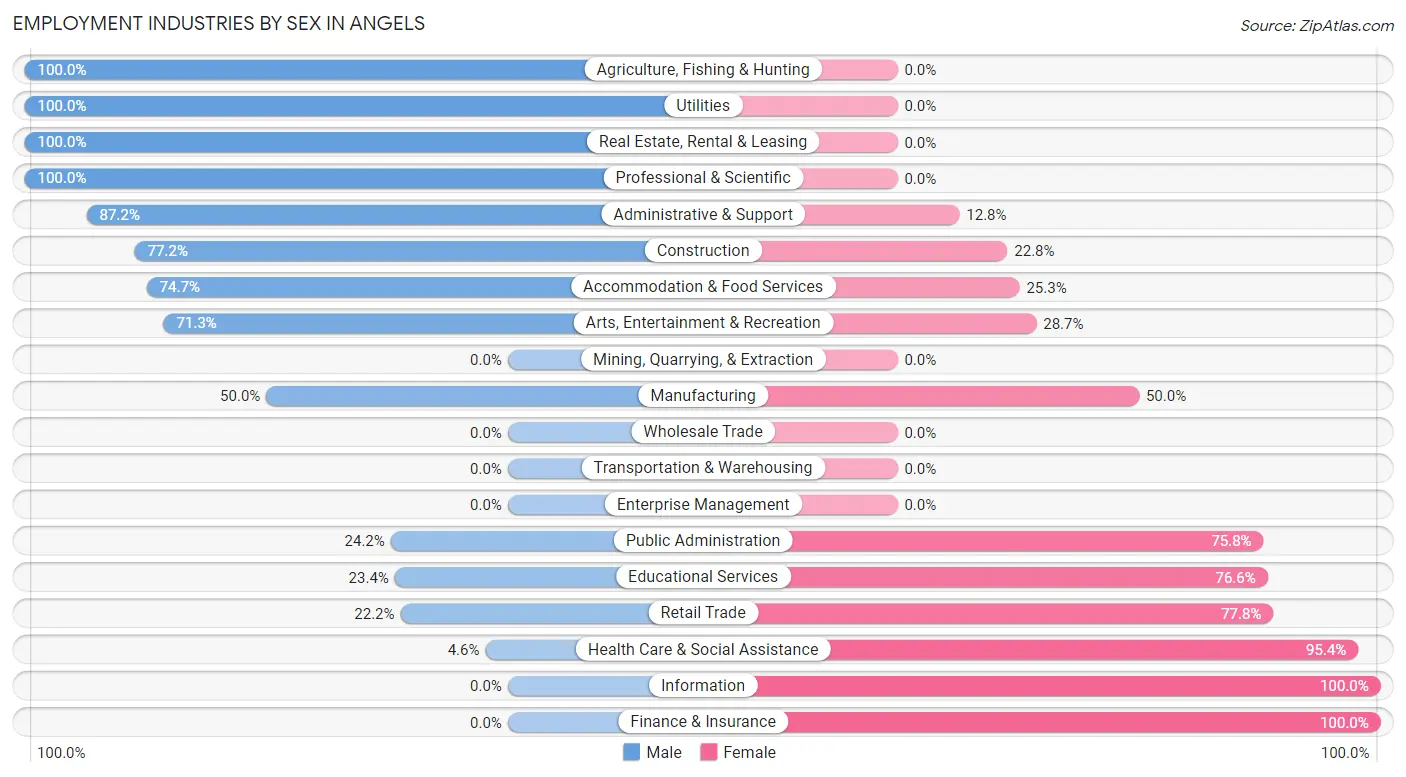
| Industry | Male | Female |
| Agriculture, Fishing & Hunting | 10 (100.0%) | 0 (0.0%) |
| Mining, Quarrying, & Extraction | 0 (0.0%) | 0 (0.0%) |
| Construction | 112 (77.2%) | 33 (22.8%) |
| Manufacturing | 9 (50.0%) | 9 (50.0%) |
| Wholesale Trade | 0 (0.0%) | 0 (0.0%) |
| Retail Trade | 36 (22.2%) | 126 (77.8%) |
| Transportation & Warehousing | 0 (0.0%) | 0 (0.0%) |
| Utilities | 12 (100.0%) | 0 (0.0%) |
| Information | 0 (0.0%) | 36 (100.0%) |
| Finance & Insurance | 0 (0.0%) | 67 (100.0%) |
| Real Estate, Rental & Leasing | 69 (100.0%) | 0 (0.0%) |
| Professional & Scientific | 3 (100.0%) | 0 (0.0%) |
| Enterprise Management | 0 (0.0%) | 0 (0.0%) |
| Administrative & Support | 68 (87.2%) | 10 (12.8%) |
| Educational Services | 33 (23.4%) | 108 (76.6%) |
| Health Care & Social Assistance | 13 (4.6%) | 267 (95.4%) |
| Arts, Entertainment & Recreation | 62 (71.3%) | 25 (28.7%) |
| Accommodation & Food Services | 68 (74.7%) | 23 (25.3%) |
| Public Administration | 24 (24.2%) | 75 (75.8%) |
| Total | 545 (39.7%) | 828 (60.3%) |
Education in Angels
School Enrollment in Angels
The most common levels of schooling among the 846 students in Angels are high school (290 | 34.3%), college / undergraduate (205 | 24.2%), and elementary school (197 | 23.3%).
| School Level | # Students | % Students |
| Nursery / Preschool | 43 | 5.1% |
| Kindergarten | 0 | 0.0% |
| Elementary School | 197 | 23.3% |
| Middle School | 111 | 13.1% |
| High School | 290 | 34.3% |
| College / Undergraduate | 205 | 24.2% |
| Graduate / Professional | 0 | 0.0% |
| Total | 846 | 100.0% |
School Enrollment by Age by Funding Source in Angels
Out of a total of 846 students who are enrolled in schools in Angels, 152 (18.0%) attend a private institution, while the remaining 694 (82.0%) are enrolled in public schools. The age group of 3 to 4 year olds has the highest likelihood of being enrolled in private schools, with 36 (83.7% in the age bracket) enrolled. Conversely, the age group of 5 to 9 year old has the lowest likelihood of being enrolled in a private school, with 189 (100.0% in the age bracket) attending a public institution.
| Age Bracket | Public School | Private School |
| 3 to 4 Year Olds | 7 (16.3%) | 36 (83.7%) |
| 5 to 9 Year Old | 189 (100.0%) | 0 (0.0%) |
| 10 to 14 Year Olds | 137 (100.0%) | 0 (0.0%) |
| 15 to 17 Year Olds | 153 (64.8%) | 83 (35.2%) |
| 18 to 19 Year Olds | 87 (100.0%) | 0 (0.0%) |
| 20 to 24 Year Olds | 62 (65.3%) | 33 (34.7%) |
| 25 to 34 Year Olds | 0 (0.0%) | 0 (0.0%) |
| 35 Years and over | 59 (100.0%) | 0 (0.0%) |
| Total | 694 (82.0%) | 152 (18.0%) |
Educational Attainment by Field of Study in Angels
Business (186 | 26.7%), liberal arts & history (116 | 16.6%), education (108 | 15.5%), arts & humanities (67 | 9.6%), and bio, nature & agricultural (44 | 6.3%) are the most common fields of study among 698 individuals in Angels who have obtained a bachelor's degree or higher.
| Field of Study | # Graduates | % Graduates |
| Computers & Mathematics | 24 | 3.4% |
| Bio, Nature & Agricultural | 44 | 6.3% |
| Physical & Health Sciences | 11 | 1.6% |
| Psychology | 41 | 5.9% |
| Social Sciences | 13 | 1.9% |
| Engineering | 29 | 4.2% |
| Multidisciplinary Studies | 9 | 1.3% |
| Science & Technology | 27 | 3.9% |
| Business | 186 | 26.7% |
| Education | 108 | 15.5% |
| Literature & Languages | 6 | 0.9% |
| Liberal Arts & History | 116 | 16.6% |
| Visual & Performing Arts | 6 | 0.9% |
| Communications | 11 | 1.6% |
| Arts & Humanities | 67 | 9.6% |
| Total | 698 | 100.0% |
Transportation & Commute in Angels
Vehicle Availability by Sex in Angels
The most prevalent vehicle ownership categories in Angels are males with 2 vehicles (255, accounting for 46.8%) and females with 2 vehicles (286, making up 33.2%).
| Vehicles Available | Male | Female |
| No Vehicle | 42 (7.7%) | 0 (0.0%) |
| 1 Vehicle | 59 (10.8%) | 156 (20.3%) |
| 2 Vehicles | 255 (46.8%) | 286 (37.2%) |
| 3 Vehicles | 54 (9.9%) | 72 (9.4%) |
| 4 Vehicles | 135 (24.8%) | 222 (28.9%) |
| 5 or more Vehicles | 0 (0.0%) | 33 (4.3%) |
| Total | 545 (100.0%) | 769 (100.0%) |
Commute Time in Angels
The most frequently occuring commute durations in Angels are less than 5 minutes (280 commuters, 23.9%), 30 to 34 minutes (197 commuters, 16.8%), and 20 to 24 minutes (180 commuters, 15.3%).
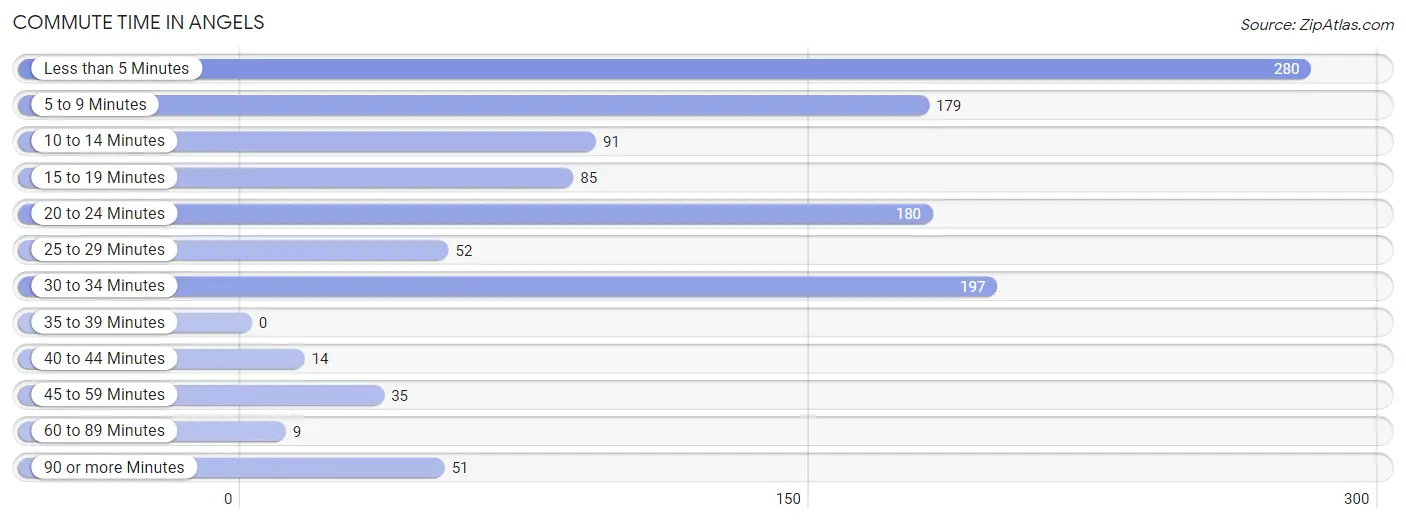
| Commute Time | # Commuters | % Commuters |
| Less than 5 Minutes | 280 | 23.9% |
| 5 to 9 Minutes | 179 | 15.3% |
| 10 to 14 Minutes | 91 | 7.8% |
| 15 to 19 Minutes | 85 | 7.2% |
| 20 to 24 Minutes | 180 | 15.3% |
| 25 to 29 Minutes | 52 | 4.4% |
| 30 to 34 Minutes | 197 | 16.8% |
| 35 to 39 Minutes | 0 | 0.0% |
| 40 to 44 Minutes | 14 | 1.2% |
| 45 to 59 Minutes | 35 | 3.0% |
| 60 to 89 Minutes | 9 | 0.8% |
| 90 or more Minutes | 51 | 4.3% |
Commute Time by Sex in Angels
The most common commute times in Angels are less than 5 minutes (187 commuters, 37.2%) for males and 20 to 24 minutes (170 commuters, 25.3%) for females.
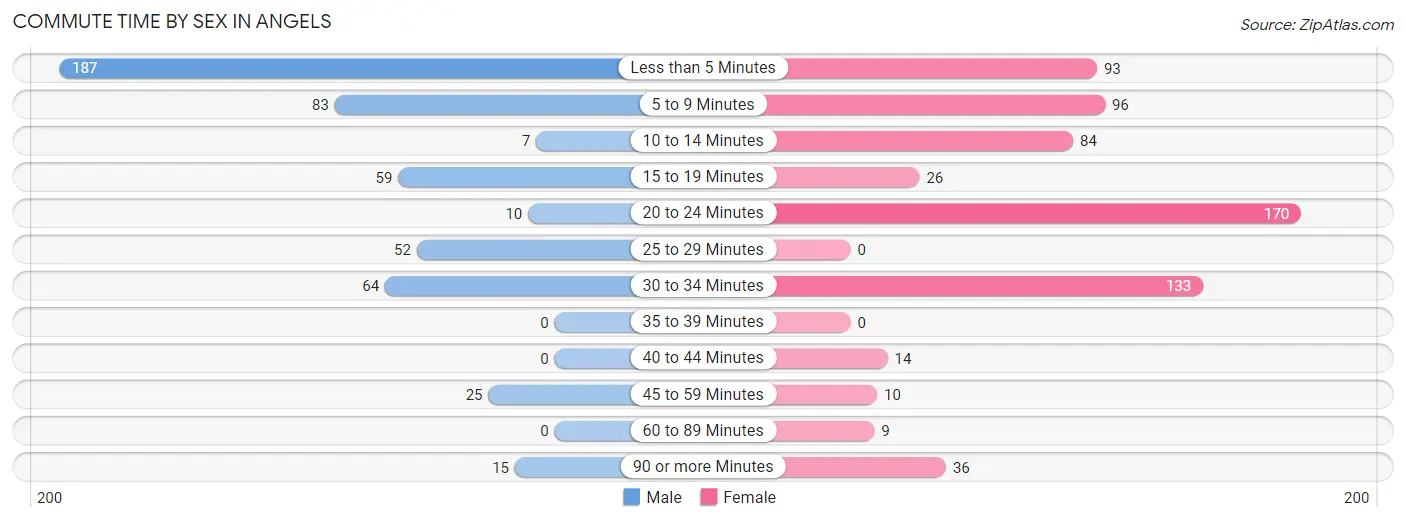
| Commute Time | Male | Female |
| Less than 5 Minutes | 187 (37.2%) | 93 (13.9%) |
| 5 to 9 Minutes | 83 (16.5%) | 96 (14.3%) |
| 10 to 14 Minutes | 7 (1.4%) | 84 (12.5%) |
| 15 to 19 Minutes | 59 (11.7%) | 26 (3.9%) |
| 20 to 24 Minutes | 10 (2.0%) | 170 (25.3%) |
| 25 to 29 Minutes | 52 (10.4%) | 0 (0.0%) |
| 30 to 34 Minutes | 64 (12.8%) | 133 (19.8%) |
| 35 to 39 Minutes | 0 (0.0%) | 0 (0.0%) |
| 40 to 44 Minutes | 0 (0.0%) | 14 (2.1%) |
| 45 to 59 Minutes | 25 (5.0%) | 10 (1.5%) |
| 60 to 89 Minutes | 0 (0.0%) | 9 (1.3%) |
| 90 or more Minutes | 15 (3.0%) | 36 (5.4%) |
Time of Departure to Work by Sex in Angels
The most frequent times of departure to work in Angels are 12:00 AM to 4:59 AM (116, 23.1%) for males and 7:00 AM to 7:29 AM (104, 15.5%) for females.
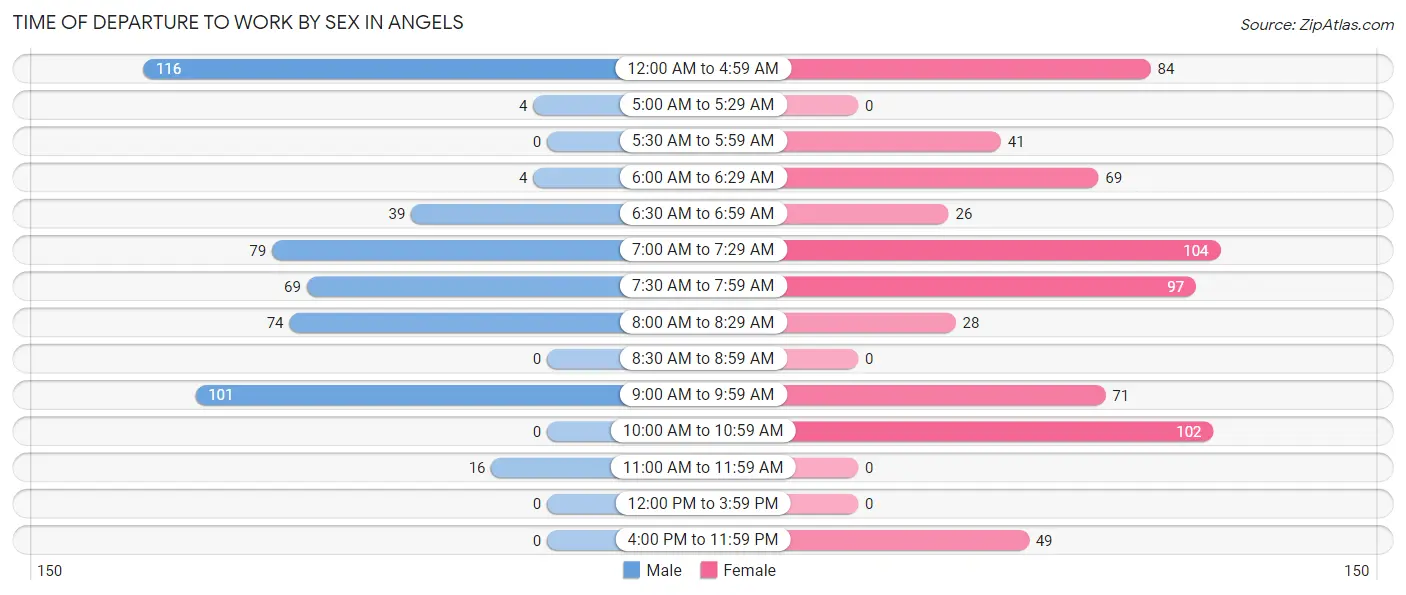
| Time of Departure | Male | Female |
| 12:00 AM to 4:59 AM | 116 (23.1%) | 84 (12.5%) |
| 5:00 AM to 5:29 AM | 4 (0.8%) | 0 (0.0%) |
| 5:30 AM to 5:59 AM | 0 (0.0%) | 41 (6.1%) |
| 6:00 AM to 6:29 AM | 4 (0.8%) | 69 (10.3%) |
| 6:30 AM to 6:59 AM | 39 (7.8%) | 26 (3.9%) |
| 7:00 AM to 7:29 AM | 79 (15.7%) | 104 (15.5%) |
| 7:30 AM to 7:59 AM | 69 (13.8%) | 97 (14.5%) |
| 8:00 AM to 8:29 AM | 74 (14.7%) | 28 (4.2%) |
| 8:30 AM to 8:59 AM | 0 (0.0%) | 0 (0.0%) |
| 9:00 AM to 9:59 AM | 101 (20.1%) | 71 (10.6%) |
| 10:00 AM to 10:59 AM | 0 (0.0%) | 102 (15.2%) |
| 11:00 AM to 11:59 AM | 16 (3.2%) | 0 (0.0%) |
| 12:00 PM to 3:59 PM | 0 (0.0%) | 0 (0.0%) |
| 4:00 PM to 11:59 PM | 0 (0.0%) | 49 (7.3%) |
| Total | 502 (100.0%) | 671 (100.0%) |
Housing Occupancy in Angels
Occupancy by Ownership in Angels
Of the total 1,576 dwellings in Angels, owner-occupied units account for 1,153 (73.2%), while renter-occupied units make up 423 (26.8%).
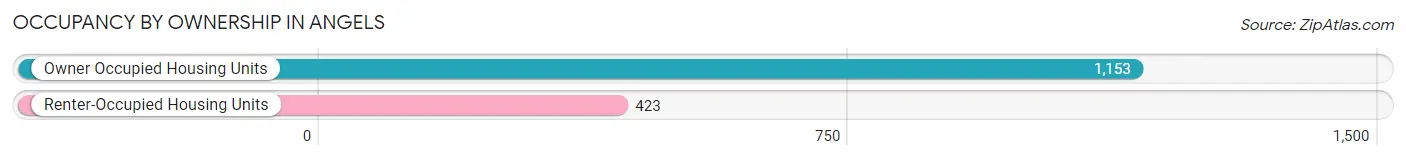
| Occupancy | # Housing Units | % Housing Units |
| Owner Occupied Housing Units | 1,153 | 73.2% |
| Renter-Occupied Housing Units | 423 | 26.8% |
| Total Occupied Housing Units | 1,576 | 100.0% |
Occupancy by Household Size in Angels
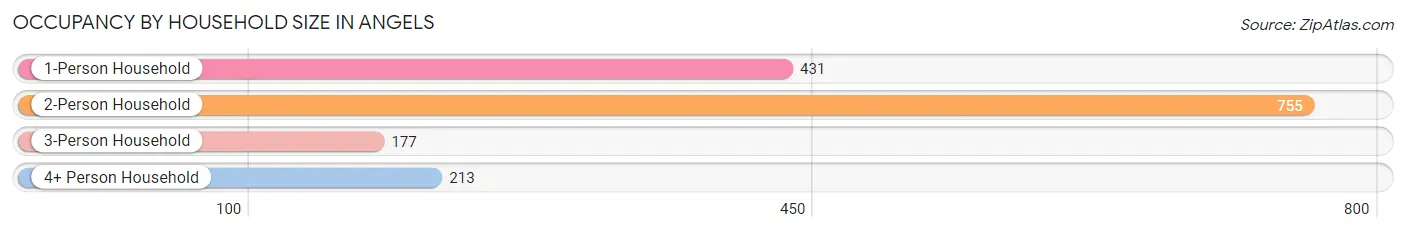
| Household Size | # Housing Units | % Housing Units |
| 1-Person Household | 431 | 27.4% |
| 2-Person Household | 755 | 47.9% |
| 3-Person Household | 177 | 11.2% |
| 4+ Person Household | 213 | 13.5% |
| Total Housing Units | 1,576 | 100.0% |
Occupancy by Ownership by Household Size in Angels
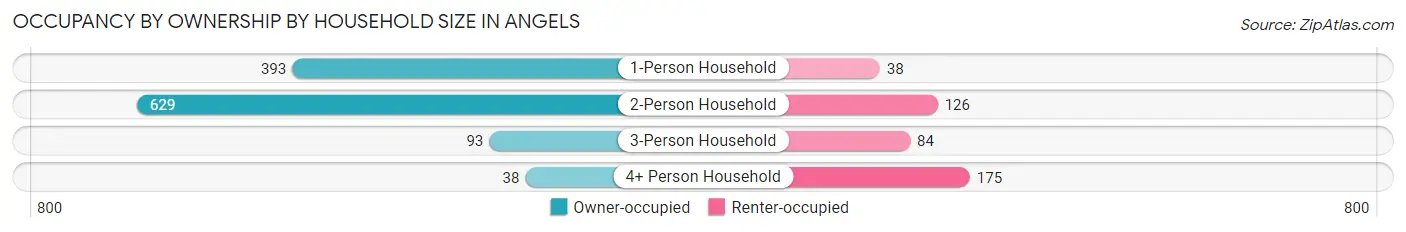
| Household Size | Owner-occupied | Renter-occupied |
| 1-Person Household | 393 (91.2%) | 38 (8.8%) |
| 2-Person Household | 629 (83.3%) | 126 (16.7%) |
| 3-Person Household | 93 (52.5%) | 84 (47.5%) |
| 4+ Person Household | 38 (17.8%) | 175 (82.2%) |
| Total Housing Units | 1,153 (73.2%) | 423 (26.8%) |
Occupancy by Educational Attainment in Angels
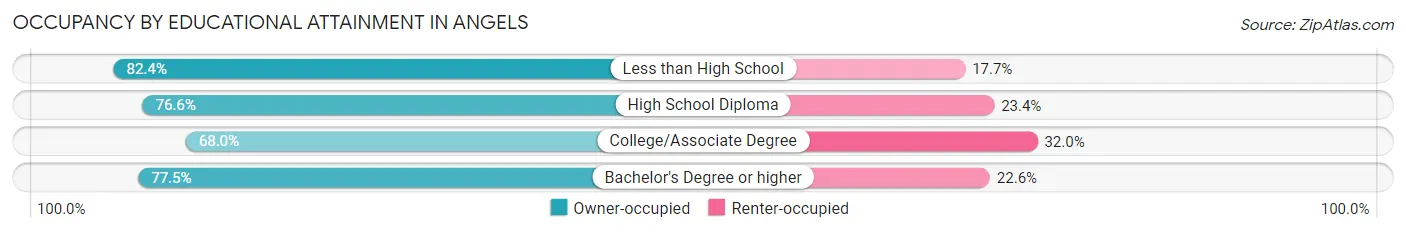
| Household Size | Owner-occupied | Renter-occupied |
| Less than High School | 112 (82.4%) | 24 (17.6%) |
| High School Diploma | 180 (76.6%) | 55 (23.4%) |
| College/Associate Degree | 521 (68.0%) | 245 (32.0%) |
| Bachelor's Degree or higher | 340 (77.4%) | 99 (22.6%) |
Occupancy by Age of Householder in Angels
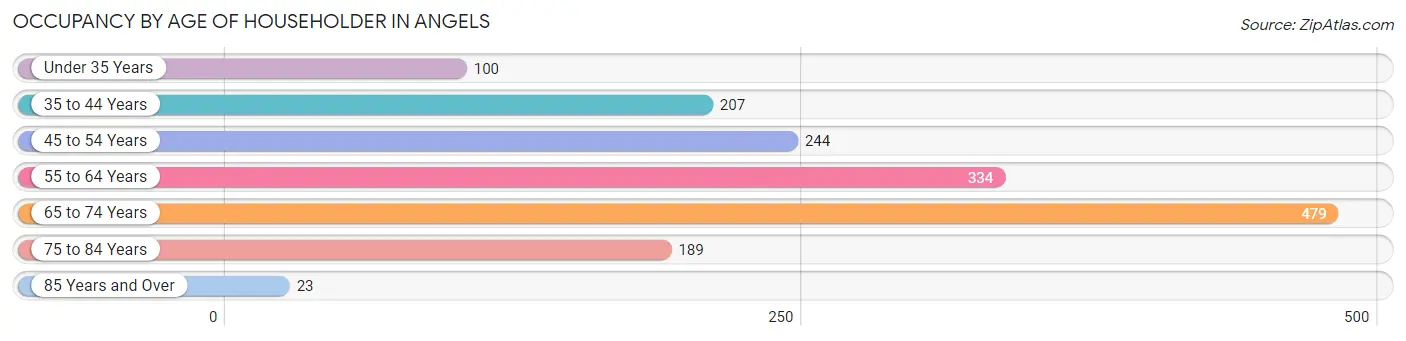
| Age Bracket | # Households | % Households |
| Under 35 Years | 100 | 6.4% |
| 35 to 44 Years | 207 | 13.1% |
| 45 to 54 Years | 244 | 15.5% |
| 55 to 64 Years | 334 | 21.2% |
| 65 to 74 Years | 479 | 30.4% |
| 75 to 84 Years | 189 | 12.0% |
| 85 Years and Over | 23 | 1.5% |
| Total | 1,576 | 100.0% |
Housing Finances in Angels
Median Income by Occupancy in Angels
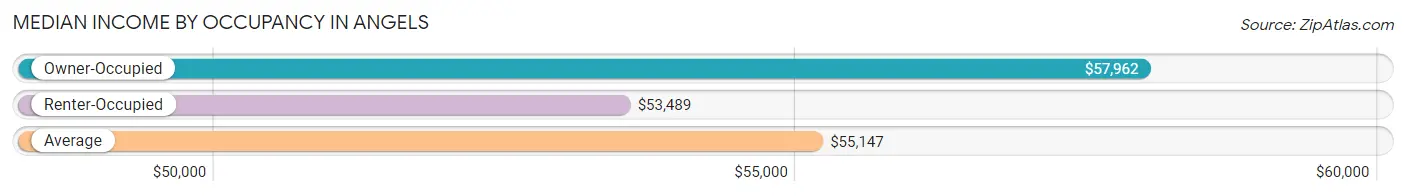
| Occupancy Type | # Households | Median Income |
| Owner-Occupied | 1,153 (73.2%) | $57,962 |
| Renter-Occupied | 423 (26.8%) | $53,489 |
| Average | 1,576 (100.0%) | $55,147 |
Occupancy by Householder Income Bracket in Angels
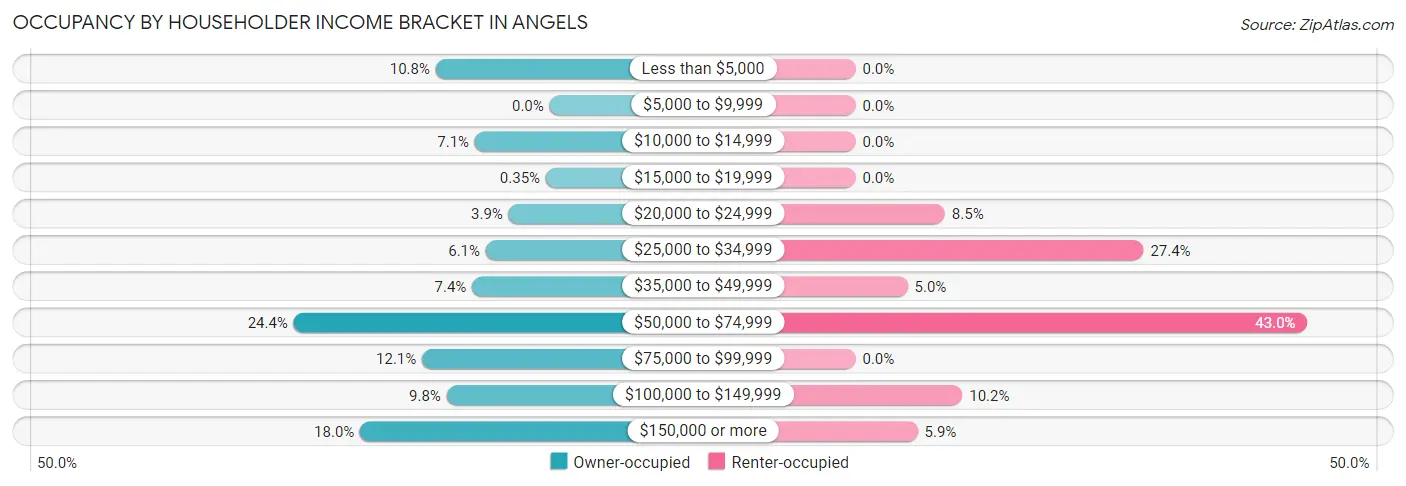
| Income Bracket | Owner-occupied | Renter-occupied |
| Less than $5,000 | 125 (10.8%) | 0 (0.0%) |
| $5,000 to $9,999 | 0 (0.0%) | 0 (0.0%) |
| $10,000 to $14,999 | 82 (7.1%) | 0 (0.0%) |
| $15,000 to $19,999 | 4 (0.4%) | 0 (0.0%) |
| $20,000 to $24,999 | 45 (3.9%) | 36 (8.5%) |
| $25,000 to $34,999 | 70 (6.1%) | 116 (27.4%) |
| $35,000 to $49,999 | 85 (7.4%) | 21 (5.0%) |
| $50,000 to $74,999 | 281 (24.4%) | 182 (43.0%) |
| $75,000 to $99,999 | 140 (12.1%) | 0 (0.0%) |
| $100,000 to $149,999 | 113 (9.8%) | 43 (10.2%) |
| $150,000 or more | 208 (18.0%) | 25 (5.9%) |
| Total | 1,153 (100.0%) | 423 (100.0%) |
Monthly Housing Cost Tiers in Angels
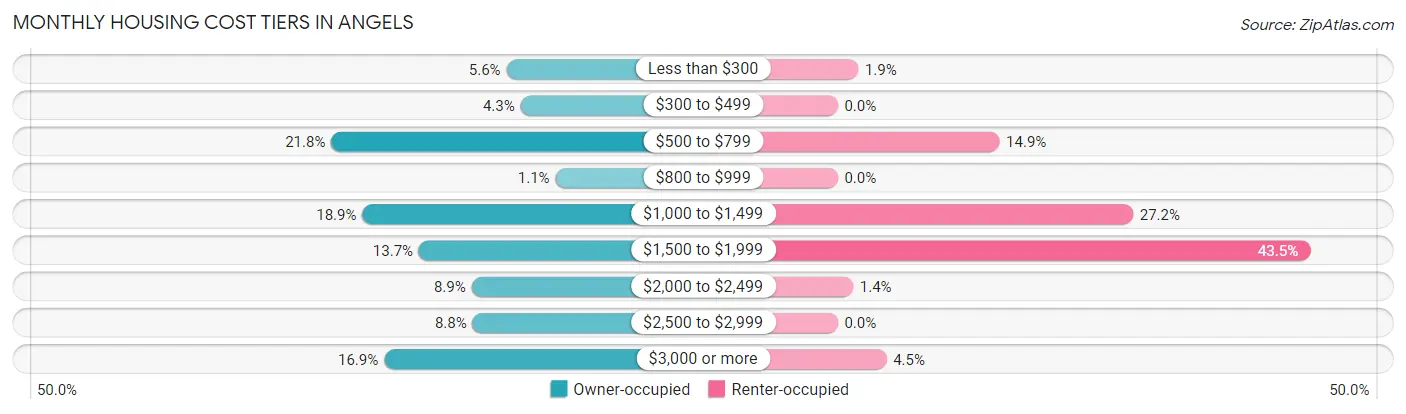
| Monthly Cost | Owner-occupied | Renter-occupied |
| Less than $300 | 65 (5.6%) | 8 (1.9%) |
| $300 to $499 | 50 (4.3%) | 0 (0.0%) |
| $500 to $799 | 251 (21.8%) | 63 (14.9%) |
| $800 to $999 | 13 (1.1%) | 0 (0.0%) |
| $1,000 to $1,499 | 218 (18.9%) | 115 (27.2%) |
| $1,500 to $1,999 | 158 (13.7%) | 184 (43.5%) |
| $2,000 to $2,499 | 102 (8.8%) | 6 (1.4%) |
| $2,500 to $2,999 | 101 (8.8%) | 0 (0.0%) |
| $3,000 or more | 195 (16.9%) | 19 (4.5%) |
| Total | 1,153 (100.0%) | 423 (100.0%) |
Physical Housing Characteristics in Angels
Housing Structures in Angels
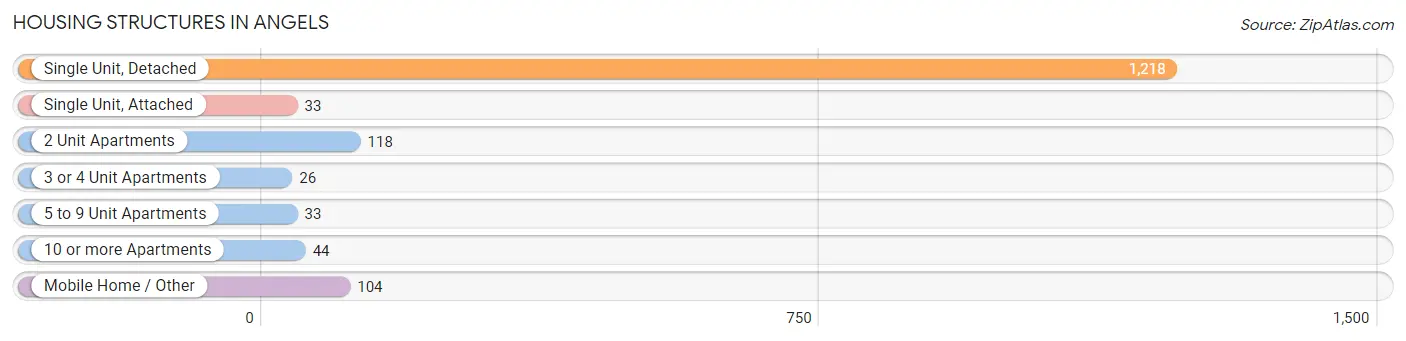
| Structure Type | # Housing Units | % Housing Units |
| Single Unit, Detached | 1,218 | 77.3% |
| Single Unit, Attached | 33 | 2.1% |
| 2 Unit Apartments | 118 | 7.5% |
| 3 or 4 Unit Apartments | 26 | 1.7% |
| 5 to 9 Unit Apartments | 33 | 2.1% |
| 10 or more Apartments | 44 | 2.8% |
| Mobile Home / Other | 104 | 6.6% |
| Total | 1,576 | 100.0% |
Housing Structures by Occupancy in Angels
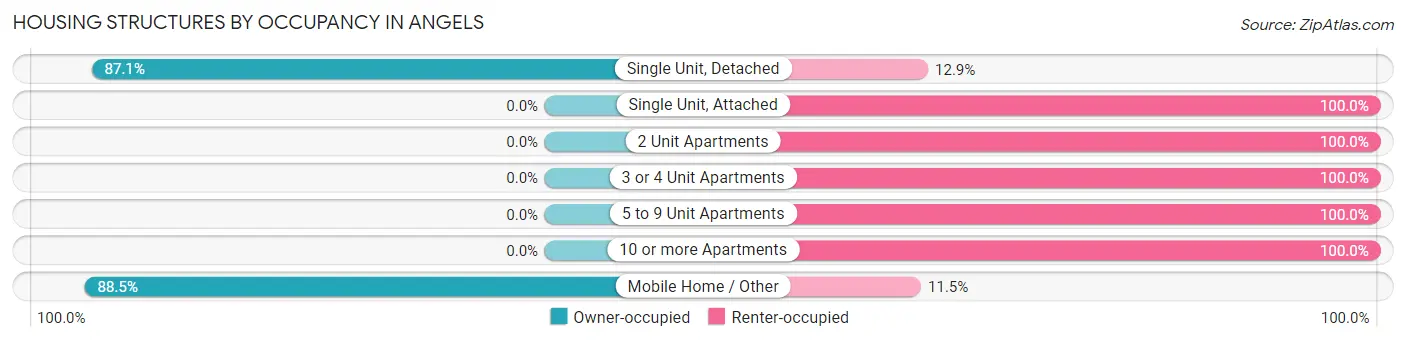
| Structure Type | Owner-occupied | Renter-occupied |
| Single Unit, Detached | 1,061 (87.1%) | 157 (12.9%) |
| Single Unit, Attached | 0 (0.0%) | 33 (100.0%) |
| 2 Unit Apartments | 0 (0.0%) | 118 (100.0%) |
| 3 or 4 Unit Apartments | 0 (0.0%) | 26 (100.0%) |
| 5 to 9 Unit Apartments | 0 (0.0%) | 33 (100.0%) |
| 10 or more Apartments | 0 (0.0%) | 44 (100.0%) |
| Mobile Home / Other | 92 (88.5%) | 12 (11.5%) |
| Total | 1,153 (73.2%) | 423 (26.8%) |
Housing Structures by Number of Rooms in Angels
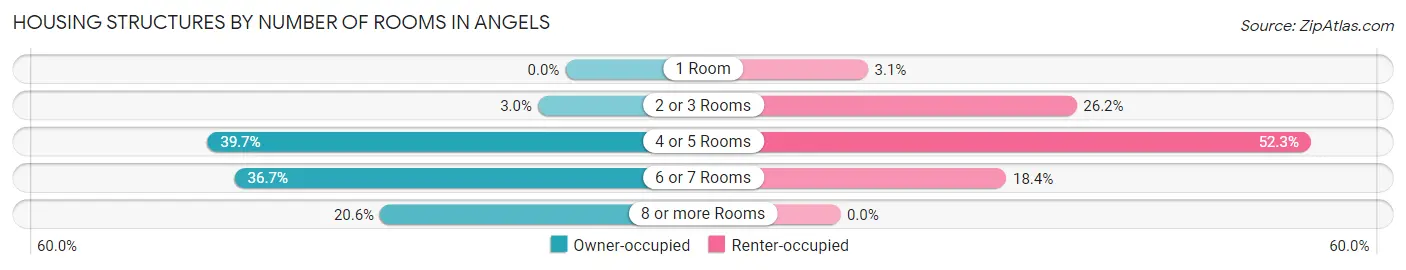
| Number of Rooms | Owner-occupied | Renter-occupied |
| 1 Room | 0 (0.0%) | 13 (3.1%) |
| 2 or 3 Rooms | 35 (3.0%) | 111 (26.2%) |
| 4 or 5 Rooms | 458 (39.7%) | 221 (52.2%) |
| 6 or 7 Rooms | 423 (36.7%) | 78 (18.4%) |
| 8 or more Rooms | 237 (20.6%) | 0 (0.0%) |
| Total | 1,153 (100.0%) | 423 (100.0%) |
Housing Structure by Heating Type in Angels
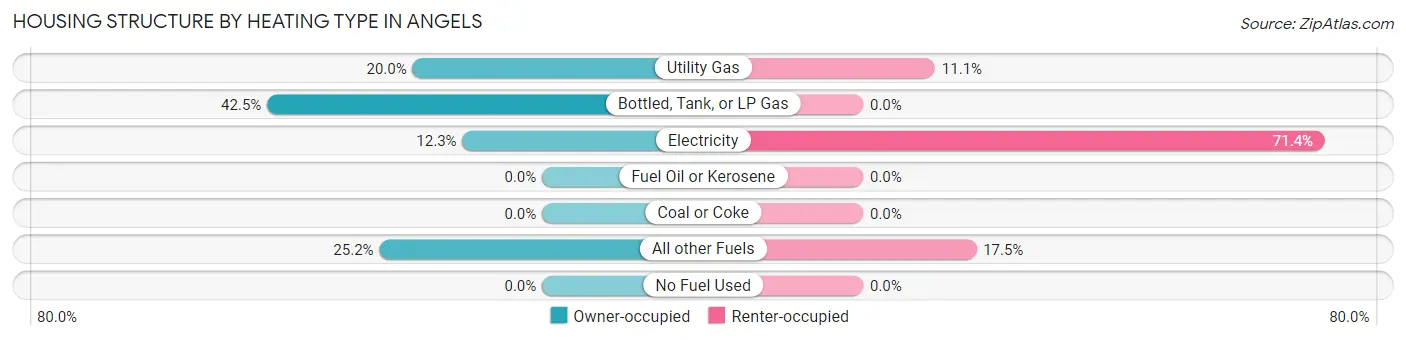
| Heating Type | Owner-occupied | Renter-occupied |
| Utility Gas | 231 (20.0%) | 47 (11.1%) |
| Bottled, Tank, or LP Gas | 490 (42.5%) | 0 (0.0%) |
| Electricity | 142 (12.3%) | 302 (71.4%) |
| Fuel Oil or Kerosene | 0 (0.0%) | 0 (0.0%) |
| Coal or Coke | 0 (0.0%) | 0 (0.0%) |
| All other Fuels | 290 (25.2%) | 74 (17.5%) |
| No Fuel Used | 0 (0.0%) | 0 (0.0%) |
| Total | 1,153 (100.0%) | 423 (100.0%) |
Household Vehicle Usage in Angels
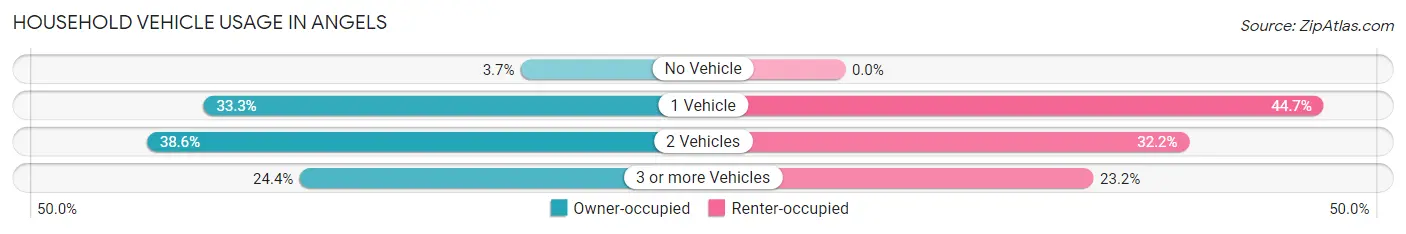
| Vehicles per Household | Owner-occupied | Renter-occupied |
| No Vehicle | 43 (3.7%) | 0 (0.0%) |
| 1 Vehicle | 384 (33.3%) | 189 (44.7%) |
| 2 Vehicles | 445 (38.6%) | 136 (32.2%) |
| 3 or more Vehicles | 281 (24.4%) | 98 (23.2%) |
| Total | 1,153 (100.0%) | 423 (100.0%) |
Real Estate & Mortgages in Angels
Real Estate and Mortgage Overview in Angels
| Characteristic | Without Mortgage | With Mortgage |
| Housing Units | 563 | 590 |
| Median Property Value | $366,900 | $479,000 |
| Median Household Income | $53,627 | $175 |
| Monthly Housing Costs | $596 | $195 |
| Real Estate Taxes | $2,138 | $0 |
Property Value by Mortgage Status in Angels
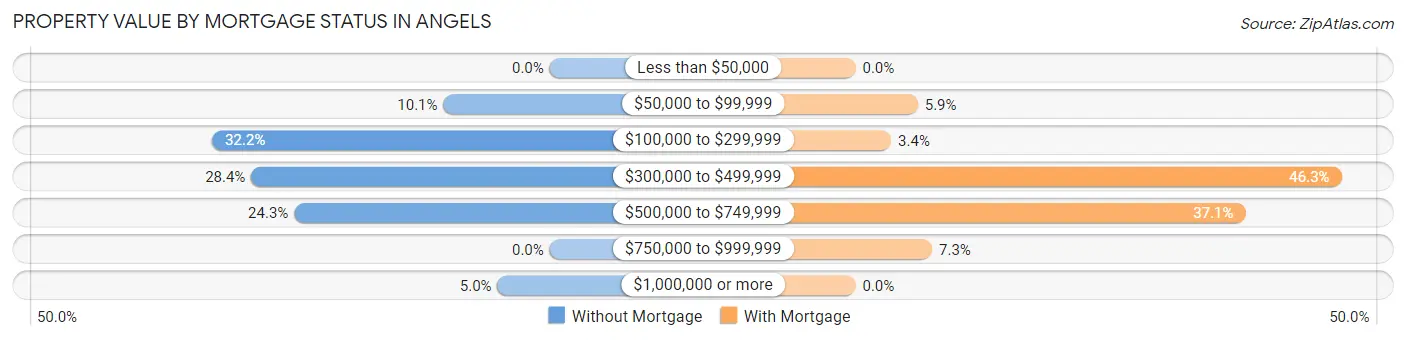
| Property Value | Without Mortgage | With Mortgage |
| Less than $50,000 | 0 (0.0%) | 0 (0.0%) |
| $50,000 to $99,999 | 57 (10.1%) | 35 (5.9%) |
| $100,000 to $299,999 | 181 (32.2%) | 20 (3.4%) |
| $300,000 to $499,999 | 160 (28.4%) | 273 (46.3%) |
| $500,000 to $749,999 | 137 (24.3%) | 219 (37.1%) |
| $750,000 to $999,999 | 0 (0.0%) | 43 (7.3%) |
| $1,000,000 or more | 28 (5.0%) | 0 (0.0%) |
| Total | 563 (100.0%) | 590 (100.0%) |
Household Income by Mortgage Status in Angels
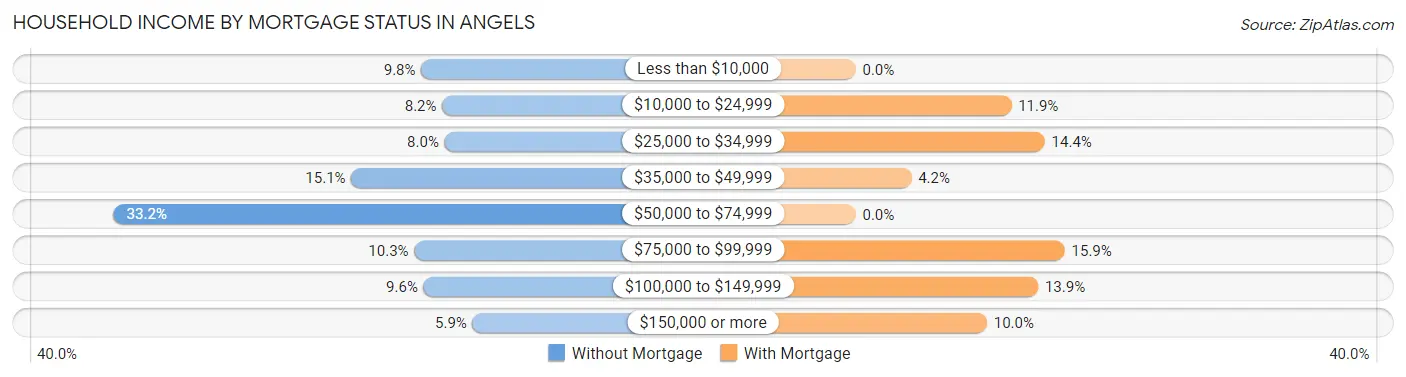
| Household Income | Without Mortgage | With Mortgage |
| Less than $10,000 | 55 (9.8%) | 0 (0.0%) |
| $10,000 to $24,999 | 46 (8.2%) | 70 (11.9%) |
| $25,000 to $34,999 | 45 (8.0%) | 85 (14.4%) |
| $35,000 to $49,999 | 85 (15.1%) | 25 (4.2%) |
| $50,000 to $74,999 | 187 (33.2%) | 0 (0.0%) |
| $75,000 to $99,999 | 58 (10.3%) | 94 (15.9%) |
| $100,000 to $149,999 | 54 (9.6%) | 82 (13.9%) |
| $150,000 or more | 33 (5.9%) | 59 (10.0%) |
| Total | 563 (100.0%) | 590 (100.0%) |
Property Value to Household Income Ratio in Angels
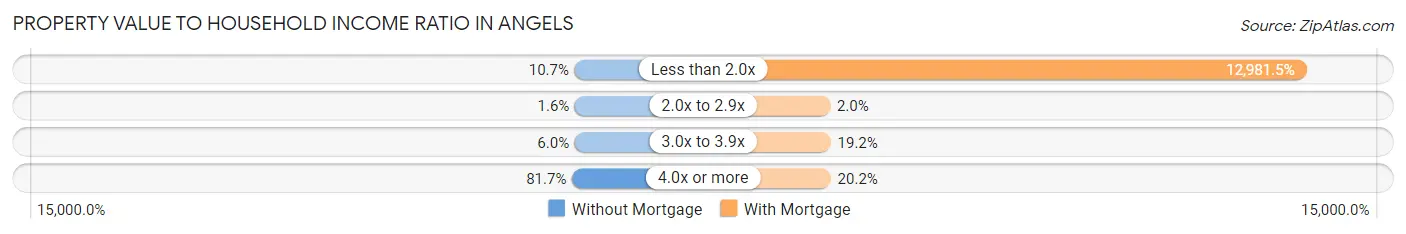
| Value-to-Income Ratio | Without Mortgage | With Mortgage |
| Less than 2.0x | 60 (10.7%) | 76,591 (12,981.5%) |
| 2.0x to 2.9x | 9 (1.6%) | 12 (2.0%) |
| 3.0x to 3.9x | 34 (6.0%) | 113 (19.2%) |
| 4.0x or more | 460 (81.7%) | 119 (20.2%) |
| Total | 563 (100.0%) | 590 (100.0%) |
Real Estate Taxes by Mortgage Status in Angels
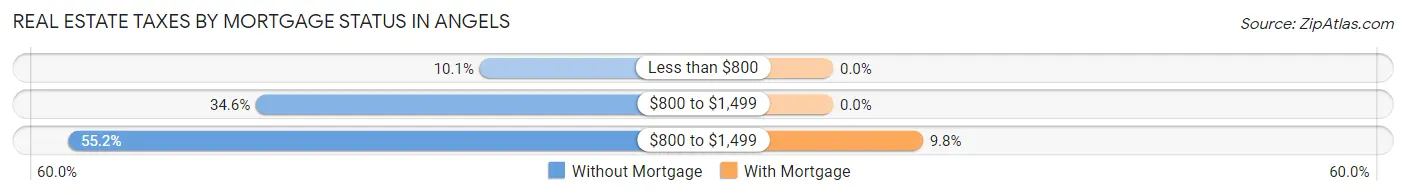
| Property Taxes | Without Mortgage | With Mortgage |
| Less than $800 | 57 (10.1%) | 0 (0.0%) |
| $800 to $1,499 | 195 (34.6%) | 0 (0.0%) |
| $800 to $1,499 | 311 (55.2%) | 58 (9.8%) |
| Total | 563 (100.0%) | 590 (100.0%) |
Health & Disability in Angels
Health Insurance Coverage by Age in Angels
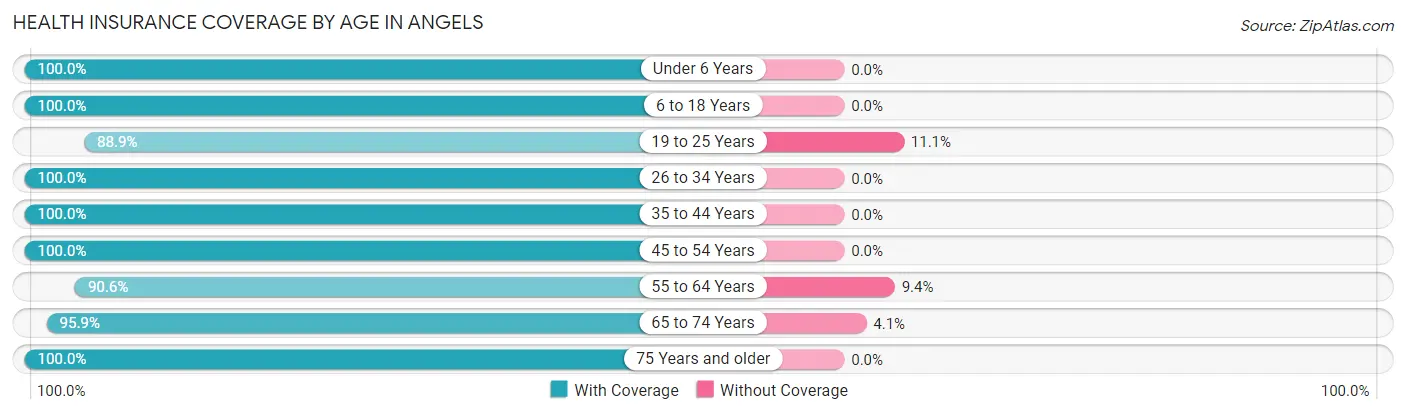
| Age Bracket | With Coverage | Without Coverage |
| Under 6 Years | 97 (100.0%) | 0 (0.0%) |
| 6 to 18 Years | 685 (100.0%) | 0 (0.0%) |
| 19 to 25 Years | 152 (88.9%) | 19 (11.1%) |
| 26 to 34 Years | 123 (100.0%) | 0 (0.0%) |
| 35 to 44 Years | 399 (100.0%) | 0 (0.0%) |
| 45 to 54 Years | 451 (100.0%) | 0 (0.0%) |
| 55 to 64 Years | 501 (90.6%) | 52 (9.4%) |
| 65 to 74 Years | 793 (95.9%) | 34 (4.1%) |
| 75 Years and older | 408 (100.0%) | 0 (0.0%) |
| Total | 3,609 (97.2%) | 105 (2.8%) |
Health Insurance Coverage by Citizenship Status in Angels
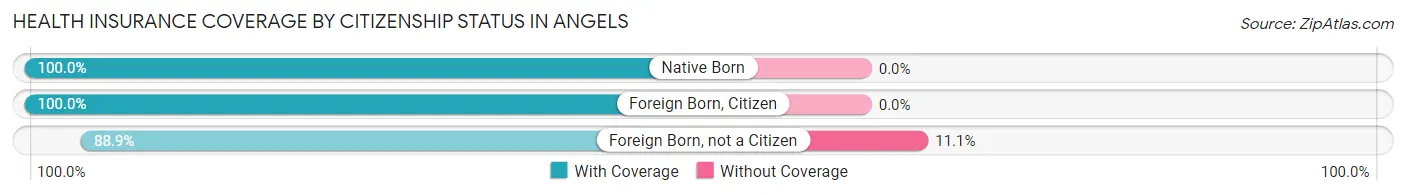
| Citizenship Status | With Coverage | Without Coverage |
| Native Born | 97 (100.0%) | 0 (0.0%) |
| Foreign Born, Citizen | 685 (100.0%) | 0 (0.0%) |
| Foreign Born, not a Citizen | 152 (88.9%) | 19 (11.1%) |
Health Insurance Coverage by Household Income in Angels
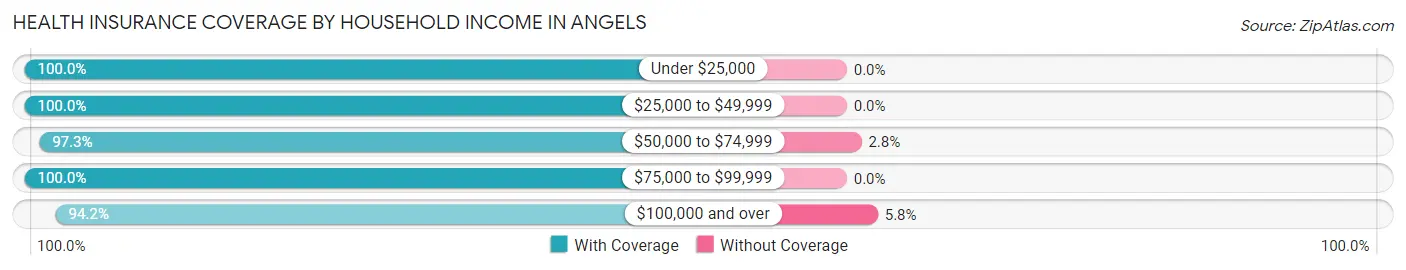
| Household Income | With Coverage | Without Coverage |
| Under $25,000 | 474 (100.0%) | 0 (0.0%) |
| $25,000 to $49,999 | 513 (100.0%) | 0 (0.0%) |
| $50,000 to $74,999 | 1,204 (97.3%) | 34 (2.8%) |
| $75,000 to $99,999 | 241 (100.0%) | 0 (0.0%) |
| $100,000 and over | 1,151 (94.2%) | 71 (5.8%) |
Public vs Private Health Insurance Coverage by Age in Angels
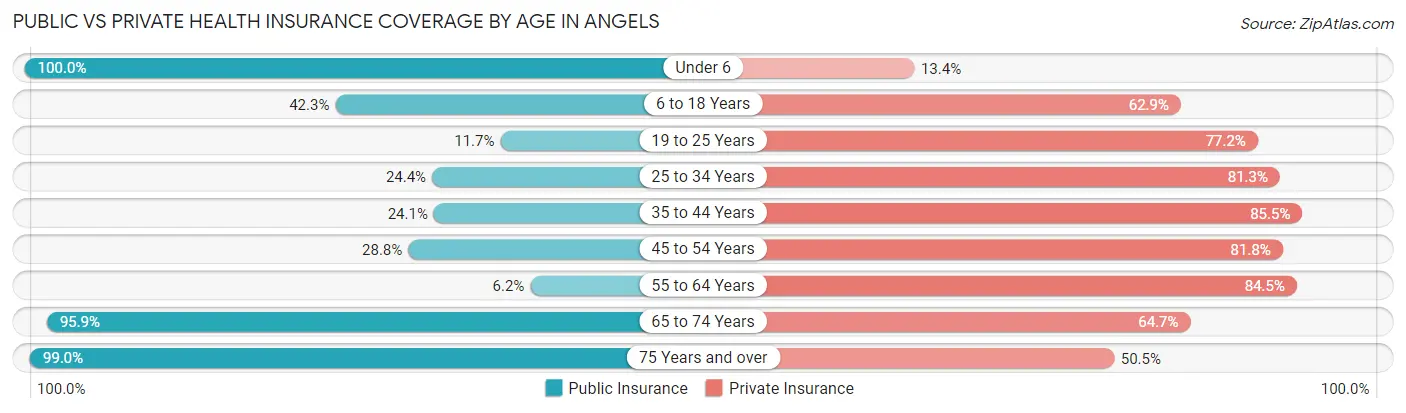
| Age Bracket | Public Insurance | Private Insurance |
| Under 6 | 97 (100.0%) | 13 (13.4%) |
| 6 to 18 Years | 290 (42.3%) | 431 (62.9%) |
| 19 to 25 Years | 20 (11.7%) | 132 (77.2%) |
| 25 to 34 Years | 30 (24.4%) | 100 (81.3%) |
| 35 to 44 Years | 96 (24.1%) | 341 (85.5%) |
| 45 to 54 Years | 130 (28.8%) | 369 (81.8%) |
| 55 to 64 Years | 34 (6.1%) | 467 (84.5%) |
| 65 to 74 Years | 793 (95.9%) | 535 (64.7%) |
| 75 Years and over | 404 (99.0%) | 206 (50.5%) |
| Total | 1,894 (51.0%) | 2,594 (69.8%) |
Disability Status by Sex by Age in Angels
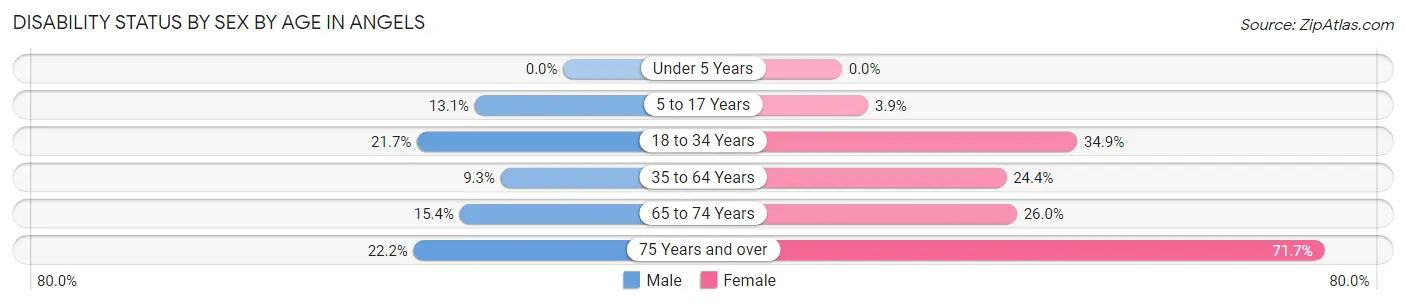
| Age Bracket | Male | Female |
| Under 5 Years | 0 (0.0%) | 0 (0.0%) |
| 5 to 17 Years | 55 (13.1%) | 7 (3.9%) |
| 18 to 34 Years | 33 (21.7%) | 80 (34.9%) |
| 35 to 64 Years | 47 (9.3%) | 219 (24.4%) |
| 65 to 74 Years | 52 (15.4%) | 127 (26.0%) |
| 75 Years and over | 42 (22.2%) | 157 (71.7%) |
Disability Class by Sex by Age in Angels
Disability Class: Hearing Difficulty
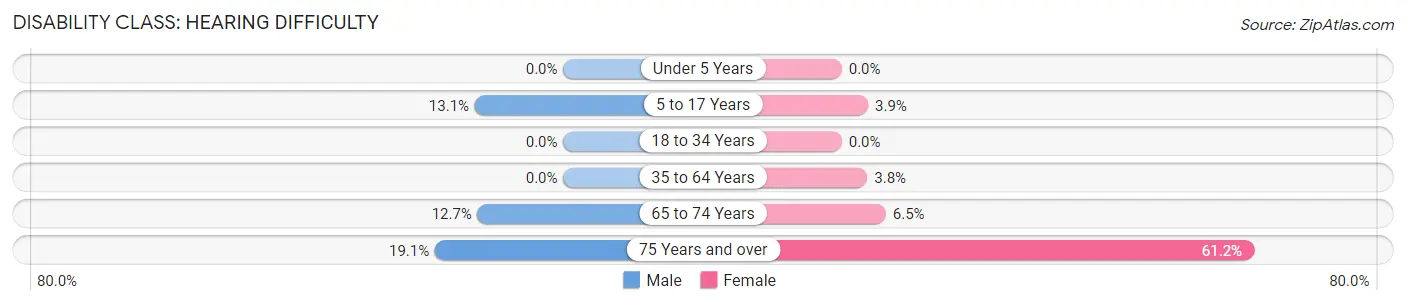
| Age Bracket | Male | Female |
| Under 5 Years | 0 (0.0%) | 0 (0.0%) |
| 5 to 17 Years | 55 (13.1%) | 7 (3.9%) |
| 18 to 34 Years | 0 (0.0%) | 0 (0.0%) |
| 35 to 64 Years | 0 (0.0%) | 34 (3.8%) |
| 65 to 74 Years | 43 (12.7%) | 32 (6.5%) |
| 75 Years and over | 36 (19.1%) | 134 (61.2%) |
Disability Class: Vision Difficulty
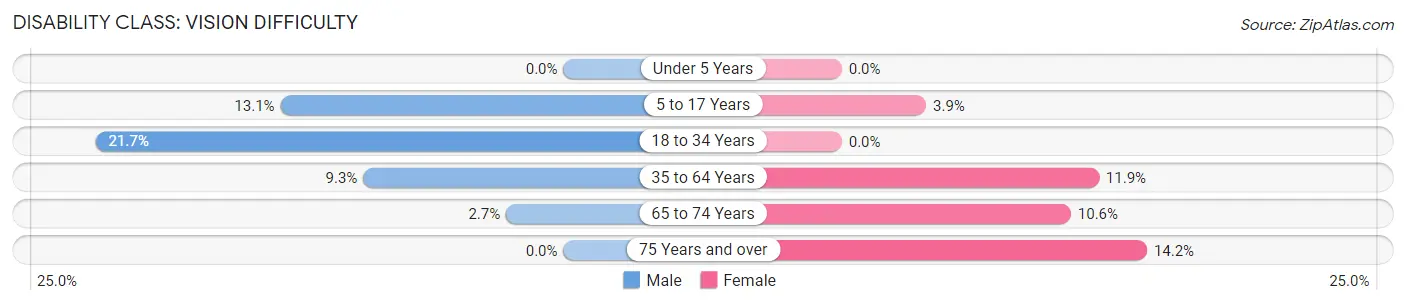
| Age Bracket | Male | Female |
| Under 5 Years | 0 (0.0%) | 0 (0.0%) |
| 5 to 17 Years | 55 (13.1%) | 7 (3.9%) |
| 18 to 34 Years | 33 (21.7%) | 0 (0.0%) |
| 35 to 64 Years | 47 (9.3%) | 107 (11.9%) |
| 65 to 74 Years | 9 (2.7%) | 52 (10.6%) |
| 75 Years and over | 0 (0.0%) | 31 (14.2%) |
Disability Class: Cognitive Difficulty
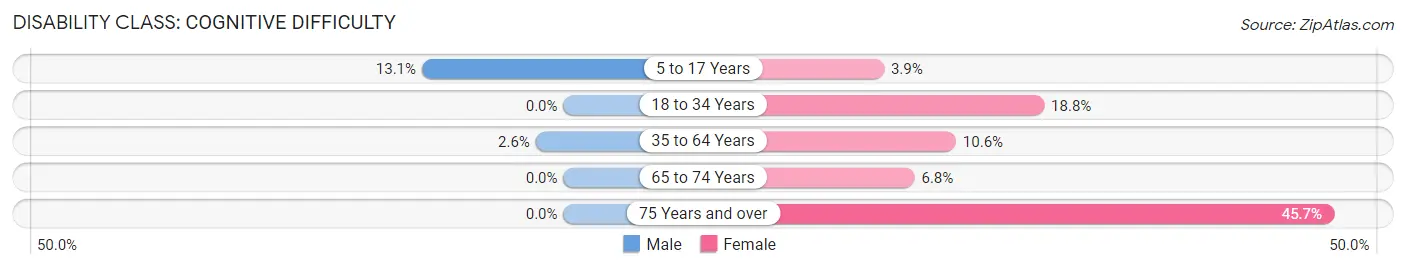
| Age Bracket | Male | Female |
| 5 to 17 Years | 55 (13.1%) | 7 (3.9%) |
| 18 to 34 Years | 0 (0.0%) | 43 (18.8%) |
| 35 to 64 Years | 13 (2.6%) | 95 (10.6%) |
| 65 to 74 Years | 0 (0.0%) | 33 (6.8%) |
| 75 Years and over | 0 (0.0%) | 100 (45.7%) |
Disability Class: Ambulatory Difficulty
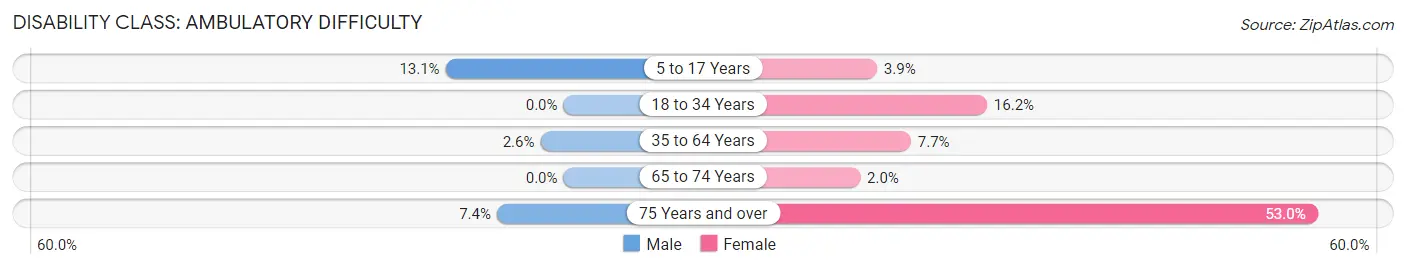
| Age Bracket | Male | Female |
| 5 to 17 Years | 55 (13.1%) | 7 (3.9%) |
| 18 to 34 Years | 0 (0.0%) | 37 (16.2%) |
| 35 to 64 Years | 13 (2.6%) | 69 (7.7%) |
| 65 to 74 Years | 0 (0.0%) | 10 (2.0%) |
| 75 Years and over | 14 (7.4%) | 116 (53.0%) |
Disability Class: Self-Care Difficulty
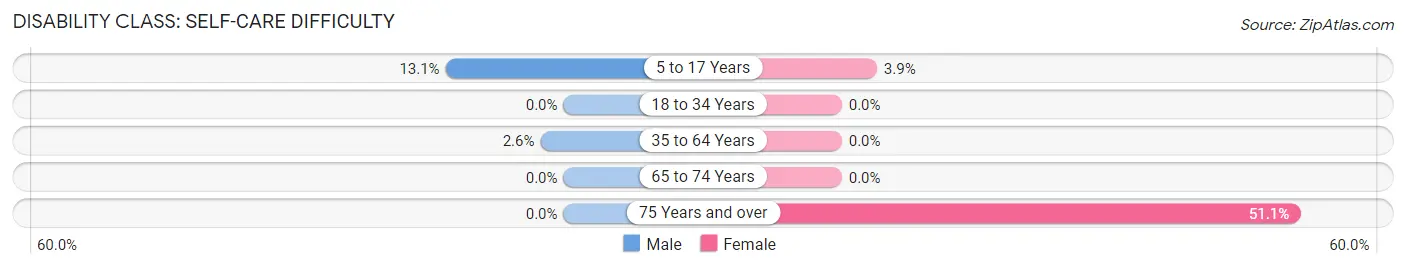
| Age Bracket | Male | Female |
| 5 to 17 Years | 55 (13.1%) | 7 (3.9%) |
| 18 to 34 Years | 0 (0.0%) | 0 (0.0%) |
| 35 to 64 Years | 13 (2.6%) | 0 (0.0%) |
| 65 to 74 Years | 0 (0.0%) | 0 (0.0%) |
| 75 Years and over | 0 (0.0%) | 112 (51.1%) |
Technology Access in Angels
Computing Device Access in Angels
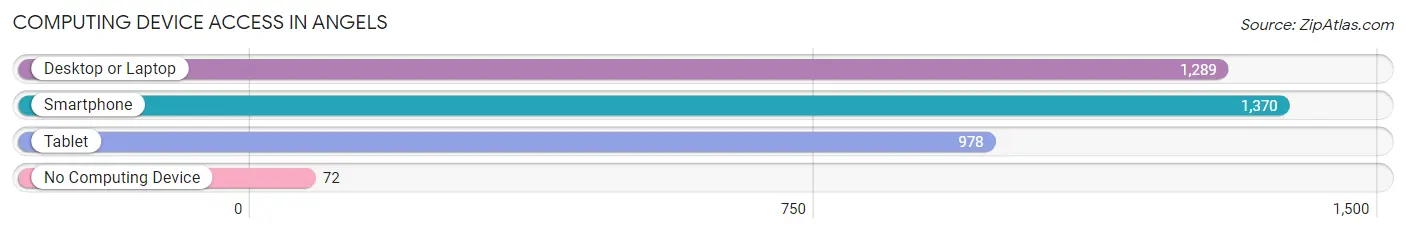
| Device Type | # Households | % Households |
| Desktop or Laptop | 1,289 | 81.8% |
| Smartphone | 1,370 | 86.9% |
| Tablet | 978 | 62.1% |
| No Computing Device | 72 | 4.6% |
| Total | 1,576 | 100.0% |
Internet Access in Angels
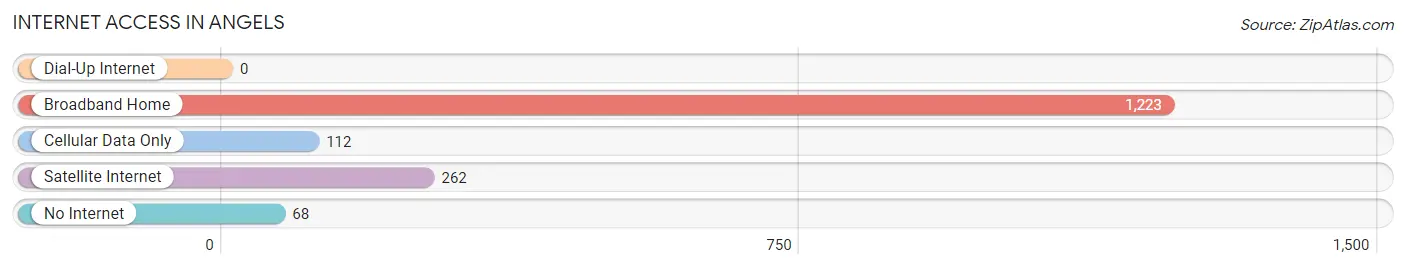
| Internet Type | # Households | % Households |
| Dial-Up Internet | 0 | 0.0% |
| Broadband Home | 1,223 | 77.6% |
| Cellular Data Only | 112 | 7.1% |
| Satellite Internet | 262 | 16.6% |
| No Internet | 68 | 4.3% |
| Total | 1,576 | 100.0% |
Angels Summary
Angels, California is a small city located in Los Angeles County, California. It is situated in the San Gabriel Valley, about 25 miles east of downtown Los Angeles. The city was incorporated in 1913 and has a population of approximately 3,500 people.
History
The area that is now Angels was originally inhabited by the Tongva people, who were the original inhabitants of the Los Angeles Basin. The area was first settled by Spanish missionaries in the late 1700s, and the city was officially founded in 1875. The city was named after the Angels Flight funicular railway, which was built in 1901 and connected the city to downtown Los Angeles.
The city experienced rapid growth in the early 20th century, and by the 1920s it had become a popular tourist destination. The city was also home to a number of movie studios, including Universal Studios, which was located in the city from 1915 to 1927.
Geography
Angels is located in the San Gabriel Valley, about 25 miles east of downtown Los Angeles. The city is situated at the base of the San Gabriel Mountains, and is surrounded by the cities of Pasadena, South Pasadena, and Alhambra. The city covers an area of 1.3 square miles, and has an elevation of 645 feet.
Economy
The economy of Angels is largely based on tourism and retail. The city is home to a number of popular tourist attractions, including the Angels Flight funicular railway, the Angels Walk shopping center, and the Angels Museum of Art. The city is also home to a number of retail stores, restaurants, and other businesses.
Demographics
As of the 2010 census, the population of Angels was 3,500. The racial makeup of the city was 57.3% White, 2.2% African American, 0.7% Native American, 8.2% Asian, 0.2% Pacific Islander, and 31.4% from other races. The median household income was $45,000, and the median age was 37.
Conclusion
Angels, California is a small city located in Los Angeles County, California. It is situated in the San Gabriel Valley, about 25 miles east of downtown Los Angeles. The city was incorporated in 1913 and has a population of approximately 3,500 people. The economy of Angels is largely based on tourism and retail, and the city is home to a number of popular tourist attractions. The racial makeup of the city is 57.3% White, 2.2% African American, 0.7% Native American, 8.2% Asian, 0.2% Pacific Islander, and 31.4% from other races. The median household income was $45,000, and the median age was 37.
Common Questions
What is Per Capita Income in Angels?
Per Capita income in Angels is $32,304.
What is the Median Family Income in Angels?
Median Family Income in Angels is $59,808.
What is the Median Household income in Angels?
Median Household Income in Angels is $55,147.
What is Income or Wage Gap in Angels?
Income or Wage Gap in Angels is 51.0%.
Women in Angels earn 49.0 cents for every dollar earned by a man.
What is Inequality or Gini Index in Angels?
Inequality or Gini Index in Angels is 0.43.
What is the Total Population of Angels?
Total Population of Angels is 3,714.
What is the Total Male Population of Angels?
Total Male Population of Angels is 1,649.
What is the Total Female Population of Angels?
Total Female Population of Angels is 2,065.
What is the Ratio of Males per 100 Females in Angels?
There are 79.85 Males per 100 Females in Angels.
What is the Ratio of Females per 100 Males in Angels?
There are 125.23 Females per 100 Males in Angels.
What is the Median Population Age in Angels?
Median Population Age in Angels is 54.3 Years.
What is the Average Family Size in Angels
Average Family Size in Angels is 2.8 People.
What is the Average Household Size in Angels
Average Household Size in Angels is 2.3 People.
How Large is the Labor Force in Angels?
There are 1,476 People in the Labor Forcein in Angels.
What is the Percentage of People in the Labor Force in Angels?
46.3% of People are in the Labor Force in Angels.
What is the Unemployment Rate in Angels?
Unemployment Rate in Angels is 6.9%.