Cities with the Highest Costs of Housing as Percentage of Income in Oregon
RELATED REPORTS & OPTIONS
Highest Housing Costs / Income
Oregon
Compare Cities
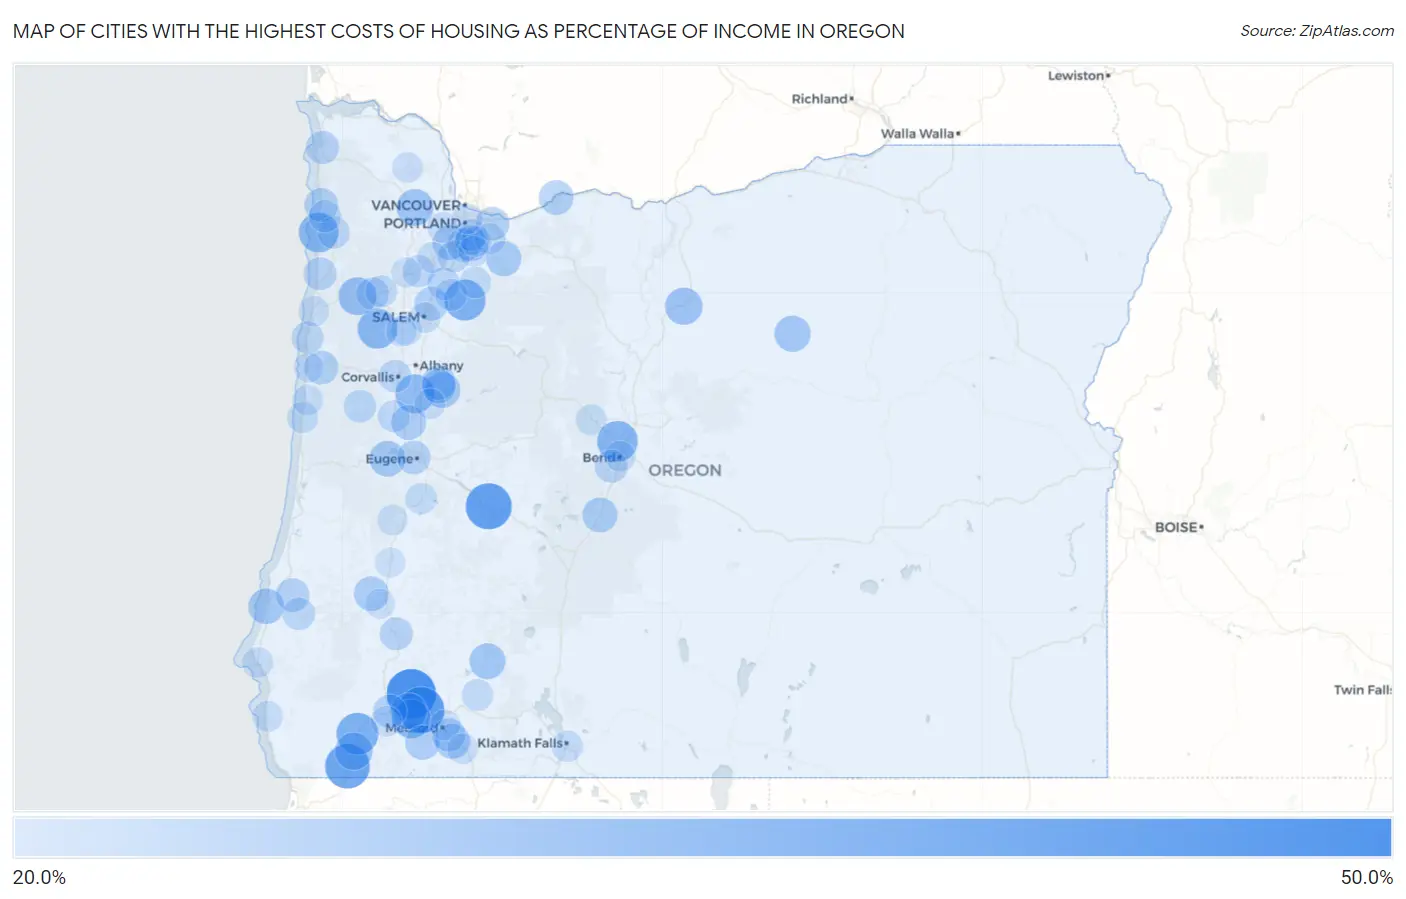
Map of Cities with the Highest Costs of Housing as Percentage of Income in Oregon
0.0%
50.0%
Cities with the Highest Costs of Housing as Percentage of Income in Oregon
| City | Housing Costs / Income | vs State | vs National | |
| 1. | Wimer | 41.2% | 22.5%(+18.7)#1 | 20.4%(+20.8)#161 |
| 2. | Gold Hill | 38.1% | 22.5%(+15.6)#2 | 20.4%(+17.8)#243 |
| 3. | Oakridge | 37.8% | 22.5%(+15.3)#3 | 20.4%(+17.5)#253 |
| 4. | O Brien | 36.6% | 22.5%(+14.1)#4 | 20.4%(+16.2)#320 |
| 5. | Rocky Point | 36.5% | 22.5%(+13.9)#5 | 20.4%(+16.1)#326 |
| 6. | Selma | 34.0% | 22.5%(+11.5)#6 | 20.4%(+13.6)#474 |
| 7. | Scotts Mills | 33.4% | 22.5%(+10.9)#7 | 20.4%(+13.0)#518 |
| 8. | Tumalo | 32.9% | 22.5%(+10.4)#8 | 20.4%(+12.5)#570 |
| 9. | Oceanside | 32.2% | 22.5%(+9.67)#9 | 20.4%(+11.8)#643 |
| 10. | Falls City | 32.1% | 22.5%(+9.56)#10 | 20.4%(+11.7)#655 |
| 11. | Shedd | 31.4% | 22.5%(+8.87)#11 | 20.4%(+11.0)#739 |
| 12. | Foots Creek | 31.3% | 22.5%(+8.77)#12 | 20.4%(+10.9)#751 |
| 13. | Mapleton | 31.0% | 22.5%(+8.53)#13 | 20.4%(+10.7)#793 |
| 14. | Grand Ronde | 30.5% | 22.5%(+7.93)#14 | 20.4%(+10.1)#893 |
| 15. | Cave Junction | 30.0% | 22.5%(+7.52)#15 | 20.4%(+9.66)#967 |
| 16. | Shaniko | 29.7% | 22.5%(+7.23)#16 | 20.4%(+9.37)#1,016 |
| 17. | Banks | 29.4% | 22.5%(+6.86)#17 | 20.4%(+9.00)#1,098 |
| 18. | Rogue River | 28.9% | 22.5%(+6.38)#18 | 20.4%(+8.53)#1,209 |
| 19. | Bly | 28.9% | 22.5%(+6.36)#19 | 20.4%(+8.50)#1,213 |
| 20. | Spray | 28.8% | 22.5%(+6.27)#20 | 20.4%(+8.41)#1,238 |
| 21. | Prospect | 28.7% | 22.5%(+6.15)#21 | 20.4%(+8.29)#1,278 |
| 22. | Veneta | 28.5% | 22.5%(+5.98)#22 | 20.4%(+8.12)#1,322 |
| 23. | Sodaville | 28.4% | 22.5%(+5.88)#23 | 20.4%(+8.02)#1,354 |
| 24. | Bandon | 28.4% | 22.5%(+5.87)#24 | 20.4%(+8.01)#1,358 |
| 25. | Rhododendron | 27.9% | 22.5%(+5.41)#25 | 20.4%(+7.55)#1,524 |
| 26. | Talent | 27.9% | 22.5%(+5.39)#26 | 20.4%(+7.53)#1,531 |
| 27. | Estacada | 27.8% | 22.5%(+5.27)#27 | 20.4%(+7.41)#1,591 |
| 28. | La Pine | 27.8% | 22.5%(+5.24)#28 | 20.4%(+7.38)#1,600 |
| 29. | Lookingglass | 27.5% | 22.5%(+5.03)#29 | 20.4%(+7.17)#1,667 |
| 30. | Harrisburg | 27.5% | 22.5%(+5.01)#30 | 20.4%(+7.15)#1,672 |
| 31. | Jennings Lodge | 27.5% | 22.5%(+4.95)#31 | 20.4%(+7.09)#1,701 |
| 32. | Wedderburn | 27.5% | 22.5%(+4.94)#32 | 20.4%(+7.08)#1,703 |
| 33. | Cascade Locks | 27.5% | 22.5%(+4.94)#33 | 20.4%(+7.08)#1,704 |
| 34. | King City | 27.4% | 22.5%(+4.88)#34 | 20.4%(+7.03)#1,719 |
| 35. | Ruch | 27.3% | 22.5%(+4.77)#35 | 20.4%(+6.92)#1,767 |
| 36. | Lebanon | 27.2% | 22.5%(+4.73)#36 | 20.4%(+6.87)#1,789 |
| 37. | Ochoco West | 27.2% | 22.5%(+4.66)#37 | 20.4%(+6.80)#1,813 |
| 38. | South Lebanon | 27.1% | 22.5%(+4.54)#38 | 20.4%(+6.68)#1,867 |
| 39. | Rockaway Beach | 26.8% | 22.5%(+4.25)#39 | 20.4%(+6.39)#2,005 |
| 40. | Toledo | 26.7% | 22.5%(+4.23)#40 | 20.4%(+6.37)#2,017 |
| 41. | Labish Village | 26.7% | 22.5%(+4.19)#41 | 20.4%(+6.33)#2,041 |
| 42. | Stafford | 26.5% | 22.5%(+4.01)#42 | 20.4%(+6.16)#2,129 |
| 43. | Gresham | 26.5% | 22.5%(+3.96)#43 | 20.4%(+6.10)#2,152 |
| 44. | Coquille | 26.4% | 22.5%(+3.88)#44 | 20.4%(+6.02)#2,195 |
| 45. | Phoenix | 26.4% | 22.5%(+3.87)#45 | 20.4%(+6.01)#2,199 |
| 46. | Eugene | 26.4% | 22.5%(+3.87)#46 | 20.4%(+6.01)#2,200 |
| 47. | Grants Pass | 26.3% | 22.5%(+3.78)#47 | 20.4%(+5.92)#2,243 |
| 48. | Seaside | 26.1% | 22.5%(+3.58)#48 | 20.4%(+5.73)#2,335 |
| 49. | Canyonville | 26.0% | 22.5%(+3.52)#49 | 20.4%(+5.66)#2,375 |
| 50. | Pacific City | 25.9% | 22.5%(+3.36)#50 | 20.4%(+5.50)#2,477 |
| 51. | Seventh Mountain | 25.9% | 22.5%(+3.34)#51 | 20.4%(+5.48)#2,492 |
| 52. | Svensen | 25.7% | 22.5%(+3.16)#52 | 20.4%(+5.30)#2,604 |
| 53. | Woodburn | 25.6% | 22.5%(+3.08)#53 | 20.4%(+5.23)#2,663 |
| 54. | Myrtle Point | 25.5% | 22.5%(+3.03)#54 | 20.4%(+5.17)#2,693 |
| 55. | Willamina | 25.5% | 22.5%(+2.98)#55 | 20.4%(+5.12)#2,724 |
| 56. | Corvallis | 25.5% | 22.5%(+2.94)#56 | 20.4%(+5.08)#2,743 |
| 57. | Alsea | 25.4% | 22.5%(+2.93)#57 | 20.4%(+5.07)#2,750 |
| 58. | San Marine | 25.3% | 22.5%(+2.82)#58 | 20.4%(+4.96)#2,812 |
| 59. | Tillamook | 25.3% | 22.5%(+2.80)#59 | 20.4%(+4.94)#2,834 |
| 60. | Garibaldi | 25.3% | 22.5%(+2.77)#60 | 20.4%(+4.92)#2,852 |
| 61. | Wilsonville | 25.2% | 22.5%(+2.66)#61 | 20.4%(+4.80)#2,924 |
| 62. | Dayton | 25.2% | 22.5%(+2.66)#62 | 20.4%(+4.80)#2,925 |
| 63. | Depoe Bay | 25.1% | 22.5%(+2.63)#63 | 20.4%(+4.77)#2,949 |
| 64. | Sportsmans Park | 25.0% | 22.5%(+2.51)#64 | 20.4%(+4.65)#3,032 |
| 65. | Mount Angel | 25.0% | 22.5%(+2.46)#65 | 20.4%(+4.60)#3,072 |
| 66. | Monroe | 24.9% | 22.5%(+2.39)#66 | 20.4%(+4.53)#3,130 |
| 67. | Sheridan | 24.9% | 22.5%(+2.35)#67 | 20.4%(+4.49)#3,169 |
| 68. | Butte Falls | 24.8% | 22.5%(+2.27)#68 | 20.4%(+4.41)#3,218 |
| 69. | Milwaukie | 24.7% | 22.5%(+2.22)#69 | 20.4%(+4.36)#3,254 |
| 70. | Molalla | 24.6% | 22.5%(+2.06)#70 | 20.4%(+4.20)#3,387 |
| 71. | Cottage Grove | 24.5% | 22.5%(+1.97)#71 | 20.4%(+4.12)#3,449 |
| 72. | Klamath Falls | 24.4% | 22.5%(+1.87)#72 | 20.4%(+4.01)#3,532 |
| 73. | Yachats | 24.3% | 22.5%(+1.78)#73 | 20.4%(+3.92)#3,625 |
| 74. | Damascus | 24.3% | 22.5%(+1.78)#74 | 20.4%(+3.92)#3,629 |
| 75. | Independence | 24.2% | 22.5%(+1.72)#75 | 20.4%(+3.87)#3,671 |
| 76. | Sisters | 24.2% | 22.5%(+1.67)#76 | 20.4%(+3.81)#3,716 |
| 77. | Bend | 24.2% | 22.5%(+1.64)#77 | 20.4%(+3.78)#3,755 |
| 78. | New Hope | 24.1% | 22.5%(+1.61)#78 | 20.4%(+3.75)#3,775 |
| 79. | Newberg | 24.1% | 22.5%(+1.60)#79 | 20.4%(+3.74)#3,783 |
| 80. | Port Orford | 24.1% | 22.5%(+1.56)#80 | 20.4%(+3.71)#3,805 |
| 81. | Gold Beach | 24.0% | 22.5%(+1.45)#81 | 20.4%(+3.59)#3,891 |
| 82. | Salem | 23.9% | 22.5%(+1.41)#82 | 20.4%(+3.56)#3,918 |
| 83. | Waldport | 23.9% | 22.5%(+1.41)#83 | 20.4%(+3.55)#3,932 |
| 84. | Drain | 23.9% | 22.5%(+1.39)#84 | 20.4%(+3.54)#3,945 |
| 85. | Medford | 23.9% | 22.5%(+1.39)#85 | 20.4%(+3.53)#3,947 |
| 86. | Oak Grove | 23.9% | 22.5%(+1.39)#86 | 20.4%(+3.53)#3,952 |
| 87. | Ashland | 23.9% | 22.5%(+1.38)#87 | 20.4%(+3.53)#3,955 |
| 88. | Oregon City | 23.9% | 22.5%(+1.38)#88 | 20.4%(+3.52)#3,957 |
| 89. | Monmouth | 23.9% | 22.5%(+1.37)#89 | 20.4%(+3.51)#3,969 |
| 90. | Lincoln City | 23.9% | 22.5%(+1.34)#90 | 20.4%(+3.49)#3,991 |
| 91. | Johnson City | 23.8% | 22.5%(+1.32)#91 | 20.4%(+3.47)#4,017 |
| 92. | Portland | 23.8% | 22.5%(+1.28)#92 | 20.4%(+3.42)#4,058 |
| 93. | Marlene | 23.8% | 22.5%(+1.25)#93 | 20.4%(+3.39)#4,080 |
| 94. | Vernonia | 23.8% | 22.5%(+1.23)#94 | 20.4%(+3.37)#4,101 |
| 95. | Brownsville | 23.7% | 22.5%(+1.19)#95 | 20.4%(+3.33)#4,144 |
| 96. | Aloha | 23.7% | 22.5%(+1.18)#96 | 20.4%(+3.32)#4,155 |
| 97. | Mcminnville | 23.6% | 22.5%(+1.09)#97 | 20.4%(+3.23)#4,260 |
| 98. | Winston | 23.5% | 22.5%(+0.975)#98 | 20.4%(+3.12)#4,379 |
| 99. | Sutherlin | 23.5% | 22.5%(+0.959)#99 | 20.4%(+3.10)#4,399 |
| 100. | Newport | 23.5% | 22.5%(+0.956)#100 | 20.4%(+3.10)#4,404 |
Common Questions
What are the Top 10 Cities with the Highest Costs of Housing as Percentage of Income in Oregon?
Top 10 Cities with the Highest Costs of Housing as Percentage of Income in Oregon are:
#1
41.2%
#2
38.1%
#3
37.8%
#4
36.6%
#5
34.0%
#6
33.4%
#7
32.9%
#8
32.2%
#9
32.1%
#10
31.4%
What city has the Highest Costs of Housing as Percentage of Income in Oregon?
Wimer has the Highest Costs of Housing as Percentage of Income in Oregon with 41.2%.
What is the Average Housing Costs as Percentage of Income in the State of Oregon?
Average Housing Costs as Percentage of Income in Oregon is 22.5%.
What is the Average Housing Costs as Percentage of Income in the United States?
Average Housing Costs as Percentage of Income in the United States is 20.4%.