Cities with the Highest Costs of Housing as Percentage of Income in Arizona
RELATED REPORTS & OPTIONS
Highest Housing Costs / Income
Arizona
Compare Cities
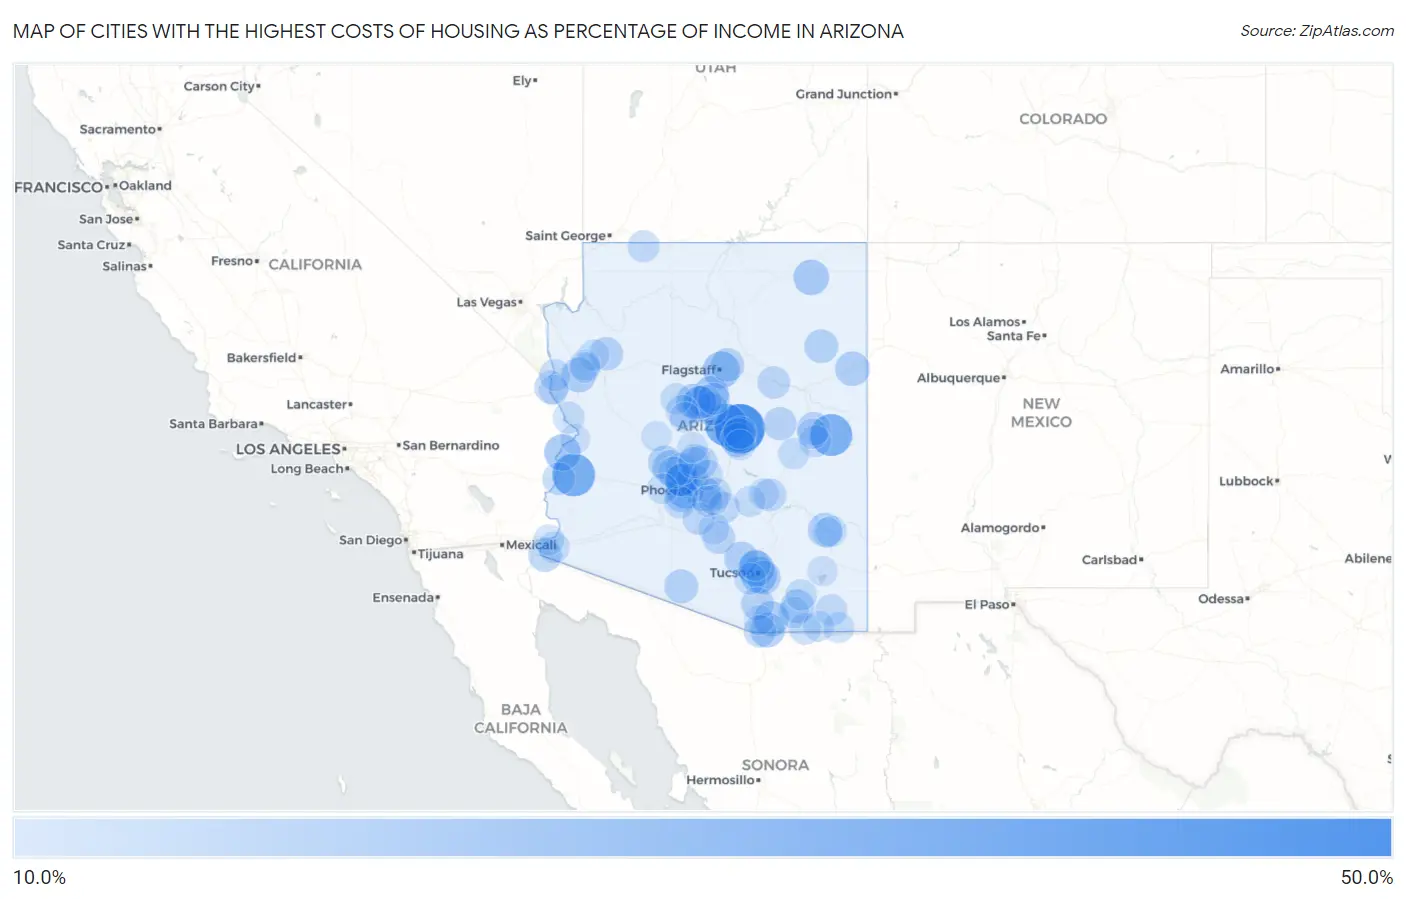
Map of Cities with the Highest Costs of Housing as Percentage of Income in Arizona
0.0%
50.0%
Cities with the Highest Costs of Housing as Percentage of Income in Arizona
| City | Housing Costs / Income | vs State | vs National | |
| 1. | Beaver Valley | 43.7% | 20.7%(+23.1)#1 | 20.4%(+23.4)#131 |
| 2. | Quartzsite | 34.7% | 20.7%(+14.0)#2 | 20.4%(+14.3)#425 |
| 3. | Strawberry | 34.1% | 20.7%(+13.5)#3 | 20.4%(+13.8)#461 |
| 4. | Vernon | 33.8% | 20.7%(+13.1)#4 | 20.4%(+13.4)#493 |
| 5. | Mountain View Ranches | 30.7% | 20.7%(+10.0)#5 | 20.4%(+10.3)#837 |
| 6. | Flagstaff | 27.3% | 20.7%(+6.59)#6 | 20.4%(+6.90)#1,783 |
| 7. | Oak Creek Canyon | 27.1% | 20.7%(+6.43)#7 | 20.4%(+6.73)#1,839 |
| 8. | Tolleson | 26.7% | 20.7%(+6.06)#8 | 20.4%(+6.37)#2,023 |
| 9. | Poston | 26.6% | 20.7%(+5.97)#9 | 20.4%(+6.27)#2,066 |
| 10. | South Tucson | 26.5% | 20.7%(+5.78)#10 | 20.4%(+6.08)#2,158 |
| 11. | Flowing Wells | 26.1% | 20.7%(+5.46)#11 | 20.4%(+5.76)#2,313 |
| 12. | Cottonwood | 25.7% | 20.7%(+5.05)#12 | 20.4%(+5.36)#2,564 |
| 13. | Chilchinbito | 25.5% | 20.7%(+4.82)#13 | 20.4%(+5.12)#2,720 |
| 14. | Sedona | 25.5% | 20.7%(+4.79)#14 | 20.4%(+5.09)#2,738 |
| 15. | Patagonia | 25.1% | 20.7%(+4.42)#15 | 20.4%(+4.73)#2,978 |
| 16. | Jerome | 24.7% | 20.7%(+4.03)#16 | 20.4%(+4.33)#3,281 |
| 17. | Walnut Creek | 24.6% | 20.7%(+3.91)#17 | 20.4%(+4.21)#3,378 |
| 18. | Kino Springs | 24.5% | 20.7%(+3.81)#18 | 20.4%(+4.12)#3,445 |
| 19. | Sanders | 24.4% | 20.7%(+3.73)#19 | 20.4%(+4.04)#3,511 |
| 20. | Wittmann | 24.2% | 20.7%(+3.53)#20 | 20.4%(+3.83)#3,690 |
| 21. | Tempe | 24.1% | 20.7%(+3.38)#21 | 20.4%(+3.68)#3,822 |
| 22. | Youngtown | 24.0% | 20.7%(+3.36)#22 | 20.4%(+3.67)#3,840 |
| 23. | Central | 23.9% | 20.7%(+3.20)#23 | 20.4%(+3.50)#3,977 |
| 24. | Oxbow Estates | 23.9% | 20.7%(+3.18)#24 | 20.4%(+3.48)#3,994 |
| 25. | Nelson | 23.7% | 20.7%(+3.02)#25 | 20.4%(+3.33)#4,154 |
| 26. | Morristown | 23.6% | 20.7%(+2.91)#26 | 20.4%(+3.22)#4,273 |
| 27. | Pisinemo | 23.5% | 20.7%(+2.78)#27 | 20.4%(+3.08)#4,418 |
| 28. | Avondale | 23.4% | 20.7%(+2.75)#28 | 20.4%(+3.06)#4,435 |
| 29. | Payson | 23.3% | 20.7%(+2.66)#29 | 20.4%(+2.97)#4,524 |
| 30. | Tucson | 23.3% | 20.7%(+2.65)#30 | 20.4%(+2.96)#4,543 |
| 31. | Whetstone | 23.3% | 20.7%(+2.63)#31 | 20.4%(+2.93)#4,560 |
| 32. | Greasewood | 23.3% | 20.7%(+2.57)#32 | 20.4%(+2.88)#4,611 |
| 33. | Doney Park | 23.1% | 20.7%(+2.43)#33 | 20.4%(+2.74)#4,764 |
| 34. | Crozier | 23.0% | 20.7%(+2.30)#34 | 20.4%(+2.60)#4,919 |
| 35. | Glendale | 23.0% | 20.7%(+2.28)#35 | 20.4%(+2.58)#4,948 |
| 36. | San Luis | 22.9% | 20.7%(+2.27)#36 | 20.4%(+2.57)#4,964 |
| 37. | White Mountain Lake | 22.9% | 20.7%(+2.26)#37 | 20.4%(+2.57)#4,978 |
| 38. | Lake Montezuma | 22.8% | 20.7%(+2.08)#38 | 20.4%(+2.38)#5,204 |
| 39. | Heber Overgaard | 22.7% | 20.7%(+2.06)#39 | 20.4%(+2.37)#5,216 |
| 40. | Willow Valley | 22.7% | 20.7%(+2.06)#40 | 20.4%(+2.36)#5,218 |
| 41. | Elephant Head | 22.5% | 20.7%(+1.83)#41 | 20.4%(+2.13)#5,508 |
| 42. | Bellemont | 22.4% | 20.7%(+1.70)#42 | 20.4%(+2.01)#5,662 |
| 43. | Cornville | 22.3% | 20.7%(+1.58)#43 | 20.4%(+1.89)#5,814 |
| 44. | Phoenix | 22.2% | 20.7%(+1.49)#44 | 20.4%(+1.80)#5,960 |
| 45. | Arizona City | 22.1% | 20.7%(+1.42)#45 | 20.4%(+1.73)#6,055 |
| 46. | Cave Creek | 22.1% | 20.7%(+1.41)#46 | 20.4%(+1.72)#6,074 |
| 47. | Verde Village | 22.1% | 20.7%(+1.37)#47 | 20.4%(+1.68)#6,142 |
| 48. | Mesa Del Caballo | 22.0% | 20.7%(+1.27)#48 | 20.4%(+1.58)#6,272 |
| 49. | Pinal | 21.9% | 20.7%(+1.23)#49 | 20.4%(+1.54)#6,335 |
| 50. | Winslow | 21.8% | 20.7%(+1.12)#50 | 20.4%(+1.43)#6,492 |
| 51. | Nogales | 21.7% | 20.7%(+1.01)#51 | 20.4%(+1.31)#6,637 |
| 52. | El Mirage | 21.7% | 20.7%(+0.977)#52 | 20.4%(+1.28)#6,682 |
| 53. | Prescott Valley | 21.7% | 20.7%(+0.969)#53 | 20.4%(+1.28)#6,695 |
| 54. | Ehrenberg | 21.6% | 20.7%(+0.941)#54 | 20.4%(+1.25)#6,744 |
| 55. | Mesa | 21.4% | 20.7%(+0.758)#55 | 20.4%(+1.07)#7,015 |
| 56. | Maricopa | 21.2% | 20.7%(+0.561)#56 | 20.4%(+0.869)#7,320 |
| 57. | Village Of Oak Creek Big Park | 21.2% | 20.7%(+0.484)#57 | 20.4%(+0.792)#7,449 |
| 58. | Peoria | 21.1% | 20.7%(+0.410)#58 | 20.4%(+0.717)#7,563 |
| 59. | Goodyear | 21.1% | 20.7%(+0.380)#59 | 20.4%(+0.688)#7,628 |
| 60. | Centennial Park | 21.0% | 20.7%(+0.292)#60 | 20.4%(+0.599)#7,772 |
| 61. | San Tan Valley | 20.9% | 20.7%(+0.247)#61 | 20.4%(+0.555)#7,865 |
| 62. | Bullhead City | 20.9% | 20.7%(+0.247)#62 | 20.4%(+0.554)#7,866 |
| 63. | Pinetop Lakeside | 20.9% | 20.7%(+0.239)#63 | 20.4%(+0.547)#7,876 |
| 64. | Miracle Valley | 20.9% | 20.7%(+0.231)#64 | 20.4%(+0.539)#7,894 |
| 65. | Elfrida | 20.9% | 20.7%(+0.208)#65 | 20.4%(+0.516)#7,928 |
| 66. | New River | 20.9% | 20.7%(+0.208)#66 | 20.4%(+0.515)#7,931 |
| 67. | Lake Havasu City | 20.7% | 20.7%(-0.011)#67 | 20.4%(+0.297)#8,277 |
| 68. | Surprise | 20.7% | 20.7%(-0.021)#68 | 20.4%(+0.286)#8,294 |
| 69. | Valencia West | 20.6% | 20.7%(-0.044)#69 | 20.4%(+0.263)#8,341 |
| 70. | Casas Adobes | 20.6% | 20.7%(-0.045)#70 | 20.4%(+0.262)#8,344 |
| 71. | Chino Valley | 20.3% | 20.7%(-0.339)#71 | 20.4%(-0.031)#8,873 |
| 72. | Huachuca City | 20.3% | 20.7%(-0.367)#72 | 20.4%(-0.060)#8,920 |
| 73. | Yuma | 20.3% | 20.7%(-0.370)#73 | 20.4%(-0.063)#8,924 |
| 74. | St David | 20.3% | 20.7%(-0.376)#74 | 20.4%(-0.068)#8,932 |
| 75. | Safford | 20.2% | 20.7%(-0.461)#75 | 20.4%(-0.154)#9,109 |
| 76. | Anthem | 20.2% | 20.7%(-0.463)#76 | 20.4%(-0.156)#9,113 |
| 77. | Casa Grande | 20.2% | 20.7%(-0.471)#77 | 20.4%(-0.163)#9,125 |
| 78. | Valle Vista | 20.2% | 20.7%(-0.491)#78 | 20.4%(-0.184)#9,167 |
| 79. | Carrizo | 20.0% | 20.7%(-0.671)#79 | 20.4%(-0.363)#9,495 |
| 80. | Superior | 20.0% | 20.7%(-0.713)#80 | 20.4%(-0.406)#9,568 |
| 81. | Avenue B And C | 20.0% | 20.7%(-0.729)#81 | 20.4%(-0.422)#9,601 |
| 82. | Douglas | 19.9% | 20.7%(-0.748)#82 | 20.4%(-0.440)#9,631 |
| 83. | Scottsdale | 19.9% | 20.7%(-0.771)#83 | 20.4%(-0.463)#9,669 |
| 84. | Bisbee | 19.9% | 20.7%(-0.771)#84 | 20.4%(-0.464)#9,672 |
| 85. | Dewey Humboldt | 19.9% | 20.7%(-0.819)#85 | 20.4%(-0.511)#9,757 |
| 86. | New Kingman Butler | 19.9% | 20.7%(-0.825)#86 | 20.4%(-0.517)#9,767 |
| 87. | Miami | 19.8% | 20.7%(-0.839)#87 | 20.4%(-0.531)#9,794 |
| 88. | Chandler | 19.8% | 20.7%(-0.879)#88 | 20.4%(-0.572)#9,888 |
| 89. | Gisela | 19.7% | 20.7%(-0.973)#89 | 20.4%(-0.666)#10,064 |
| 90. | Buckeye | 19.6% | 20.7%(-1.08)#90 | 20.4%(-0.768)#10,262 |
| 91. | Kingman | 19.5% | 20.7%(-1.16)#91 | 20.4%(-0.851)#10,469 |
| 92. | Black Canyon City | 19.5% | 20.7%(-1.17)#92 | 20.4%(-0.866)#10,498 |
| 93. | Show Low | 19.4% | 20.7%(-1.24)#93 | 20.4%(-0.935)#10,636 |
| 94. | Yarnell | 19.1% | 20.7%(-1.62)#94 | 20.4%(-1.31)#11,479 |
| 95. | Willcox | 19.0% | 20.7%(-1.63)#95 | 20.4%(-1.33)#11,508 |
| 96. | Thatcher | 18.9% | 20.7%(-1.78)#96 | 20.4%(-1.47)#11,782 |
| 97. | Rio Rico | 18.9% | 20.7%(-1.78)#97 | 20.4%(-1.47)#11,799 |
| 98. | Gilbert | 18.9% | 20.7%(-1.78)#98 | 20.4%(-1.48)#11,805 |
| 99. | Mohave Valley | 18.9% | 20.7%(-1.83)#99 | 20.4%(-1.52)#11,886 |
| 100. | Cienega Springs | 18.8% | 20.7%(-1.84)#100 | 20.4%(-1.53)#11,905 |
Common Questions
What are the Top 10 Cities with the Highest Costs of Housing as Percentage of Income in Arizona?
Top 10 Cities with the Highest Costs of Housing as Percentage of Income in Arizona are:
#1
43.7%
#2
34.7%
#3
34.1%
#4
33.8%
#5
27.3%
#6
26.7%
#7
26.6%
#8
26.5%
#9
26.1%
#10
25.7%
What city has the Highest Costs of Housing as Percentage of Income in Arizona?
Beaver Valley has the Highest Costs of Housing as Percentage of Income in Arizona with 43.7%.
What is the Average Housing Costs as Percentage of Income in the State of Arizona?
Average Housing Costs as Percentage of Income in Arizona is 20.7%.
What is the Average Housing Costs as Percentage of Income in the United States?
Average Housing Costs as Percentage of Income in the United States is 20.4%.