Cities with the Highest Costs of Housing as Percentage of Income in South Dakota
RELATED REPORTS & OPTIONS
Highest Housing Costs / Income
South Dakota
Compare Cities
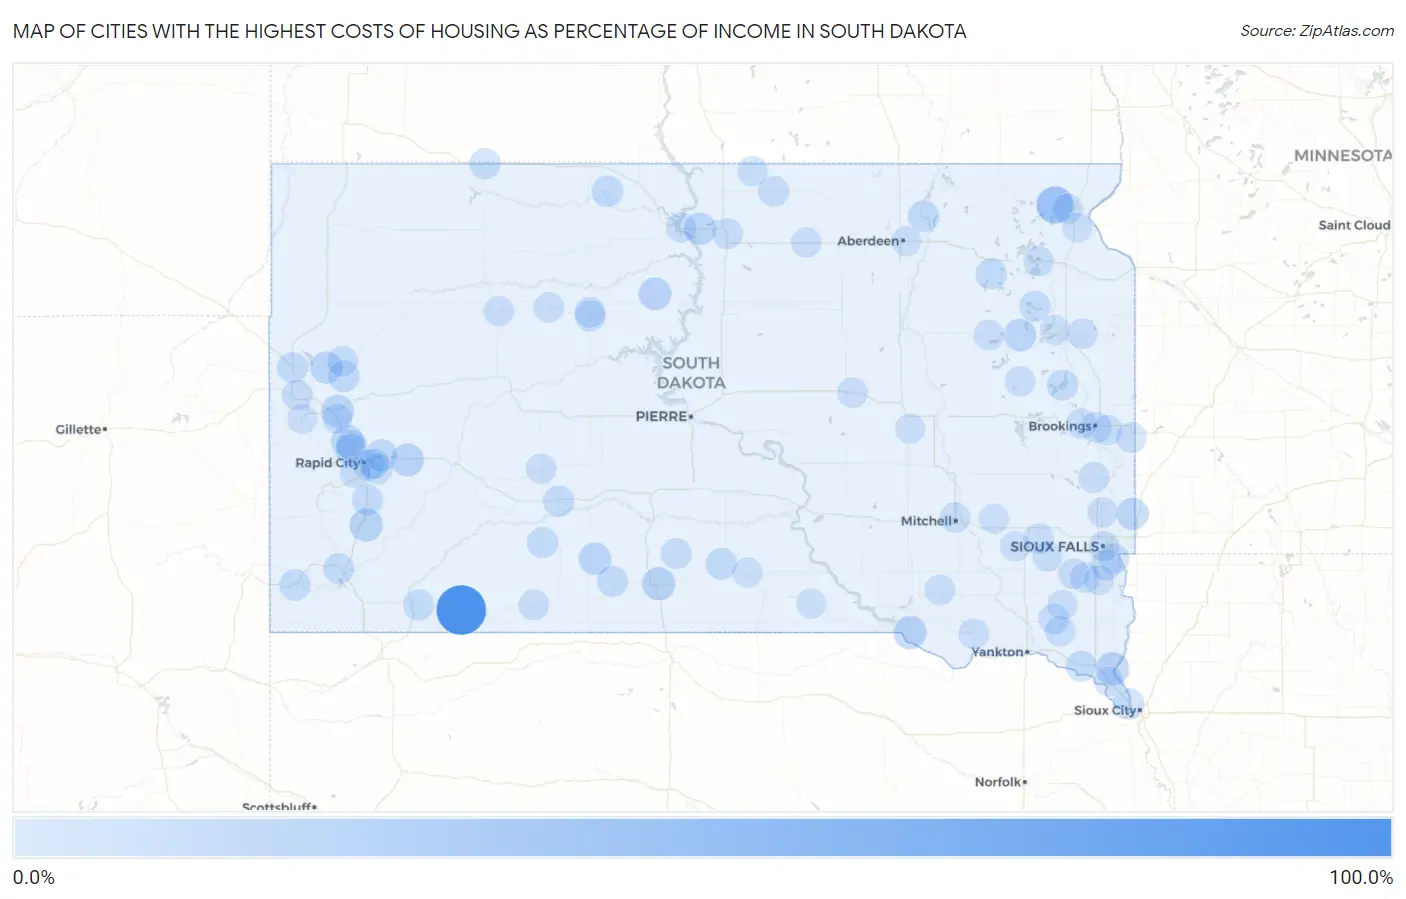
Map of Cities with the Highest Costs of Housing as Percentage of Income in South Dakota
0.0%
100.0%
Cities with the Highest Costs of Housing as Percentage of Income in South Dakota
| City | Housing Costs / Income | vs State | vs National | |
| 1. | Wounded Knee | 100.0% | 16.4%(+83.6)#1 | 20.4%(+79.6)#12 |
| 2. | Swift Bird | 72.1% | 16.4%(+55.7)#2 | 20.4%(+51.7)#29 |
| 3. | Long Hollow | 45.5% | 16.4%(+29.1)#3 | 20.4%(+25.2)#107 |
| 4. | Bridger | 39.7% | 16.4%(+23.3)#4 | 20.4%(+19.4)#201 |
| 5. | Richland | 29.1% | 16.4%(+12.7)#5 | 20.4%(+8.76)#1,156 |
| 6. | Antelope | 29.0% | 16.4%(+12.6)#6 | 20.4%(+8.63)#1,182 |
| 7. | Marty | 29.0% | 16.4%(+12.5)#7 | 20.4%(+8.58)#1,197 |
| 8. | Fairburn | 28.6% | 16.4%(+12.2)#8 | 20.4%(+8.23)#1,292 |
| 9. | Cherry Creek | 27.6% | 16.4%(+11.2)#9 | 20.4%(+7.26)#1,637 |
| 10. | New Underwood | 27.6% | 16.4%(+11.2)#10 | 20.4%(+7.24)#1,642 |
| 11. | La Plant | 27.2% | 16.4%(+10.8)#11 | 20.4%(+6.85)#1,796 |
| 12. | Sturgis | 27.0% | 16.4%(+10.6)#12 | 20.4%(+6.67)#1,876 |
| 13. | Norris | 26.7% | 16.4%(+10.2)#13 | 20.4%(+6.31)#2,051 |
| 14. | Piedmont | 26.6% | 16.4%(+10.1)#14 | 20.4%(+6.19)#2,110 |
| 15. | Henry | 26.0% | 16.4%(+9.58)#15 | 20.4%(+5.66)#2,377 |
| 16. | Wakpala | 26.0% | 16.4%(+9.58)#16 | 20.4%(+5.65)#2,384 |
| 17. | Enemy Swim | 25.8% | 16.4%(+9.38)#17 | 20.4%(+5.45)#2,511 |
| 18. | Prairiewood | 25.6% | 16.4%(+9.17)#18 | 20.4%(+5.24)#2,643 |
| 19. | Nisland | 25.2% | 16.4%(+8.74)#19 | 20.4%(+4.82)#2,917 |
| 20. | Glenham | 24.8% | 16.4%(+8.35)#20 | 20.4%(+4.42)#3,212 |
| 21. | Sherman | 24.7% | 16.4%(+8.22)#21 | 20.4%(+4.30)#3,312 |
| 22. | Blackhawk | 24.4% | 16.4%(+7.91)#22 | 20.4%(+3.98)#3,572 |
| 23. | Box Elder | 23.5% | 16.4%(+7.02)#23 | 20.4%(+3.09)#4,411 |
| 24. | Vale | 22.7% | 16.4%(+6.25)#24 | 20.4%(+2.33)#5,272 |
| 25. | New Witten | 22.3% | 16.4%(+5.89)#25 | 20.4%(+1.96)#5,726 |
| 26. | Bullhead | 22.2% | 16.4%(+5.77)#26 | 20.4%(+1.84)#5,902 |
| 27. | Columbia | 22.2% | 16.4%(+5.76)#27 | 20.4%(+1.83)#5,918 |
| 28. | Edgemont | 21.4% | 16.4%(+4.95)#28 | 20.4%(+1.02)#7,073 |
| 29. | North Sioux City | 21.2% | 16.4%(+4.76)#29 | 20.4%(+0.837)#7,377 |
| 30. | Hermosa | 21.0% | 16.4%(+4.54)#30 | 20.4%(+0.616)#7,745 |
| 31. | Vermillion | 20.9% | 16.4%(+4.46)#31 | 20.4%(+0.531)#7,903 |
| 32. | Florence | 20.7% | 16.4%(+4.26)#32 | 20.4%(+0.332)#8,209 |
| 33. | Lemmon | 20.6% | 16.4%(+4.11)#33 | 20.4%(+0.178)#8,498 |
| 34. | Hot Springs | 20.5% | 16.4%(+4.09)#34 | 20.4%(+0.158)#8,534 |
| 35. | Butler | 20.5% | 16.4%(+4.06)#35 | 20.4%(+0.132)#8,591 |
| 36. | Belle Fourche | 20.5% | 16.4%(+4.05)#36 | 20.4%(+0.119)#8,609 |
| 37. | Parmelee | 20.3% | 16.4%(+3.90)#37 | 20.4%(-0.033)#8,877 |
| 38. | Wanblee | 20.3% | 16.4%(+3.86)#38 | 20.4%(-0.067)#8,929 |
| 39. | Lake Poinsett | 20.3% | 16.4%(+3.84)#39 | 20.4%(-0.086)#8,967 |
| 40. | Rapid City | 20.3% | 16.4%(+3.83)#40 | 20.4%(-0.096)#8,993 |
| 41. | Oglala | 20.2% | 16.4%(+3.77)#41 | 20.4%(-0.158)#9,118 |
| 42. | Kadoka | 20.2% | 16.4%(+3.77)#42 | 20.4%(-0.163)#9,124 |
| 43. | Harrisburg | 20.1% | 16.4%(+3.65)#43 | 20.4%(-0.275)#9,329 |
| 44. | Colman | 20.1% | 16.4%(+3.65)#44 | 20.4%(-0.277)#9,333 |
| 45. | Brookings | 20.1% | 16.4%(+3.62)#45 | 20.4%(-0.308)#9,392 |
| 46. | Eagle Butte | 19.8% | 16.4%(+3.35)#46 | 20.4%(-0.581)#9,904 |
| 47. | Eureka | 19.8% | 16.4%(+3.31)#47 | 20.4%(-0.616)#9,972 |
| 48. | Colonial Pine Hills | 19.7% | 16.4%(+3.29)#48 | 20.4%(-0.637)#10,016 |
| 49. | Irene | 19.5% | 16.4%(+3.06)#49 | 20.4%(-0.867)#10,504 |
| 50. | Selby | 19.5% | 16.4%(+3.03)#50 | 20.4%(-0.893)#10,554 |
| 51. | Chancellor | 19.5% | 16.4%(+3.01)#51 | 20.4%(-0.918)#10,606 |
| 52. | Newell | 19.4% | 16.4%(+2.97)#52 | 20.4%(-0.956)#10,677 |
| 53. | Wood | 19.3% | 16.4%(+2.87)#53 | 20.4%(-1.05)#10,870 |
| 54. | Green Valley | 19.3% | 16.4%(+2.84)#54 | 20.4%(-1.08)#10,931 |
| 55. | North Eagle Butte | 19.2% | 16.4%(+2.80)#55 | 20.4%(-1.13)#11,031 |
| 56. | Elkton | 19.1% | 16.4%(+2.61)#56 | 20.4%(-1.32)#11,492 |
| 57. | Shindler | 19.0% | 16.4%(+2.55)#57 | 20.4%(-1.38)#11,593 |
| 58. | Spearfish | 18.9% | 16.4%(+2.43)#58 | 20.4%(-1.50)#11,850 |
| 59. | Martin | 18.9% | 16.4%(+2.42)#59 | 20.4%(-1.50)#11,862 |
| 60. | Canistota | 18.8% | 16.4%(+2.32)#60 | 20.4%(-1.61)#12,076 |
| 61. | Peever Flats | 18.7% | 16.4%(+2.29)#61 | 20.4%(-1.64)#12,123 |
| 62. | Volga | 18.7% | 16.4%(+2.29)#62 | 20.4%(-1.64)#12,128 |
| 63. | Sisseton | 18.7% | 16.4%(+2.29)#63 | 20.4%(-1.64)#12,138 |
| 64. | Mitchell | 18.7% | 16.4%(+2.28)#64 | 20.4%(-1.64)#12,141 |
| 65. | Delmont | 18.7% | 16.4%(+2.28)#65 | 20.4%(-1.65)#12,153 |
| 66. | St Lawrence | 18.5% | 16.4%(+2.04)#66 | 20.4%(-1.89)#12,692 |
| 67. | West Brule | 18.4% | 16.4%(+1.98)#67 | 20.4%(-1.95)#12,849 |
| 68. | Baltic | 18.4% | 16.4%(+1.95)#68 | 20.4%(-1.97)#12,911 |
| 69. | Tyndall | 18.3% | 16.4%(+1.89)#69 | 20.4%(-2.04)#13,052 |
| 70. | Sioux Falls | 18.3% | 16.4%(+1.86)#70 | 20.4%(-2.07)#13,129 |
| 71. | Rapid Valley | 18.2% | 16.4%(+1.72)#71 | 20.4%(-2.21)#13,449 |
| 72. | Kranzburg | 18.2% | 16.4%(+1.71)#72 | 20.4%(-2.22)#13,472 |
| 73. | Dupree | 18.1% | 16.4%(+1.61)#73 | 20.4%(-2.31)#13,665 |
| 74. | Clark | 18.0% | 16.4%(+1.56)#74 | 20.4%(-2.36)#13,779 |
| 75. | Philip | 18.0% | 16.4%(+1.52)#75 | 20.4%(-2.40)#13,878 |
| 76. | Lennox | 17.9% | 16.4%(+1.50)#76 | 20.4%(-2.43)#13,946 |
| 77. | Mobridge | 17.9% | 16.4%(+1.49)#77 | 20.4%(-2.44)#13,975 |
| 78. | Faith | 17.8% | 16.4%(+1.40)#78 | 20.4%(-2.53)#14,159 |
| 79. | Waubay | 17.8% | 16.4%(+1.34)#79 | 20.4%(-2.59)#14,290 |
| 80. | Oahe Acres | 17.8% | 16.4%(+1.32)#80 | 20.4%(-2.60)#14,319 |
| 81. | Monroe | 17.7% | 16.4%(+1.28)#81 | 20.4%(-2.65)#14,424 |
| 82. | Bryant | 17.7% | 16.4%(+1.24)#82 | 20.4%(-2.69)#14,520 |
| 83. | Artas | 17.7% | 16.4%(+1.22)#83 | 20.4%(-2.71)#14,559 |
| 84. | Wakonda | 17.6% | 16.4%(+1.19)#84 | 20.4%(-2.74)#14,605 |
| 85. | Summerset | 17.6% | 16.4%(+1.16)#85 | 20.4%(-2.77)#14,679 |
| 86. | Aurora | 17.5% | 16.4%(+1.04)#86 | 20.4%(-2.89)#14,937 |
| 87. | Roscoe | 17.4% | 16.4%(+0.987)#87 | 20.4%(-2.94)#15,070 |
| 88. | Blucksberg Mountain | 17.4% | 16.4%(+0.965)#88 | 20.4%(-2.96)#15,118 |
| 89. | Watertown | 17.3% | 16.4%(+0.891)#89 | 20.4%(-3.04)#15,281 |
| 90. | Viborg | 17.2% | 16.4%(+0.730)#90 | 20.4%(-3.20)#15,642 |
| 91. | Farmer | 17.1% | 16.4%(+0.641)#91 | 20.4%(-3.29)#15,825 |
| 92. | Winner | 17.1% | 16.4%(+0.627)#92 | 20.4%(-3.30)#15,853 |
| 93. | Worthing | 17.0% | 16.4%(+0.555)#93 | 20.4%(-3.37)#16,021 |
| 94. | Virgil | 17.0% | 16.4%(+0.541)#94 | 20.4%(-3.39)#16,048 |
| 95. | Bridgewater | 16.9% | 16.4%(+0.439)#95 | 20.4%(-3.49)#16,297 |
| 96. | Peever | 16.9% | 16.4%(+0.403)#96 | 20.4%(-3.52)#16,364 |
| 97. | Aberdeen | 16.8% | 16.4%(+0.361)#97 | 20.4%(-3.57)#16,464 |
| 98. | Burke | 16.8% | 16.4%(+0.337)#98 | 20.4%(-3.59)#16,504 |
| 99. | Elk Point | 16.7% | 16.4%(+0.278)#99 | 20.4%(-3.65)#16,624 |
| 100. | Lead | 16.7% | 16.4%(+0.247)#100 | 20.4%(-3.68)#16,686 |
Common Questions
What are the Top 10 Cities with the Highest Costs of Housing as Percentage of Income in South Dakota?
Top 10 Cities with the Highest Costs of Housing as Percentage of Income in South Dakota are:
#1
100.0%
#2
45.5%
#3
29.1%
#4
29.0%
#5
29.0%
#6
28.6%
#7
27.6%
#8
27.2%
#9
27.0%
#10
26.7%
What city has the Highest Costs of Housing as Percentage of Income in South Dakota?
Wounded Knee has the Highest Costs of Housing as Percentage of Income in South Dakota with 100.0%.
What is the Average Housing Costs as Percentage of Income in the State of South Dakota?
Average Housing Costs as Percentage of Income in South Dakota is 16.4%.
What is the Average Housing Costs as Percentage of Income in the United States?
Average Housing Costs as Percentage of Income in the United States is 20.4%.