Cities with the Highest Costs of Housing as Percentage of Income in Virginia
RELATED REPORTS & OPTIONS
Highest Housing Costs / Income
Virginia
Compare Cities
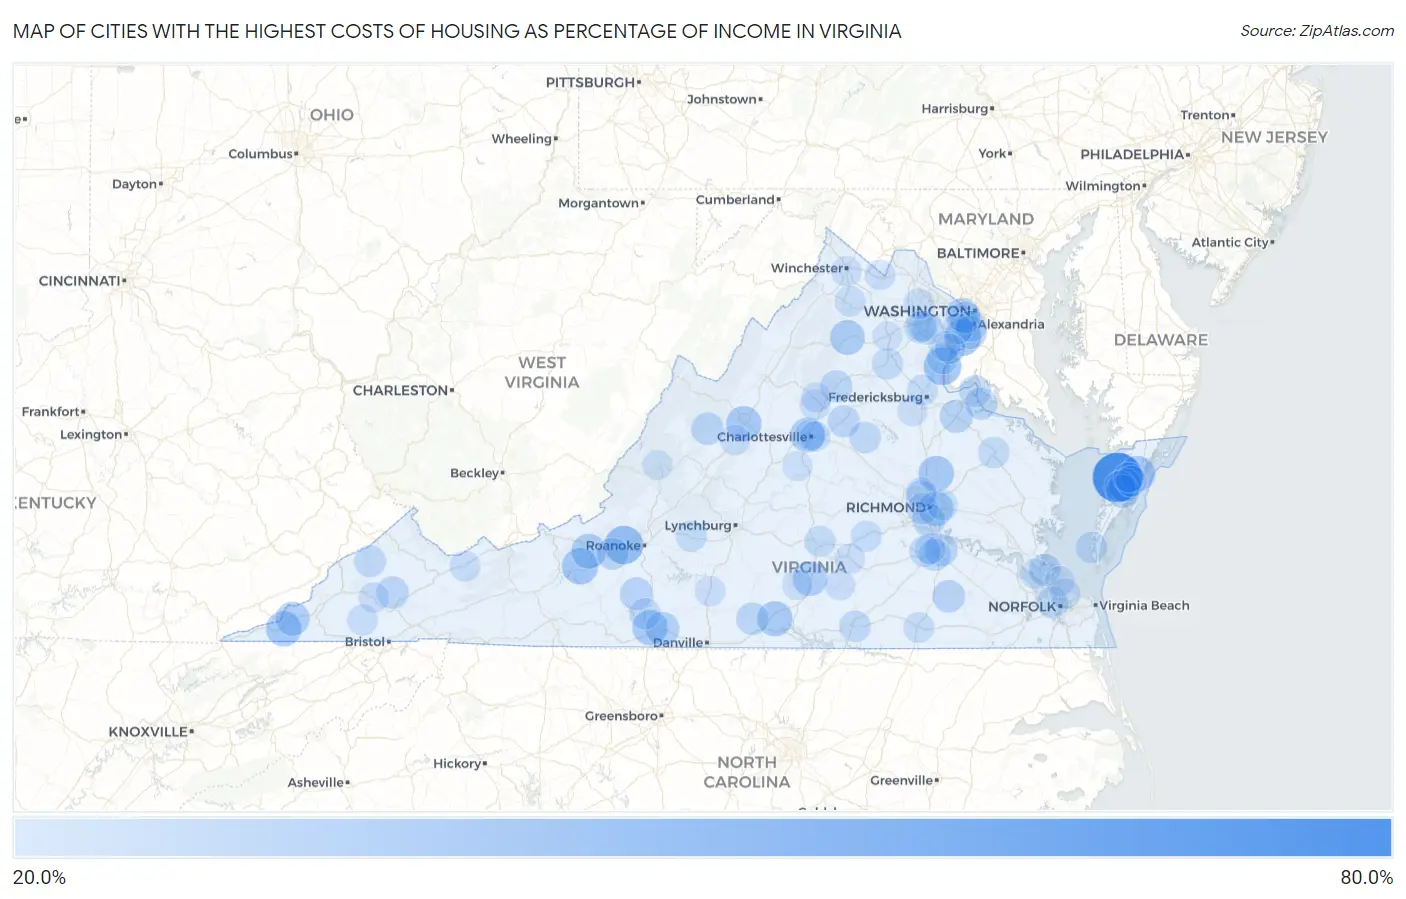
Map of Cities with the Highest Costs of Housing as Percentage of Income in Virginia
0.0%
80.0%
Cities with the Highest Costs of Housing as Percentage of Income in Virginia
| City | Housing Costs / Income | vs State | vs National | |
| 1. | Southside Chesconessex | 70.1% | 20.2%(+50.0)#1 | 20.4%(+49.8)#31 |
| 2. | Innovation | 54.3% | 20.2%(+34.1)#2 | 20.4%(+33.9)#64 |
| 3. | Moneta | 48.0% | 20.2%(+27.8)#3 | 20.4%(+27.6)#88 |
| 4. | Glenvar | 43.3% | 20.2%(+23.2)#4 | 20.4%(+23.0)#137 |
| 5. | Quantico Base | 40.9% | 20.2%(+20.7)#5 | 20.4%(+20.5)#172 |
| 6. | Fort Belvoir | 38.7% | 20.2%(+18.5)#6 | 20.4%(+18.3)#228 |
| 7. | Plum Creek | 37.5% | 20.2%(+17.3)#7 | 20.4%(+17.1)#271 |
| 8. | Hanover | 36.4% | 20.2%(+16.2)#8 | 20.4%(+16.0)#329 |
| 9. | Metompkin | 36.3% | 20.2%(+16.1)#9 | 20.4%(+15.9)#337 |
| 10. | Jonesville | 35.9% | 20.2%(+15.8)#10 | 20.4%(+15.6)#352 |
| 11. | Jolivue | 35.9% | 20.2%(+15.7)#11 | 20.4%(+15.5)#358 |
| 12. | Villa Heights | 35.8% | 20.2%(+15.6)#12 | 20.4%(+15.4)#360 |
| 13. | Scottsburg | 35.1% | 20.2%(+15.0)#13 | 20.4%(+14.8)#396 |
| 14. | Blacksburg | 34.8% | 20.2%(+14.6)#14 | 20.4%(+14.4)#417 |
| 15. | Washington | 34.4% | 20.2%(+14.2)#15 | 20.4%(+14.0)#445 |
| 16. | University Of Virginia | 34.4% | 20.2%(+14.2)#16 | 20.4%(+14.0)#446 |
| 17. | Montrose | 34.0% | 20.2%(+13.8)#17 | 20.4%(+13.6)#473 |
| 18. | Keysville | 33.8% | 20.2%(+13.6)#18 | 20.4%(+13.4)#490 |
| 19. | Pennington Gap | 32.7% | 20.2%(+12.5)#19 | 20.4%(+12.3)#593 |
| 20. | Seven Corners | 32.1% | 20.2%(+11.9)#20 | 20.4%(+11.7)#651 |
| 21. | Laurel Park | 32.0% | 20.2%(+11.9)#21 | 20.4%(+11.7)#660 |
| 22. | Onley | 31.1% | 20.2%(+10.9)#22 | 20.4%(+10.7)#791 |
| 23. | Hybla Valley | 31.1% | 20.2%(+10.9)#23 | 20.4%(+10.7)#792 |
| 24. | Rio | 31.0% | 20.2%(+10.8)#24 | 20.4%(+10.6)#796 |
| 25. | Melfa | 30.9% | 20.2%(+10.7)#25 | 20.4%(+10.5)#814 |
| 26. | Port Royal | 30.7% | 20.2%(+10.5)#26 | 20.4%(+10.3)#849 |
| 27. | Afton | 30.0% | 20.2%(+9.84)#27 | 20.4%(+9.64)#970 |
| 28. | Ferrum | 29.9% | 20.2%(+9.75)#28 | 20.4%(+9.55)#994 |
| 29. | Fort Lee | 29.6% | 20.2%(+9.44)#29 | 20.4%(+9.24)#1,046 |
| 30. | Bensley | 29.5% | 20.2%(+9.37)#30 | 20.4%(+9.17)#1,057 |
| 31. | Sussex | 29.5% | 20.2%(+9.34)#31 | 20.4%(+9.14)#1,066 |
| 32. | Craigsville | 29.3% | 20.2%(+9.12)#32 | 20.4%(+8.92)#1,117 |
| 33. | Cleveland | 29.3% | 20.2%(+9.08)#33 | 20.4%(+8.89)#1,126 |
| 34. | Mountain Road | 29.2% | 20.2%(+9.01)#34 | 20.4%(+8.81)#1,146 |
| 35. | Bethel Manor | 28.7% | 20.2%(+8.54)#35 | 20.4%(+8.35)#1,256 |
| 36. | Bailey S Crossroads | 28.3% | 20.2%(+8.07)#36 | 20.4%(+7.87)#1,402 |
| 37. | Elliston | 28.2% | 20.2%(+8.03)#37 | 20.4%(+7.83)#1,417 |
| 38. | Gordonsville | 28.2% | 20.2%(+7.98)#38 | 20.4%(+7.78)#1,436 |
| 39. | Madison | 28.0% | 20.2%(+7.84)#39 | 20.4%(+7.64)#1,485 |
| 40. | Colonial Beach | 28.0% | 20.2%(+7.84)#40 | 20.4%(+7.64)#1,487 |
| 41. | Dahlgren Center | 27.8% | 20.2%(+7.65)#41 | 20.4%(+7.45)#1,572 |
| 42. | Petersburg | 27.6% | 20.2%(+7.46)#42 | 20.4%(+7.27)#1,634 |
| 43. | Louisa | 27.4% | 20.2%(+7.20)#43 | 20.4%(+7.00)#1,730 |
| 44. | Clinchco | 27.3% | 20.2%(+7.15)#44 | 20.4%(+6.96)#1,748 |
| 45. | La Crosse | 27.3% | 20.2%(+7.11)#45 | 20.4%(+6.91)#1,773 |
| 46. | Manassas Park | 27.2% | 20.2%(+7.05)#46 | 20.4%(+6.85)#1,799 |
| 47. | Dumbarton | 27.1% | 20.2%(+6.91)#47 | 20.4%(+6.71)#1,853 |
| 48. | Bull Run | 27.1% | 20.2%(+6.90)#48 | 20.4%(+6.70)#1,860 |
| 49. | Tappahannock | 26.9% | 20.2%(+6.71)#49 | 20.4%(+6.51)#1,943 |
| 50. | Matoaca | 26.9% | 20.2%(+6.68)#50 | 20.4%(+6.48)#1,966 |
| 51. | Tacoma | 26.8% | 20.2%(+6.64)#51 | 20.4%(+6.44)#1,984 |
| 52. | Portsmouth | 26.8% | 20.2%(+6.61)#52 | 20.4%(+6.42)#1,993 |
| 53. | Cape Charles | 26.7% | 20.2%(+6.57)#53 | 20.4%(+6.37)#2,024 |
| 54. | Remington | 26.5% | 20.2%(+6.36)#54 | 20.4%(+6.16)#2,123 |
| 55. | Oak Level | 26.5% | 20.2%(+6.35)#55 | 20.4%(+6.15)#2,131 |
| 56. | Huntington | 26.2% | 20.2%(+6.03)#56 | 20.4%(+5.83)#2,288 |
| 57. | Hutchison | 26.2% | 20.2%(+6.02)#57 | 20.4%(+5.82)#2,295 |
| 58. | Bedford | 26.1% | 20.2%(+5.92)#58 | 20.4%(+5.72)#2,337 |
| 59. | Richmond | 26.1% | 20.2%(+5.87)#59 | 20.4%(+5.68)#2,358 |
| 60. | Amelia Court House | 26.0% | 20.2%(+5.82)#60 | 20.4%(+5.62)#2,400 |
| 61. | Farmville | 25.9% | 20.2%(+5.73)#61 | 20.4%(+5.53)#2,459 |
| 62. | Southern Gateway | 25.9% | 20.2%(+5.72)#62 | 20.4%(+5.52)#2,465 |
| 63. | Dumfries | 25.8% | 20.2%(+5.58)#63 | 20.4%(+5.38)#2,557 |
| 64. | Sudley | 25.7% | 20.2%(+5.49)#64 | 20.4%(+5.29)#2,613 |
| 65. | Savageville | 25.7% | 20.2%(+5.48)#65 | 20.4%(+5.28)#2,617 |
| 66. | Nickelsville | 25.6% | 20.2%(+5.38)#66 | 20.4%(+5.18)#2,684 |
| 67. | Accomac | 25.5% | 20.2%(+5.36)#67 | 20.4%(+5.16)#2,698 |
| 68. | Shenandoah Shores | 25.5% | 20.2%(+5.32)#68 | 20.4%(+5.12)#2,725 |
| 69. | Ettrick | 25.4% | 20.2%(+5.26)#69 | 20.4%(+5.06)#2,754 |
| 70. | Emporia | 25.4% | 20.2%(+5.25)#70 | 20.4%(+5.05)#2,765 |
| 71. | Charlottesville | 25.4% | 20.2%(+5.19)#71 | 20.4%(+4.99)#2,797 |
| 72. | Highland Springs | 25.4% | 20.2%(+5.19)#72 | 20.4%(+4.99)#2,799 |
| 73. | Arcola | 25.3% | 20.2%(+5.16)#73 | 20.4%(+4.96)#2,818 |
| 74. | Norfolk | 25.3% | 20.2%(+5.14)#74 | 20.4%(+4.94)#2,828 |
| 75. | Mcgaheysville | 25.3% | 20.2%(+5.13)#75 | 20.4%(+4.93)#2,840 |
| 76. | Tazewell | 25.0% | 20.2%(+4.84)#76 | 20.4%(+4.65)#3,036 |
| 77. | Springfield | 25.0% | 20.2%(+4.83)#77 | 20.4%(+4.64)#3,045 |
| 78. | Twin Lakes | 25.0% | 20.2%(+4.79)#78 | 20.4%(+4.59)#3,080 |
| 79. | Pantops | 25.0% | 20.2%(+4.78)#79 | 20.4%(+4.58)#3,088 |
| 80. | Gretna | 24.8% | 20.2%(+4.58)#80 | 20.4%(+4.38)#3,240 |
| 81. | Greenville | 24.8% | 20.2%(+4.57)#81 | 20.4%(+4.38)#3,246 |
| 82. | St Paul | 24.7% | 20.2%(+4.56)#82 | 20.4%(+4.36)#3,261 |
| 83. | Drakes Branch | 24.5% | 20.2%(+4.37)#83 | 20.4%(+4.17)#3,408 |
| 84. | Crewe | 24.5% | 20.2%(+4.35)#84 | 20.4%(+4.15)#3,417 |
| 85. | Shenandoah Retreat | 24.5% | 20.2%(+4.32)#85 | 20.4%(+4.12)#3,443 |
| 86. | Victoria | 24.5% | 20.2%(+4.29)#86 | 20.4%(+4.09)#3,468 |
| 87. | Laurel | 24.5% | 20.2%(+4.29)#87 | 20.4%(+4.09)#3,470 |
| 88. | Winchester | 24.4% | 20.2%(+4.25)#88 | 20.4%(+4.05)#3,500 |
| 89. | Woodlawn Cdp Fairfax County | 24.3% | 20.2%(+4.17)#89 | 20.4%(+3.97)#3,586 |
| 90. | Potomac Mills | 24.3% | 20.2%(+4.14)#90 | 20.4%(+3.94)#3,611 |
| 91. | Stanardsville | 24.1% | 20.2%(+3.97)#91 | 20.4%(+3.77)#3,765 |
| 92. | Greenbush | 24.1% | 20.2%(+3.93)#92 | 20.4%(+3.73)#3,788 |
| 93. | Spotsylvania Courthouse | 24.0% | 20.2%(+3.87)#93 | 20.4%(+3.67)#3,837 |
| 94. | Esmont | 24.0% | 20.2%(+3.85)#94 | 20.4%(+3.65)#3,856 |
| 95. | Newport News | 24.0% | 20.2%(+3.78)#95 | 20.4%(+3.58)#3,898 |
| 96. | Clifton Forge | 23.9% | 20.2%(+3.71)#96 | 20.4%(+3.51)#3,975 |
| 97. | Hampton | 23.8% | 20.2%(+3.63)#97 | 20.4%(+3.43)#4,050 |
| 98. | Woodbridge | 23.8% | 20.2%(+3.62)#98 | 20.4%(+3.42)#4,061 |
| 99. | Keezletown | 23.7% | 20.2%(+3.54)#99 | 20.4%(+3.34)#4,137 |
| 100. | Warrenton | 23.7% | 20.2%(+3.51)#100 | 20.4%(+3.31)#4,174 |
Common Questions
What are the Top 10 Cities with the Highest Costs of Housing as Percentage of Income in Virginia?
Top 10 Cities with the Highest Costs of Housing as Percentage of Income in Virginia are:
#1
70.1%
#2
43.3%
#3
40.9%
#4
38.7%
#5
37.5%
#6
36.4%
#7
36.3%
#8
35.9%
#9
35.9%
#10
35.8%
What city has the Highest Costs of Housing as Percentage of Income in Virginia?
Southside Chesconessex has the Highest Costs of Housing as Percentage of Income in Virginia with 70.1%.
What is the Average Housing Costs as Percentage of Income in the State of Virginia?
Average Housing Costs as Percentage of Income in Virginia is 20.2%.
What is the Average Housing Costs as Percentage of Income in the United States?
Average Housing Costs as Percentage of Income in the United States is 20.4%.