Cities with the Highest Costs of Housing as Percentage of Income in North Carolina
RELATED REPORTS & OPTIONS
Highest Housing Costs / Income
North Carolina
Compare Cities
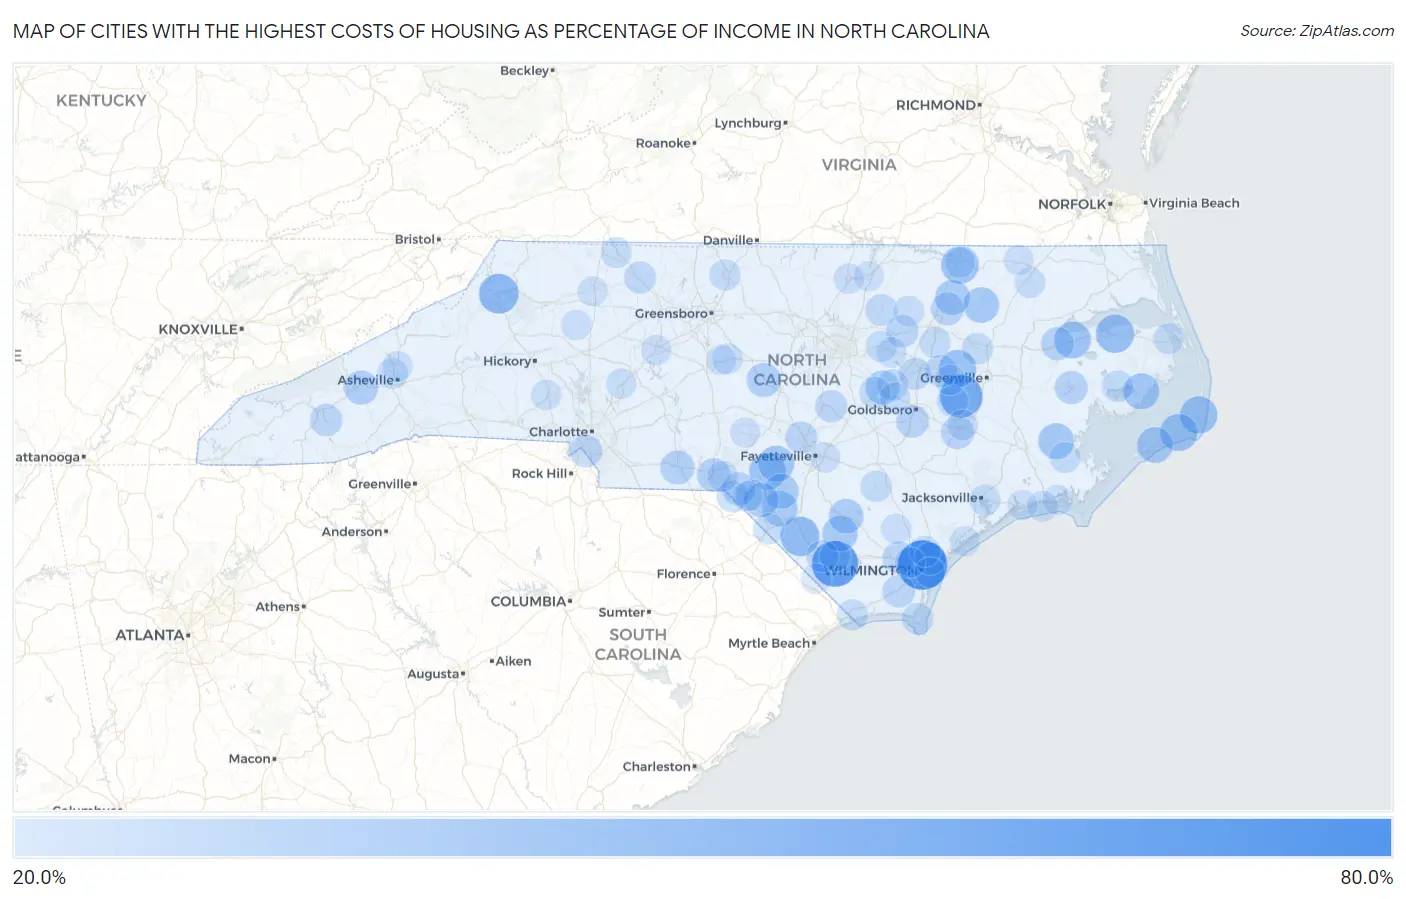
Map of Cities with the Highest Costs of Housing as Percentage of Income in North Carolina
0.0%
80.0%
Cities with the Highest Costs of Housing as Percentage of Income in North Carolina
| City | Housing Costs / Income | vs State | vs National | |
| 1. | Hightsville | 66.9% | 19.6%(+47.3)#1 | 20.4%(+46.5)#35 |
| 2. | Chowan Beach | 59.9% | 19.6%(+40.3)#2 | 20.4%(+39.5)#44 |
| 3. | Brunswick | 59.6% | 19.6%(+40.0)#3 | 20.4%(+39.2)#48 |
| 4. | Maury | 52.1% | 19.6%(+32.5)#4 | 20.4%(+31.8)#72 |
| 5. | Boone | 45.4% | 19.6%(+25.8)#5 | 20.4%(+25.0)#109 |
| 6. | Orrum | 44.3% | 19.6%(+24.8)#6 | 20.4%(+24.0)#123 |
| 7. | Columbia | 42.2% | 19.6%(+22.6)#7 | 20.4%(+21.9)#152 |
| 8. | Fountain | 40.9% | 19.6%(+21.3)#8 | 20.4%(+20.5)#169 |
| 9. | South Weldon | 40.8% | 19.6%(+21.2)#9 | 20.4%(+20.4)#176 |
| 10. | Avon | 40.5% | 19.6%(+20.9)#10 | 20.4%(+20.1)#180 |
| 11. | Hatteras | 40.5% | 19.6%(+20.9)#11 | 20.4%(+20.1)#181 |
| 12. | Roper | 39.2% | 19.6%(+19.6)#12 | 20.4%(+18.8)#215 |
| 13. | Bowmore | 39.0% | 19.6%(+19.4)#13 | 20.4%(+18.6)#220 |
| 14. | Silver City | 38.0% | 19.6%(+18.4)#14 | 20.4%(+17.6)#247 |
| 15. | Engelhard | 37.6% | 19.6%(+18.1)#15 | 20.4%(+17.3)#261 |
| 16. | Bayboro | 37.5% | 19.6%(+17.9)#16 | 20.4%(+17.2)#266 |
| 17. | Ocracoke | 37.3% | 19.6%(+17.7)#17 | 20.4%(+16.9)#284 |
| 18. | Scotland Neck | 36.8% | 19.6%(+17.2)#18 | 20.4%(+16.4)#306 |
| 19. | Clarkton | 36.4% | 19.6%(+16.8)#19 | 20.4%(+16.0)#334 |
| 20. | Pembroke | 36.1% | 19.6%(+16.5)#20 | 20.4%(+15.7)#345 |
| 21. | Red Springs | 35.3% | 19.6%(+15.8)#21 | 20.4%(+15.0)#381 |
| 22. | Enfield | 35.3% | 19.6%(+15.7)#22 | 20.4%(+14.9)#386 |
| 23. | Elizabethtown | 34.8% | 19.6%(+15.3)#23 | 20.4%(+14.5)#415 |
| 24. | Maxton | 34.7% | 19.6%(+15.2)#24 | 20.4%(+14.4)#423 |
| 25. | West Canton | 33.8% | 19.6%(+14.3)#25 | 20.4%(+13.5)#484 |
| 26. | Goldston | 33.7% | 19.6%(+14.1)#26 | 20.4%(+13.3)#499 |
| 27. | Selma | 33.5% | 19.6%(+13.9)#27 | 20.4%(+13.1)#508 |
| 28. | Wadesboro | 33.3% | 19.6%(+13.7)#28 | 20.4%(+12.9)#524 |
| 29. | East Rockingham | 32.4% | 19.6%(+12.9)#29 | 20.4%(+12.1)#613 |
| 30. | Laurel Hill | 31.7% | 19.6%(+12.1)#30 | 20.4%(+11.3)#706 |
| 31. | Plymouth | 31.5% | 19.6%(+12.0)#31 | 20.4%(+11.2)#719 |
| 32. | Belhaven | 31.4% | 19.6%(+11.8)#32 | 20.4%(+11.0)#735 |
| 33. | Jackson Heights | 31.3% | 19.6%(+11.7)#33 | 20.4%(+10.9)#755 |
| 34. | Brogden | 31.2% | 19.6%(+11.6)#34 | 20.4%(+10.8)#759 |
| 35. | Whitakers | 31.2% | 19.6%(+11.6)#35 | 20.4%(+10.8)#762 |
| 36. | Bolivia | 30.6% | 19.6%(+11.0)#36 | 20.4%(+10.2)#862 |
| 37. | Cullowhee | 30.2% | 19.6%(+10.6)#37 | 20.4%(+9.80)#941 |
| 38. | Spring Hope | 30.1% | 19.6%(+10.5)#38 | 20.4%(+9.69)#959 |
| 39. | Pineville | 30.1% | 19.6%(+10.5)#39 | 20.4%(+9.68)#962 |
| 40. | Northwest | 29.9% | 19.6%(+10.3)#40 | 20.4%(+9.48)#998 |
| 41. | Buies Creek | 29.8% | 19.6%(+10.2)#41 | 20.4%(+9.42)#1,009 |
| 42. | Spring Lake | 29.6% | 19.6%(+10.0)#42 | 20.4%(+9.24)#1,045 |
| 43. | Northchase | 29.4% | 19.6%(+9.87)#43 | 20.4%(+9.07)#1,080 |
| 44. | Chadbourn | 29.4% | 19.6%(+9.81)#44 | 20.4%(+9.01)#1,096 |
| 45. | Saratoga | 29.4% | 19.6%(+9.79)#45 | 20.4%(+9.00)#1,099 |
| 46. | Lucama | 29.3% | 19.6%(+9.73)#46 | 20.4%(+8.93)#1,111 |
| 47. | Louisburg | 29.2% | 19.6%(+9.66)#47 | 20.4%(+8.87)#1,133 |
| 48. | Pinnacle | 29.1% | 19.6%(+9.56)#48 | 20.4%(+8.77)#1,153 |
| 49. | Gibson | 29.0% | 19.6%(+9.37)#49 | 20.4%(+8.58)#1,199 |
| 50. | Bald Head Island | 28.5% | 19.6%(+8.94)#50 | 20.4%(+8.14)#1,313 |
| 51. | Fairfield | 28.3% | 19.6%(+8.75)#51 | 20.4%(+7.96)#1,378 |
| 52. | Conetoe | 28.2% | 19.6%(+8.66)#52 | 20.4%(+7.87)#1,404 |
| 53. | Micro | 28.2% | 19.6%(+8.61)#53 | 20.4%(+7.81)#1,424 |
| 54. | Smithfield | 28.2% | 19.6%(+8.60)#54 | 20.4%(+7.81)#1,425 |
| 55. | Ingold | 28.0% | 19.6%(+8.44)#55 | 20.4%(+7.65)#1,481 |
| 56. | Snow Hill | 28.0% | 19.6%(+8.39)#56 | 20.4%(+7.59)#1,506 |
| 57. | Rowland | 27.6% | 19.6%(+8.01)#57 | 20.4%(+7.21)#1,651 |
| 58. | Zebulon | 27.6% | 19.6%(+8.01)#58 | 20.4%(+7.21)#1,652 |
| 59. | Sharpsburg | 27.6% | 19.6%(+7.99)#59 | 20.4%(+7.19)#1,660 |
| 60. | Castle Hayne | 27.4% | 19.6%(+7.82)#60 | 20.4%(+7.02)#1,720 |
| 61. | Reidsville | 27.4% | 19.6%(+7.80)#61 | 20.4%(+7.01)#1,727 |
| 62. | Calabash | 27.4% | 19.6%(+7.79)#62 | 20.4%(+6.99)#1,734 |
| 63. | East Laurinburg | 27.4% | 19.6%(+7.79)#63 | 20.4%(+6.99)#1,736 |
| 64. | Jacksonville | 27.4% | 19.6%(+7.77)#64 | 20.4%(+6.98)#1,740 |
| 65. | Oriental | 27.2% | 19.6%(+7.65)#65 | 20.4%(+6.85)#1,797 |
| 66. | Toast | 27.1% | 19.6%(+7.51)#66 | 20.4%(+6.71)#1,851 |
| 67. | Castalia | 27.0% | 19.6%(+7.46)#67 | 20.4%(+6.66)#1,880 |
| 68. | Dobbins Heights | 27.0% | 19.6%(+7.43)#68 | 20.4%(+6.64)#1,891 |
| 69. | Ramseur | 26.9% | 19.6%(+7.36)#69 | 20.4%(+6.56)#1,917 |
| 70. | Indian Beach | 26.9% | 19.6%(+7.34)#70 | 20.4%(+6.55)#1,925 |
| 71. | Woodfin | 26.8% | 19.6%(+7.26)#71 | 20.4%(+6.47)#1,971 |
| 72. | Ahoskie | 26.8% | 19.6%(+7.22)#72 | 20.4%(+6.42)#1,989 |
| 73. | Whiteville | 26.7% | 19.6%(+7.11)#73 | 20.4%(+6.32)#2,047 |
| 74. | Manns Harbor | 26.6% | 19.6%(+7.05)#74 | 20.4%(+6.26)#2,076 |
| 75. | Kinston | 26.6% | 19.6%(+7.01)#75 | 20.4%(+6.21)#2,095 |
| 76. | Navassa | 26.4% | 19.6%(+6.81)#76 | 20.4%(+6.02)#2,197 |
| 77. | Love Valley | 26.2% | 19.6%(+6.67)#77 | 20.4%(+5.87)#2,263 |
| 78. | Vander | 26.2% | 19.6%(+6.66)#78 | 20.4%(+5.86)#2,276 |
| 79. | Atkinson | 26.2% | 19.6%(+6.65)#79 | 20.4%(+5.86)#2,279 |
| 80. | Walstonburg | 26.1% | 19.6%(+6.55)#80 | 20.4%(+5.75)#2,324 |
| 81. | Middlesex | 26.1% | 19.6%(+6.53)#81 | 20.4%(+5.74)#2,332 |
| 82. | Lexington | 26.1% | 19.6%(+6.49)#82 | 20.4%(+5.70)#2,347 |
| 83. | Oxford | 26.0% | 19.6%(+6.47)#83 | 20.4%(+5.67)#2,363 |
| 84. | Princeton | 26.0% | 19.6%(+6.40)#84 | 20.4%(+5.61)#2,411 |
| 85. | Weldon | 26.0% | 19.6%(+6.39)#85 | 20.4%(+5.60)#2,417 |
| 86. | Weaverville | 25.9% | 19.6%(+6.33)#86 | 20.4%(+5.54)#2,452 |
| 87. | Farmington | 25.9% | 19.6%(+6.32)#87 | 20.4%(+5.52)#2,462 |
| 88. | China Grove | 25.9% | 19.6%(+6.30)#88 | 20.4%(+5.51)#2,473 |
| 89. | Lincolnton | 25.8% | 19.6%(+6.26)#89 | 20.4%(+5.46)#2,504 |
| 90. | Surf City | 25.8% | 19.6%(+6.25)#90 | 20.4%(+5.45)#2,509 |
| 91. | Wilmington | 25.8% | 19.6%(+6.19)#91 | 20.4%(+5.39)#2,545 |
| 92. | Tabor City | 25.7% | 19.6%(+6.17)#92 | 20.4%(+5.37)#2,558 |
| 93. | Morehead City | 25.7% | 19.6%(+6.15)#93 | 20.4%(+5.36)#2,568 |
| 94. | Murfreesboro | 25.7% | 19.6%(+6.14)#94 | 20.4%(+5.35)#2,581 |
| 95. | Franklinville | 25.7% | 19.6%(+6.12)#95 | 20.4%(+5.32)#2,593 |
| 96. | Henderson | 25.6% | 19.6%(+6.06)#96 | 20.4%(+5.27)#2,630 |
| 97. | Laurinburg | 25.6% | 19.6%(+6.05)#97 | 20.4%(+5.26)#2,634 |
| 98. | Taylortown | 25.6% | 19.6%(+5.97)#98 | 20.4%(+5.18)#2,687 |
| 99. | Jonesville | 25.5% | 19.6%(+5.94)#99 | 20.4%(+5.15)#2,704 |
| 100. | Cape Carteret | 25.5% | 19.6%(+5.90)#100 | 20.4%(+5.11)#2,734 |
Common Questions
What are the Top 10 Cities with the Highest Costs of Housing as Percentage of Income in North Carolina?
Top 10 Cities with the Highest Costs of Housing as Percentage of Income in North Carolina are:
#1
66.9%
#2
59.6%
#3
52.1%
#4
45.4%
#5
44.3%
#6
42.2%
#7
40.9%
#8
40.8%
#9
40.5%
#10
40.5%
What city has the Highest Costs of Housing as Percentage of Income in North Carolina?
Hightsville has the Highest Costs of Housing as Percentage of Income in North Carolina with 66.9%.
What is the Average Housing Costs as Percentage of Income in the State of North Carolina?
Average Housing Costs as Percentage of Income in North Carolina is 19.6%.
What is the Average Housing Costs as Percentage of Income in the United States?
Average Housing Costs as Percentage of Income in the United States is 20.4%.