Cities with the Highest Costs of Housing as Percentage of Income in Mississippi
RELATED REPORTS & OPTIONS
Highest Housing Costs / Income
Mississippi
Compare Cities
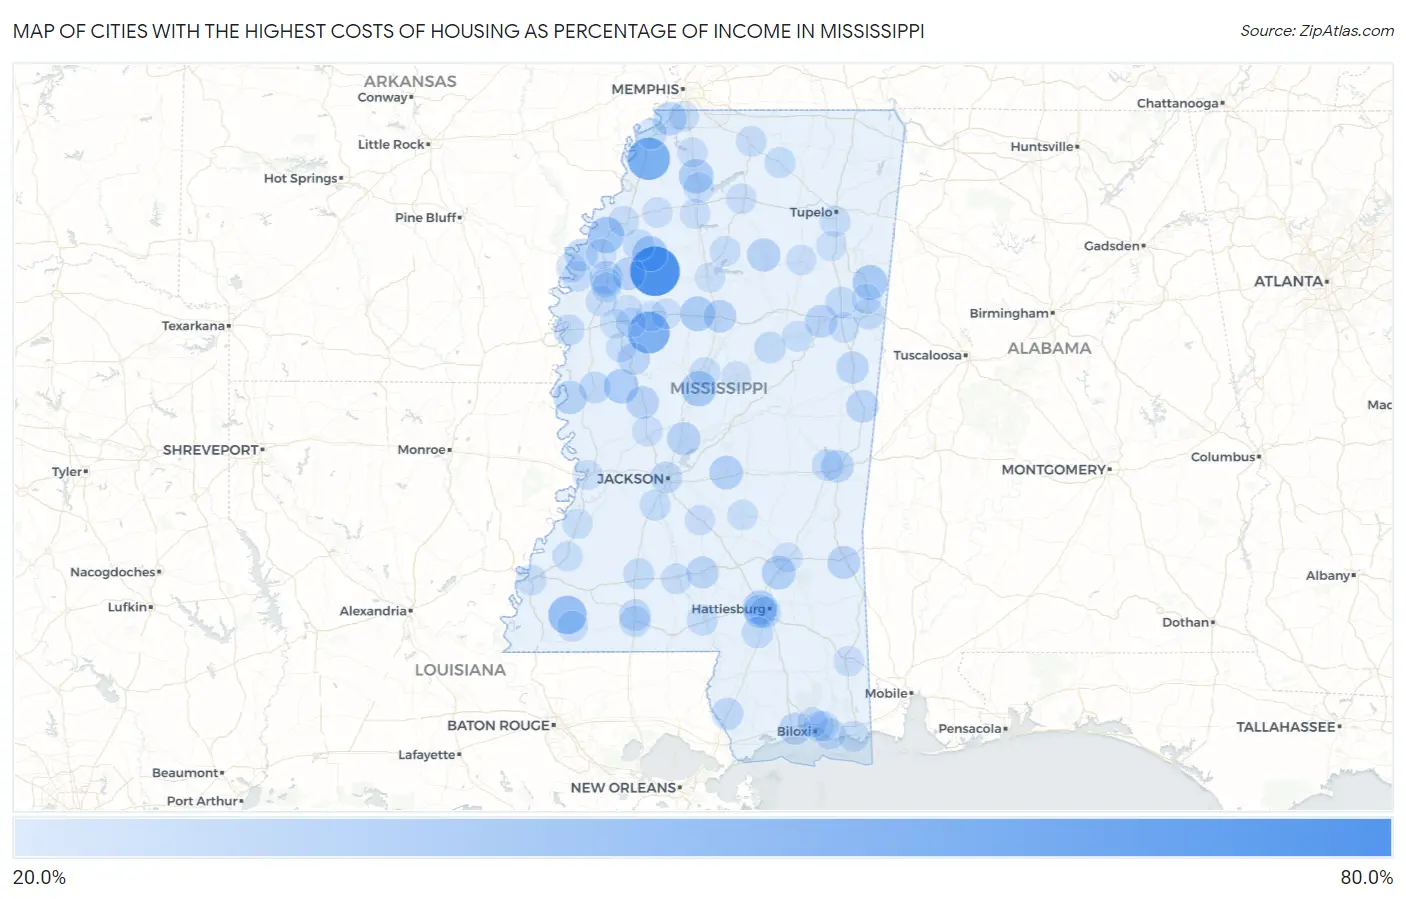
Map of Cities with the Highest Costs of Housing as Percentage of Income in Mississippi
0.0%
80.0%
Cities with the Highest Costs of Housing as Percentage of Income in Mississippi
| City | Housing Costs / Income | vs State | vs National | |
| 1. | Glendora | 77.4% | 18.5%(+58.8)#1 | 20.4%(+57.0)#25 |
| 2. | White Oak | 56.6% | 18.5%(+38.1)#2 | 20.4%(+36.2)#58 |
| 3. | Morgan City | 55.1% | 18.5%(+36.6)#3 | 20.4%(+34.7)#62 |
| 4. | Crosby | 44.6% | 18.5%(+26.1)#4 | 20.4%(+24.3)#116 |
| 5. | Alligator | 38.4% | 18.5%(+19.9)#5 | 20.4%(+18.1)#233 |
| 6. | Goodman | 36.3% | 18.5%(+17.7)#6 | 20.4%(+15.9)#336 |
| 7. | Webb | 35.8% | 18.5%(+17.2)#7 | 20.4%(+15.4)#363 |
| 8. | Hamilton | 35.5% | 18.5%(+17.0)#8 | 20.4%(+15.2)#368 |
| 9. | North Carrollton | 34.7% | 18.5%(+16.1)#9 | 20.4%(+14.3)#426 |
| 10. | Louise | 34.2% | 18.5%(+15.7)#10 | 20.4%(+13.8)#453 |
| 11. | Como | 34.2% | 18.5%(+15.6)#11 | 20.4%(+13.8)#458 |
| 12. | Arnold Line | 33.2% | 18.5%(+14.7)#12 | 20.4%(+12.8)#533 |
| 13. | Ellisville | 31.9% | 18.5%(+13.3)#13 | 20.4%(+11.5)#678 |
| 14. | Morton | 31.6% | 18.5%(+13.0)#14 | 20.4%(+11.2)#716 |
| 15. | Walls | 31.0% | 18.5%(+12.4)#15 | 20.4%(+10.6)#801 |
| 16. | Mayersville | 30.8% | 18.5%(+12.2)#16 | 20.4%(+10.4)#832 |
| 17. | Canton | 30.7% | 18.5%(+12.1)#17 | 20.4%(+10.3)#850 |
| 18. | Harperville | 30.4% | 18.5%(+11.8)#18 | 20.4%(+10.0)#900 |
| 19. | Pittsboro | 30.4% | 18.5%(+11.8)#19 | 20.4%(+10.0)#901 |
| 20. | West Hattiesburg | 30.4% | 18.5%(+11.8)#20 | 20.4%(+9.99)#906 |
| 21. | Renova | 30.3% | 18.5%(+11.8)#21 | 20.4%(+9.93)#910 |
| 22. | Waynesboro | 29.7% | 18.5%(+11.1)#22 | 20.4%(+9.31)#1,032 |
| 23. | Yazoo City | 29.5% | 18.5%(+11.0)#23 | 20.4%(+9.14)#1,067 |
| 24. | Drew | 29.5% | 18.5%(+10.9)#24 | 20.4%(+9.08)#1,078 |
| 25. | Starkville | 29.3% | 18.5%(+10.8)#25 | 20.4%(+8.96)#1,104 |
| 26. | Winona | 29.2% | 18.5%(+10.6)#26 | 20.4%(+8.79)#1,150 |
| 27. | Scooba | 28.8% | 18.5%(+10.3)#27 | 20.4%(+8.42)#1,235 |
| 28. | Meridian | 28.5% | 18.5%(+9.95)#28 | 20.4%(+8.13)#1,318 |
| 29. | Gunnison | 28.4% | 18.5%(+9.85)#29 | 20.4%(+8.02)#1,355 |
| 30. | Mount Pleasant | 27.9% | 18.5%(+9.33)#30 | 20.4%(+7.51)#1,543 |
| 31. | Macon | 27.8% | 18.5%(+9.25)#31 | 20.4%(+7.42)#1,585 |
| 32. | Belzoni | 27.5% | 18.5%(+8.92)#32 | 20.4%(+7.09)#1,699 |
| 33. | Prentiss | 27.3% | 18.5%(+8.74)#33 | 20.4%(+6.91)#1,768 |
| 34. | Gulfport | 27.2% | 18.5%(+8.62)#34 | 20.4%(+6.80)#1,817 |
| 35. | Picayune | 26.9% | 18.5%(+8.31)#35 | 20.4%(+6.49)#1,958 |
| 36. | Hattiesburg | 26.6% | 18.5%(+8.04)#36 | 20.4%(+6.21)#2,096 |
| 37. | Summit | 26.4% | 18.5%(+7.83)#37 | 20.4%(+6.01)#2,202 |
| 38. | Jackson | 26.3% | 18.5%(+7.79)#38 | 20.4%(+5.96)#2,220 |
| 39. | Anguilla | 26.3% | 18.5%(+7.71)#39 | 20.4%(+5.89)#2,258 |
| 40. | West Point | 26.1% | 18.5%(+7.54)#40 | 20.4%(+5.71)#2,342 |
| 41. | Nellieburg | 26.0% | 18.5%(+7.44)#41 | 20.4%(+5.62)#2,407 |
| 42. | Purvis | 26.0% | 18.5%(+7.43)#42 | 20.4%(+5.61)#2,412 |
| 43. | Columbus | 25.9% | 18.5%(+7.36)#43 | 20.4%(+5.53)#2,456 |
| 44. | Weir | 25.9% | 18.5%(+7.33)#44 | 20.4%(+5.50)#2,478 |
| 45. | Tutwiler | 25.9% | 18.5%(+7.32)#45 | 20.4%(+5.49)#2,485 |
| 46. | Gulf Park Estates | 25.6% | 18.5%(+7.02)#46 | 20.4%(+5.19)#2,679 |
| 47. | Mccomb | 25.6% | 18.5%(+7.00)#47 | 20.4%(+5.18)#2,689 |
| 48. | Greenville | 25.3% | 18.5%(+6.78)#48 | 20.4%(+4.96)#2,817 |
| 49. | Tunica Resorts | 25.2% | 18.5%(+6.66)#49 | 20.4%(+4.84)#2,902 |
| 50. | Gloster | 24.9% | 18.5%(+6.34)#50 | 20.4%(+4.51)#3,154 |
| 51. | Hickory Flat | 24.6% | 18.5%(+6.09)#51 | 20.4%(+4.26)#3,335 |
| 52. | Brookhaven | 24.6% | 18.5%(+6.06)#52 | 20.4%(+4.23)#3,362 |
| 53. | Foxworth | 24.6% | 18.5%(+6.01)#53 | 20.4%(+4.19)#3,394 |
| 54. | Terry | 24.5% | 18.5%(+5.92)#54 | 20.4%(+4.10)#3,464 |
| 55. | Pascagoula | 24.3% | 18.5%(+5.72)#55 | 20.4%(+3.90)#3,642 |
| 56. | Coffeeville | 24.2% | 18.5%(+5.65)#56 | 20.4%(+3.83)#3,699 |
| 57. | Verona | 24.2% | 18.5%(+5.65)#57 | 20.4%(+3.82)#3,707 |
| 58. | Durant | 24.1% | 18.5%(+5.59)#58 | 20.4%(+3.76)#3,769 |
| 59. | Shaw | 24.1% | 18.5%(+5.53)#59 | 20.4%(+3.70)#3,808 |
| 60. | Sturgis | 23.9% | 18.5%(+5.35)#60 | 20.4%(+3.52)#3,962 |
| 61. | Clarksdale | 23.7% | 18.5%(+5.16)#61 | 20.4%(+3.33)#4,143 |
| 62. | Natchez | 23.7% | 18.5%(+5.15)#62 | 20.4%(+3.32)#4,159 |
| 63. | St Martin | 23.7% | 18.5%(+5.14)#63 | 20.4%(+3.32)#4,167 |
| 64. | Cleveland | 23.7% | 18.5%(+5.11)#64 | 20.4%(+3.28)#4,209 |
| 65. | Holly Springs | 23.6% | 18.5%(+5.03)#65 | 20.4%(+3.20)#4,286 |
| 66. | Sardis | 23.6% | 18.5%(+5.00)#66 | 20.4%(+3.18)#4,312 |
| 67. | Beulah | 23.5% | 18.5%(+4.95)#67 | 20.4%(+3.13)#4,369 |
| 68. | Monticello | 23.5% | 18.5%(+4.92)#68 | 20.4%(+3.09)#4,410 |
| 69. | Oxford | 23.4% | 18.5%(+4.80)#69 | 20.4%(+2.98)#4,512 |
| 70. | Bentonia | 23.3% | 18.5%(+4.73)#70 | 20.4%(+2.90)#4,595 |
| 71. | Horn Lake | 23.2% | 18.5%(+4.69)#71 | 20.4%(+2.86)#4,620 |
| 72. | Marks | 23.2% | 18.5%(+4.64)#72 | 20.4%(+2.81)#4,675 |
| 73. | Greenwood | 23.2% | 18.5%(+4.61)#73 | 20.4%(+2.79)#4,708 |
| 74. | Itta Bena | 23.1% | 18.5%(+4.58)#74 | 20.4%(+2.75)#4,744 |
| 75. | Artesia | 23.1% | 18.5%(+4.53)#75 | 20.4%(+2.71)#4,802 |
| 76. | Sunflower | 23.1% | 18.5%(+4.53)#76 | 20.4%(+2.70)#4,804 |
| 77. | Gulf Hills | 23.1% | 18.5%(+4.51)#77 | 20.4%(+2.68)#4,824 |
| 78. | Lucedale | 23.0% | 18.5%(+4.50)#78 | 20.4%(+2.67)#4,837 |
| 79. | Raleigh | 23.0% | 18.5%(+4.45)#79 | 20.4%(+2.62)#4,901 |
| 80. | Houston | 23.0% | 18.5%(+4.44)#80 | 20.4%(+2.62)#4,904 |
| 81. | D Iberville | 23.0% | 18.5%(+4.44)#81 | 20.4%(+2.61)#4,914 |
| 82. | Isola | 22.9% | 18.5%(+4.39)#82 | 20.4%(+2.56)#4,988 |
| 83. | D Lo | 22.9% | 18.5%(+4.35)#83 | 20.4%(+2.52)#5,029 |
| 84. | Rosedale | 22.9% | 18.5%(+4.33)#84 | 20.4%(+2.50)#5,052 |
| 85. | Coldwater | 22.7% | 18.5%(+4.17)#85 | 20.4%(+2.34)#5,250 |
| 86. | Fernwood | 22.7% | 18.5%(+4.13)#86 | 20.4%(+2.30)#5,311 |
| 87. | Courtland | 22.7% | 18.5%(+4.12)#87 | 20.4%(+2.30)#5,323 |
| 88. | Port Gibson | 22.7% | 18.5%(+4.12)#88 | 20.4%(+2.29)#5,324 |
| 89. | Fayette | 22.6% | 18.5%(+4.05)#89 | 20.4%(+2.22)#5,415 |
| 90. | Grenada | 22.5% | 18.5%(+3.94)#90 | 20.4%(+2.11)#5,532 |
| 91. | Vicksburg | 22.5% | 18.5%(+3.91)#91 | 20.4%(+2.08)#5,562 |
| 92. | Moorhead | 22.4% | 18.5%(+3.86)#92 | 20.4%(+2.03)#5,635 |
| 93. | Indianola | 22.3% | 18.5%(+3.80)#93 | 20.4%(+1.97)#5,714 |
| 94. | Laurel | 22.3% | 18.5%(+3.78)#94 | 20.4%(+1.95)#5,748 |
| 95. | Okolona | 22.2% | 18.5%(+3.62)#95 | 20.4%(+1.80)#5,959 |
| 96. | Shelby | 22.1% | 18.5%(+3.60)#96 | 20.4%(+1.77)#5,994 |
| 97. | Gluckstadt | 22.1% | 18.5%(+3.57)#97 | 20.4%(+1.75)#6,024 |
| 98. | Kosciusko | 22.1% | 18.5%(+3.55)#98 | 20.4%(+1.72)#6,059 |
| 99. | Columbus Afb | 22.1% | 18.5%(+3.54)#99 | 20.4%(+1.71)#6,076 |
| 100. | Boyle | 22.1% | 18.5%(+3.53)#100 | 20.4%(+1.70)#6,092 |
Common Questions
What are the Top 10 Cities with the Highest Costs of Housing as Percentage of Income in Mississippi?
Top 10 Cities with the Highest Costs of Housing as Percentage of Income in Mississippi are:
#1
77.4%
#2
56.6%
#3
55.1%
#4
44.6%
#5
38.4%
#6
36.3%
#7
35.8%
#8
35.5%
#9
34.7%
#10
34.2%
What city has the Highest Costs of Housing as Percentage of Income in Mississippi?
Glendora has the Highest Costs of Housing as Percentage of Income in Mississippi with 77.4%.
What is the Average Housing Costs as Percentage of Income in the State of Mississippi?
Average Housing Costs as Percentage of Income in Mississippi is 18.5%.
What is the Average Housing Costs as Percentage of Income in the United States?
Average Housing Costs as Percentage of Income in the United States is 20.4%.