Cities with the Highest Costs of Housing as Percentage of Income in New Mexico
RELATED REPORTS & OPTIONS
Highest Housing Costs / Income
New Mexico
Compare Cities
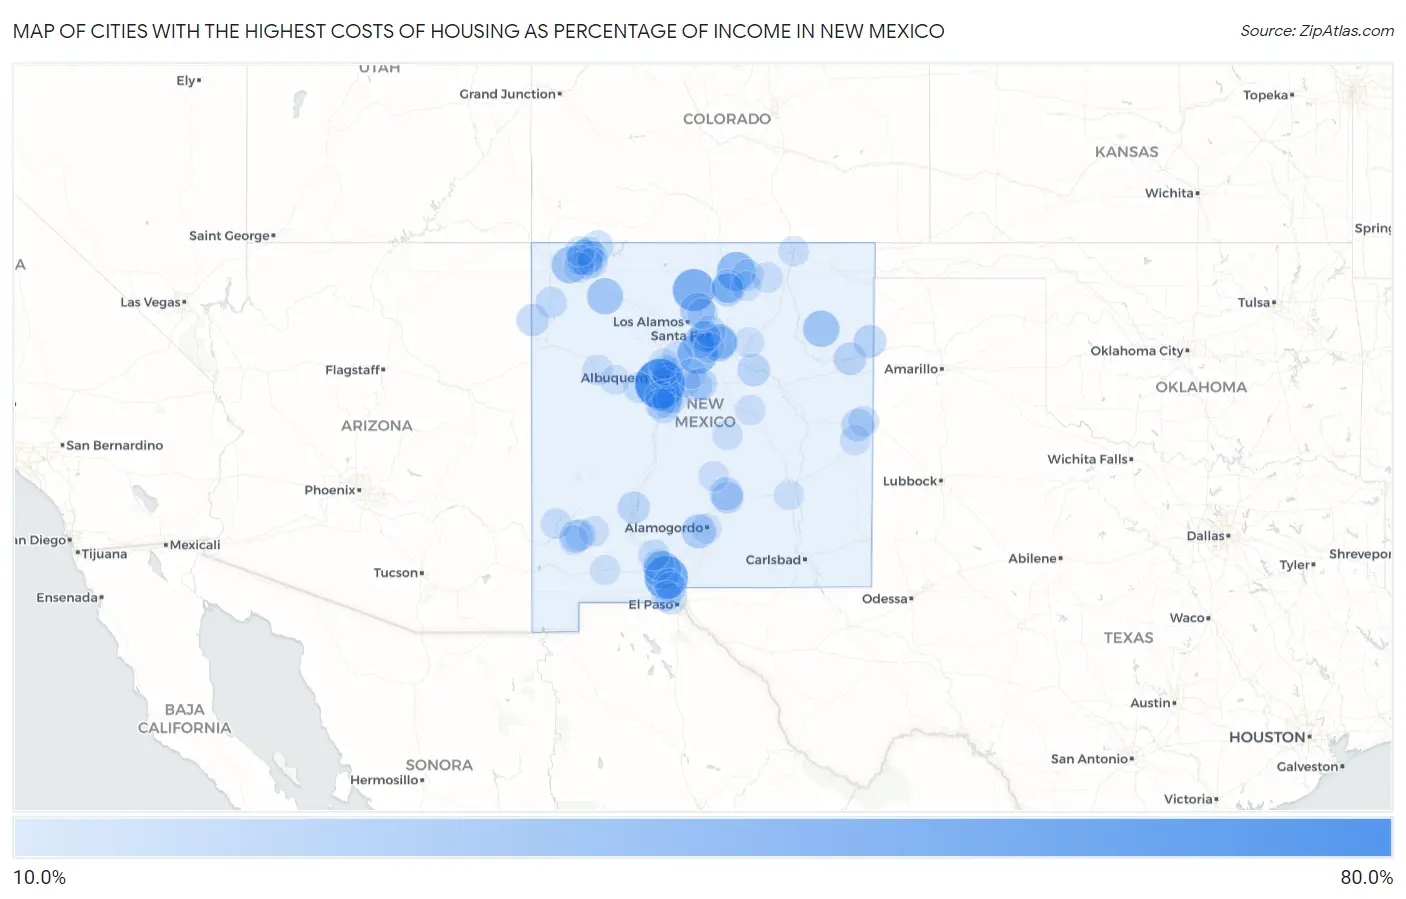
Map of Cities with the Highest Costs of Housing as Percentage of Income in New Mexico
0.0%
80.0%
Cities with the Highest Costs of Housing as Percentage of Income in New Mexico
| City | Housing Costs / Income | vs State | vs National | |
| 1. | Pajarito Mesa | 76.3% | 18.8%(+57.5)#1 | 20.4%(+56.0)#27 |
| 2. | Mesquite | 57.5% | 18.8%(+38.6)#2 | 20.4%(+37.1)#53 |
| 3. | El Rito | 53.2% | 18.8%(+34.3)#3 | 20.4%(+32.8)#67 |
| 4. | Los Cerrillos | 47.5% | 18.8%(+28.7)#4 | 20.4%(+27.1)#91 |
| 5. | Taos Ski Valley | 43.5% | 18.8%(+24.7)#5 | 20.4%(+23.2)#133 |
| 6. | Ojo Encino | 42.3% | 18.8%(+23.4)#6 | 20.4%(+21.9)#150 |
| 7. | University Park | 40.4% | 18.8%(+21.6)#7 | 20.4%(+20.0)#184 |
| 8. | Glorieta | 39.3% | 18.8%(+20.5)#8 | 20.4%(+18.9)#208 |
| 9. | Ojo Amarillo | 37.7% | 18.8%(+18.9)#9 | 20.4%(+17.3)#257 |
| 10. | Mosquero | 36.6% | 18.8%(+17.8)#10 | 20.4%(+16.3)#317 |
| 11. | Nageezi | 36.0% | 18.8%(+17.2)#11 | 20.4%(+15.6)#347 |
| 12. | Flora Vista | 35.0% | 18.8%(+16.2)#12 | 20.4%(+14.6)#404 |
| 13. | Hernandez | 31.7% | 18.8%(+12.9)#13 | 20.4%(+11.4)#697 |
| 14. | Thunder Mountain | 31.6% | 18.8%(+12.8)#14 | 20.4%(+11.3)#711 |
| 15. | Holloman Afb | 30.1% | 18.8%(+11.2)#15 | 20.4%(+9.68)#961 |
| 16. | Conejo | 29.5% | 18.8%(+10.6)#16 | 20.4%(+9.08)#1,076 |
| 17. | Taos | 29.3% | 18.8%(+10.4)#17 | 20.4%(+8.89)#1,125 |
| 18. | Middle Mesa | 29.0% | 18.8%(+10.2)#18 | 20.4%(+8.64)#1,181 |
| 19. | Valle Vista | 28.5% | 18.8%(+9.69)#19 | 20.4%(+8.16)#1,310 |
| 20. | Ruidoso | 27.2% | 18.8%(+8.40)#20 | 20.4%(+6.87)#1,792 |
| 21. | Talpa | 26.8% | 18.8%(+7.94)#21 | 20.4%(+6.40)#1,998 |
| 22. | La Cueva | 26.3% | 18.8%(+7.47)#22 | 20.4%(+5.93)#2,237 |
| 23. | Nara Visa | 26.1% | 18.8%(+7.29)#23 | 20.4%(+5.75)#2,325 |
| 24. | Logan | 26.1% | 18.8%(+7.24)#24 | 20.4%(+5.71)#2,343 |
| 25. | Borrego Pass | 26.0% | 18.8%(+7.19)#25 | 20.4%(+5.65)#2,381 |
| 26. | Agua Fria | 25.9% | 18.8%(+7.05)#26 | 20.4%(+5.51)#2,470 |
| 27. | Silver City | 25.7% | 18.8%(+6.85)#27 | 20.4%(+5.32)#2,597 |
| 28. | Anton Chico | 25.7% | 18.8%(+6.82)#28 | 20.4%(+5.29)#2,615 |
| 29. | Kirtland Afb | 25.5% | 18.8%(+6.61)#29 | 20.4%(+5.08)#2,746 |
| 30. | Cannon Afb | 25.1% | 18.8%(+6.31)#30 | 20.4%(+4.77)#2,948 |
| 31. | Navajo | 24.9% | 18.8%(+6.09)#31 | 20.4%(+4.55)#3,111 |
| 32. | Placitas Cdp Dona Ana County | 24.9% | 18.8%(+6.05)#32 | 20.4%(+4.52)#3,150 |
| 33. | Truth Or Consequences | 24.5% | 18.8%(+5.67)#33 | 20.4%(+4.14)#3,435 |
| 34. | San Antonito Cdp Bernalillo County | 24.4% | 18.8%(+5.58)#34 | 20.4%(+4.04)#3,507 |
| 35. | Ruidoso Downs | 24.2% | 18.8%(+5.33)#35 | 20.4%(+3.80)#3,728 |
| 36. | Peralta | 24.0% | 18.8%(+5.15)#36 | 20.4%(+3.62)#3,873 |
| 37. | La Cienega | 23.8% | 18.8%(+5.01)#37 | 20.4%(+3.47)#4,008 |
| 38. | Indian Hills | 23.4% | 18.8%(+4.56)#38 | 20.4%(+3.03)#4,468 |
| 39. | Moriarty | 23.1% | 18.8%(+4.27)#39 | 20.4%(+2.73)#4,769 |
| 40. | Rio Communities | 22.9% | 18.8%(+4.08)#40 | 20.4%(+2.55)#5,002 |
| 41. | Williams Acres | 22.9% | 18.8%(+4.08)#41 | 20.4%(+2.54)#5,004 |
| 42. | South Valley | 22.8% | 18.8%(+3.94)#42 | 20.4%(+2.40)#5,172 |
| 43. | Tesuque | 22.8% | 18.8%(+3.92)#43 | 20.4%(+2.39)#5,201 |
| 44. | Cedar Hill | 22.7% | 18.8%(+3.89)#44 | 20.4%(+2.35)#5,232 |
| 45. | Crouch Mesa | 22.7% | 18.8%(+3.87)#45 | 20.4%(+2.33)#5,263 |
| 46. | North Light Plant | 22.6% | 18.8%(+3.76)#46 | 20.4%(+2.22)#5,409 |
| 47. | Eagle Nest | 22.4% | 18.8%(+3.60)#47 | 20.4%(+2.06)#5,592 |
| 48. | Sunland Park | 22.4% | 18.8%(+3.58)#48 | 20.4%(+2.05)#5,613 |
| 49. | Santa Fe | 22.4% | 18.8%(+3.56)#49 | 20.4%(+2.02)#5,653 |
| 50. | Arenas Valley | 22.4% | 18.8%(+3.51)#50 | 20.4%(+1.98)#5,705 |
| 51. | Sheep Springs | 22.1% | 18.8%(+3.24)#51 | 20.4%(+1.71)#6,081 |
| 52. | Las Cruces | 21.9% | 18.8%(+3.04)#52 | 20.4%(+1.50)#6,395 |
| 53. | Highland Meadows | 21.6% | 18.8%(+2.80)#53 | 20.4%(+1.27)#6,716 |
| 54. | Albuquerque | 21.4% | 18.8%(+2.54)#54 | 20.4%(+1.01)#7,094 |
| 55. | Anthony | 21.3% | 18.8%(+2.48)#55 | 20.4%(+0.948)#7,191 |
| 56. | Meadow Lake | 21.2% | 18.8%(+2.38)#56 | 20.4%(+0.848)#7,363 |
| 57. | Sunlit Hills | 21.1% | 18.8%(+2.23)#57 | 20.4%(+0.694)#7,614 |
| 58. | Radium Springs | 21.1% | 18.8%(+2.23)#58 | 20.4%(+0.693)#7,616 |
| 59. | Las Maravillas | 21.0% | 18.8%(+2.19)#59 | 20.4%(+0.660)#7,670 |
| 60. | Clovis | 20.7% | 18.8%(+1.90)#60 | 20.4%(+0.371)#8,148 |
| 61. | Cañoncito | 20.7% | 18.8%(+1.87)#61 | 20.4%(+0.336)#8,205 |
| 62. | Aztec | 20.7% | 18.8%(+1.86)#62 | 20.4%(+0.329)#8,215 |
| 63. | Milan | 20.6% | 18.8%(+1.78)#63 | 20.4%(+0.243)#8,381 |
| 64. | Los Ranchos De Albuquerque | 20.6% | 18.8%(+1.74)#64 | 20.4%(+0.207)#8,459 |
| 65. | Lee Acres | 20.6% | 18.8%(+1.73)#65 | 20.4%(+0.200)#8,474 |
| 66. | Cimarron | 20.5% | 18.8%(+1.71)#66 | 20.4%(+0.172)#8,504 |
| 67. | Farmington | 20.5% | 18.8%(+1.70)#67 | 20.4%(+0.169)#8,512 |
| 68. | Santa Teresa | 20.5% | 18.8%(+1.67)#68 | 20.4%(+0.139)#8,571 |
| 69. | Cliff | 20.3% | 18.8%(+1.43)#69 | 20.4%(-0.109)#9,017 |
| 70. | Ranchos De Taos | 20.2% | 18.8%(+1.35)#70 | 20.4%(-0.182)#9,165 |
| 71. | El Cerro Mission | 20.1% | 18.8%(+1.25)#71 | 20.4%(-0.280)#9,339 |
| 72. | Portales | 20.0% | 18.8%(+1.19)#72 | 20.4%(-0.348)#9,469 |
| 73. | Cedro | 20.0% | 18.8%(+1.16)#73 | 20.4%(-0.378)#9,519 |
| 74. | Las Vegas | 20.0% | 18.8%(+1.15)#74 | 20.4%(-0.385)#9,527 |
| 75. | Santa Cruz | 20.0% | 18.8%(+1.15)#75 | 20.4%(-0.385)#9,530 |
| 76. | Belen | 20.0% | 18.8%(+1.12)#76 | 20.4%(-0.416)#9,586 |
| 77. | Dona Ana | 20.0% | 18.8%(+1.11)#77 | 20.4%(-0.424)#9,605 |
| 78. | Los Lunas | 19.9% | 18.8%(+1.09)#78 | 20.4%(-0.443)#9,635 |
| 79. | Hyde Park | 19.9% | 18.8%(+1.07)#79 | 20.4%(-0.463)#9,670 |
| 80. | Bloomfield | 19.9% | 18.8%(+1.01)#80 | 20.4%(-0.522)#9,777 |
| 81. | Vaughn | 19.8% | 18.8%(+0.918)#81 | 20.4%(-0.616)#9,973 |
| 82. | Paradise Hills | 19.7% | 18.8%(+0.876)#82 | 20.4%(-0.658)#10,051 |
| 83. | Angustura | 19.7% | 18.8%(+0.843)#83 | 20.4%(-0.691)#10,114 |
| 84. | Berino | 19.7% | 18.8%(+0.829)#84 | 20.4%(-0.706)#10,145 |
| 85. | Eldorado At Santa Fe | 19.7% | 18.8%(+0.812)#85 | 20.4%(-0.722)#10,175 |
| 86. | Algodones | 19.6% | 18.8%(+0.744)#86 | 20.4%(-0.790)#10,314 |
| 87. | Napi Headquarters | 19.6% | 18.8%(+0.732)#87 | 20.4%(-0.802)#10,343 |
| 88. | Raton | 19.6% | 18.8%(+0.729)#88 | 20.4%(-0.805)#10,351 |
| 89. | Carrizozo | 19.5% | 18.8%(+0.692)#89 | 20.4%(-0.842)#10,445 |
| 90. | Rio Rancho | 19.5% | 18.8%(+0.653)#90 | 20.4%(-0.881)#10,527 |
| 91. | Corona | 19.3% | 18.8%(+0.444)#91 | 20.4%(-1.09)#10,943 |
| 92. | Alamogordo | 19.3% | 18.8%(+0.417)#92 | 20.4%(-1.12)#10,998 |
| 93. | Mimbres | 19.2% | 18.8%(+0.352)#93 | 20.4%(-1.18)#11,214 |
| 94. | Deming | 19.0% | 18.8%(+0.117)#94 | 20.4%(-1.42)#11,680 |
| 95. | La Plata | 19.0% | 18.8%(+0.112)#95 | 20.4%(-1.42)#11,691 |
| 96. | Edgewood | 18.9% | 18.8%(+0.085)#96 | 20.4%(-1.45)#11,739 |
| 97. | Roswell | 18.9% | 18.8%(+0.066)#97 | 20.4%(-1.47)#11,781 |
| 98. | Angel Fire | 18.7% | 18.8%(-0.094)#98 | 20.4%(-1.63)#12,107 |
| 99. | Tyrone | 18.6% | 18.8%(-0.203)#99 | 20.4%(-1.74)#12,348 |
| 100. | South Acomita Village | 18.6% | 18.8%(-0.231)#100 | 20.4%(-1.77)#12,406 |
Common Questions
What are the Top 10 Cities with the Highest Costs of Housing as Percentage of Income in New Mexico?
Top 10 Cities with the Highest Costs of Housing as Percentage of Income in New Mexico are:
#1
76.3%
#2
57.5%
#3
53.2%
#4
47.5%
#5
43.5%
#6
40.4%
#7
39.3%
#8
37.7%
#9
36.6%
#10
36.0%
What city has the Highest Costs of Housing as Percentage of Income in New Mexico?
Pajarito Mesa has the Highest Costs of Housing as Percentage of Income in New Mexico with 76.3%.
What is the Average Housing Costs as Percentage of Income in the State of New Mexico?
Average Housing Costs as Percentage of Income in New Mexico is 18.8%.
What is the Average Housing Costs as Percentage of Income in the United States?
Average Housing Costs as Percentage of Income in the United States is 20.4%.