Cities with the Highest Costs of Housing as Percentage of Income in New Hampshire
RELATED REPORTS & OPTIONS
Highest Housing Costs / Income
New Hampshire
Compare Cities
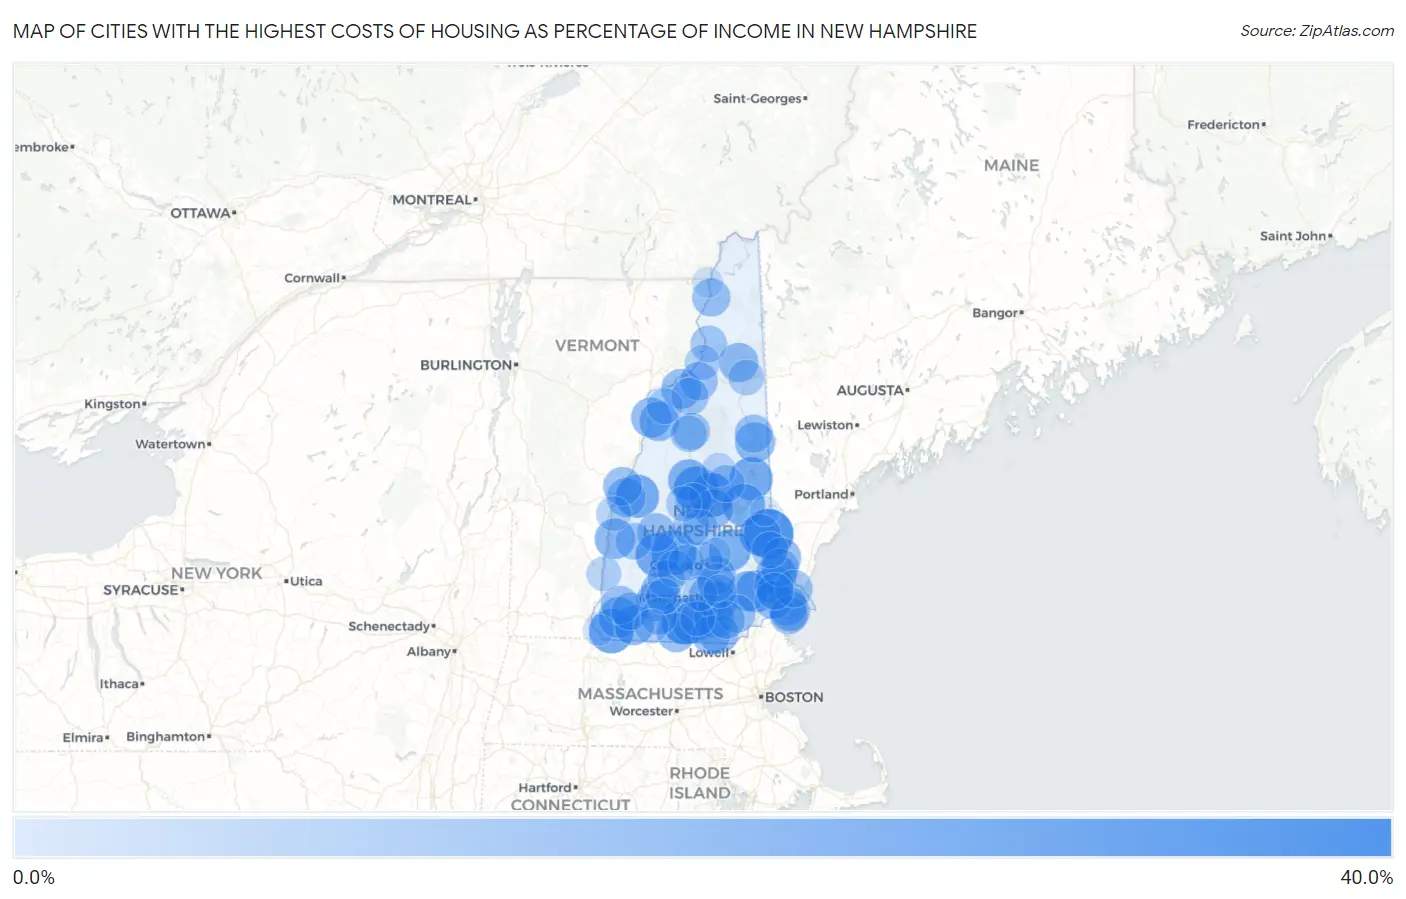
Map of Cities with the Highest Costs of Housing as Percentage of Income in New Hampshire
0.0%
40.0%
Cities with the Highest Costs of Housing as Percentage of Income in New Hampshire
| City | Housing Costs / Income | vs State | vs National | |
| 1. | Milton | 39.2% | 20.6%(+18.6)#1 | 20.4%(+18.8)#214 |
| 2. | Wilton | 34.6% | 20.6%(+14.0)#2 | 20.4%(+14.2)#430 |
| 3. | Warner | 32.0% | 20.6%(+11.3)#3 | 20.4%(+11.6)#669 |
| 4. | Ashland | 31.9% | 20.6%(+11.3)#4 | 20.4%(+11.5)#671 |
| 5. | Meredith | 31.4% | 20.6%(+10.8)#5 | 20.4%(+11.1)#732 |
| 6. | Winchester | 31.2% | 20.6%(+10.6)#6 | 20.4%(+10.8)#763 |
| 7. | Bradford | 30.7% | 20.6%(+10.1)#7 | 20.4%(+10.3)#846 |
| 8. | Enfield | 29.7% | 20.6%(+9.04)#8 | 20.4%(+9.29)#1,036 |
| 9. | Center Ossipee | 29.3% | 20.6%(+8.70)#9 | 20.4%(+8.94)#1,109 |
| 10. | Wolfeboro | 28.3% | 20.6%(+7.71)#10 | 20.4%(+7.96)#1,379 |
| 11. | Pittsfield | 27.8% | 20.6%(+7.17)#11 | 20.4%(+7.42)#1,587 |
| 12. | Epping | 27.6% | 20.6%(+6.97)#12 | 20.4%(+7.22)#1,649 |
| 13. | Farmington | 27.1% | 20.6%(+6.49)#13 | 20.4%(+6.73)#1,840 |
| 14. | Milford | 27.1% | 20.6%(+6.48)#14 | 20.4%(+6.73)#1,844 |
| 15. | Plymouth | 26.9% | 20.6%(+6.32)#15 | 20.4%(+6.57)#1,916 |
| 16. | West Swanzey | 26.1% | 20.6%(+5.49)#16 | 20.4%(+5.74)#2,334 |
| 17. | Durham | 25.8% | 20.6%(+5.14)#17 | 20.4%(+5.38)#2,550 |
| 18. | Claremont | 25.7% | 20.6%(+5.10)#18 | 20.4%(+5.35)#2,582 |
| 19. | Hancock | 25.2% | 20.6%(+4.55)#19 | 20.4%(+4.79)#2,934 |
| 20. | Troy | 25.0% | 20.6%(+4.38)#20 | 20.4%(+4.63)#3,047 |
| 21. | Conway | 25.0% | 20.6%(+4.37)#21 | 20.4%(+4.61)#3,058 |
| 22. | Woodsville | 24.9% | 20.6%(+4.24)#22 | 20.4%(+4.49)#3,172 |
| 23. | Raymond | 24.8% | 20.6%(+4.22)#23 | 20.4%(+4.46)#3,186 |
| 24. | Littleton | 24.6% | 20.6%(+3.98)#24 | 20.4%(+4.23)#3,367 |
| 25. | Hampton Beach | 24.5% | 20.6%(+3.91)#25 | 20.4%(+4.16)#3,414 |
| 26. | Pinardville | 24.3% | 20.6%(+3.68)#26 | 20.4%(+3.93)#3,618 |
| 27. | Somersworth | 24.3% | 20.6%(+3.68)#27 | 20.4%(+3.93)#3,621 |
| 28. | Mountain Lakes | 24.2% | 20.6%(+3.60)#28 | 20.4%(+3.84)#3,686 |
| 29. | East Merrimack | 23.9% | 20.6%(+3.31)#29 | 20.4%(+3.55)#3,922 |
| 30. | Manchester | 23.8% | 20.6%(+3.14)#30 | 20.4%(+3.38)#4,091 |
| 31. | Hudson | 23.7% | 20.6%(+3.10)#31 | 20.4%(+3.34)#4,136 |
| 32. | Berlin | 23.6% | 20.6%(+2.95)#32 | 20.4%(+3.20)#4,290 |
| 33. | Hampton | 23.5% | 20.6%(+2.91)#33 | 20.4%(+3.16)#4,330 |
| 34. | Laconia | 23.4% | 20.6%(+2.74)#34 | 20.4%(+2.99)#4,501 |
| 35. | Greenville | 23.4% | 20.6%(+2.73)#35 | 20.4%(+2.98)#4,515 |
| 36. | Newmarket | 23.3% | 20.6%(+2.72)#36 | 20.4%(+2.96)#4,539 |
| 37. | Lebanon | 23.2% | 20.6%(+2.60)#37 | 20.4%(+2.84)#4,647 |
| 38. | Suncook | 22.9% | 20.6%(+2.26)#38 | 20.4%(+2.51)#5,046 |
| 39. | Nashua | 22.7% | 20.6%(+2.11)#39 | 20.4%(+2.35)#5,236 |
| 40. | Hanover | 22.7% | 20.6%(+2.09)#40 | 20.4%(+2.34)#5,252 |
| 41. | Antrim | 22.6% | 20.6%(+2.00)#41 | 20.4%(+2.25)#5,380 |
| 42. | Exeter | 22.6% | 20.6%(+1.93)#42 | 20.4%(+2.18)#5,466 |
| 43. | New London | 22.5% | 20.6%(+1.92)#43 | 20.4%(+2.16)#5,481 |
| 44. | Derry | 22.3% | 20.6%(+1.65)#44 | 20.4%(+1.89)#5,815 |
| 45. | Colebrook | 22.1% | 20.6%(+1.52)#45 | 20.4%(+1.76)#6,004 |
| 46. | Concord | 22.1% | 20.6%(+1.45)#46 | 20.4%(+1.69)#6,117 |
| 47. | Seabrook Beach | 21.9% | 20.6%(+1.26)#47 | 20.4%(+1.50)#6,396 |
| 48. | Hooksett | 21.9% | 20.6%(+1.24)#48 | 20.4%(+1.48)#6,418 |
| 49. | Keene | 21.8% | 20.6%(+1.22)#49 | 20.4%(+1.47)#6,438 |
| 50. | Dover | 21.8% | 20.6%(+1.22)#50 | 20.4%(+1.46)#6,454 |
| 51. | North Conway | 21.8% | 20.6%(+1.17)#51 | 20.4%(+1.41)#6,509 |
| 52. | Whitefield | 21.6% | 20.6%(+1.01)#52 | 20.4%(+1.26)#6,725 |
| 53. | Portsmouth | 21.3% | 20.6%(+0.716)#53 | 20.4%(+0.960)#7,169 |
| 54. | Londonderry | 21.3% | 20.6%(+0.663)#54 | 20.4%(+0.907)#7,264 |
| 55. | Marlborough | 21.1% | 20.6%(+0.464)#55 | 20.4%(+0.708)#7,581 |
| 56. | Hillsborough | 20.7% | 20.6%(+0.052)#56 | 20.4%(+0.297)#8,280 |
| 57. | Bethlehem | 20.6% | 20.6%(+0.029)#57 | 20.4%(+0.274)#8,316 |
| 58. | Lincoln | 20.6% | 20.6%(+0.025)#58 | 20.4%(+0.270)#8,326 |
| 59. | Newfields | 20.6% | 20.6%(-0.040)#59 | 20.4%(+0.204)#8,462 |
| 60. | Franklin | 20.5% | 20.6%(-0.112)#60 | 20.4%(+0.132)#8,590 |
| 61. | Peterborough | 20.2% | 20.6%(-0.397)#61 | 20.4%(-0.153)#9,105 |
| 62. | Suissevale | 20.1% | 20.6%(-0.537)#62 | 20.4%(-0.293)#9,362 |
| 63. | Newport | 19.8% | 20.6%(-0.780)#63 | 20.4%(-0.536)#9,807 |
| 64. | Rochester | 19.8% | 20.6%(-0.845)#64 | 20.4%(-0.600)#9,942 |
| 65. | New Hampton | 19.7% | 20.6%(-0.914)#65 | 20.4%(-0.669)#10,072 |
| 66. | Henniker | 19.7% | 20.6%(-0.970)#66 | 20.4%(-0.725)#10,181 |
| 67. | North Woodstock | 19.6% | 20.6%(-1.06)#67 | 20.4%(-0.816)#10,378 |
| 68. | Groveton | 19.5% | 20.6%(-1.15)#68 | 20.4%(-0.906)#10,580 |
| 69. | Bennington | 18.7% | 20.6%(-1.88)#69 | 20.4%(-1.64)#12,126 |
| 70. | Lisbon | 18.7% | 20.6%(-1.93)#70 | 20.4%(-1.69)#12,235 |
| 71. | Tilton Northfield | 18.7% | 20.6%(-1.95)#71 | 20.4%(-1.70)#12,271 |
| 72. | Contoocook | 18.7% | 20.6%(-1.97)#72 | 20.4%(-1.72)#12,315 |
| 73. | Gorham | 18.1% | 20.6%(-2.48)#73 | 20.4%(-2.24)#13,511 |
| 74. | Bristol | 17.9% | 20.6%(-2.75)#74 | 20.4%(-2.51)#14,111 |
| 75. | Lancaster | 17.7% | 20.6%(-2.89)#75 | 20.4%(-2.64)#14,407 |
| 76. | Amherst | 17.2% | 20.6%(-3.39)#76 | 20.4%(-3.15)#15,529 |
| 77. | Plainfield | 17.2% | 20.6%(-3.45)#77 | 20.4%(-3.21)#15,659 |
| 78. | North Walpole | 16.9% | 20.6%(-3.77)#78 | 20.4%(-3.52)#16,358 |
| 79. | Goffstown | 16.8% | 20.6%(-3.78)#79 | 20.4%(-3.54)#16,402 |
| 80. | Jaffrey | 16.3% | 20.6%(-4.33)#80 | 20.4%(-4.08)#17,599 |
| 81. | Center Sandwich | 15.8% | 20.6%(-4.80)#81 | 20.4%(-4.56)#18,641 |
| 82. | South Hooksett | 15.2% | 20.6%(-5.46)#82 | 20.4%(-5.21)#19,943 |
| 83. | Loudon | 13.4% | 20.6%(-7.25)#83 | 20.4%(-7.00)#22,923 |
| 84. | New Boston | 12.6% | 20.6%(-8.04)#84 | 20.4%(-7.80)#23,958 |
| 85. | Hinsdale | 12.5% | 20.6%(-8.10)#85 | 20.4%(-7.86)#24,028 |
| 86. | Francestown | 12.4% | 20.6%(-8.18)#86 | 20.4%(-7.94)#24,126 |
| 87. | West Stewartstown | 11.4% | 20.6%(-9.25)#87 | 20.4%(-9.01)#25,245 |
| 88. | Sanbornville | 9.9% | 20.6%(-10.7)#88 | 20.4%(-10.4)#26,255 |
1
Common Questions
What are the Top 10 Cities with the Highest Costs of Housing as Percentage of Income in New Hampshire?
Top 10 Cities with the Highest Costs of Housing as Percentage of Income in New Hampshire are:
#1
39.2%
#2
34.6%
#3
32.0%
#4
31.9%
#5
31.4%
#6
31.2%
#7
30.7%
#8
29.7%
#9
29.3%
#10
28.3%
What city has the Highest Costs of Housing as Percentage of Income in New Hampshire?
Milton has the Highest Costs of Housing as Percentage of Income in New Hampshire with 39.2%.
What is the Average Housing Costs as Percentage of Income in the State of New Hampshire?
Average Housing Costs as Percentage of Income in New Hampshire is 20.6%.
What is the Average Housing Costs as Percentage of Income in the United States?
Average Housing Costs as Percentage of Income in the United States is 20.4%.