Cities with the Highest Costs of Housing as Percentage of Income in Pennsylvania
RELATED REPORTS & OPTIONS
Highest Housing Costs / Income
Pennsylvania
Compare Cities
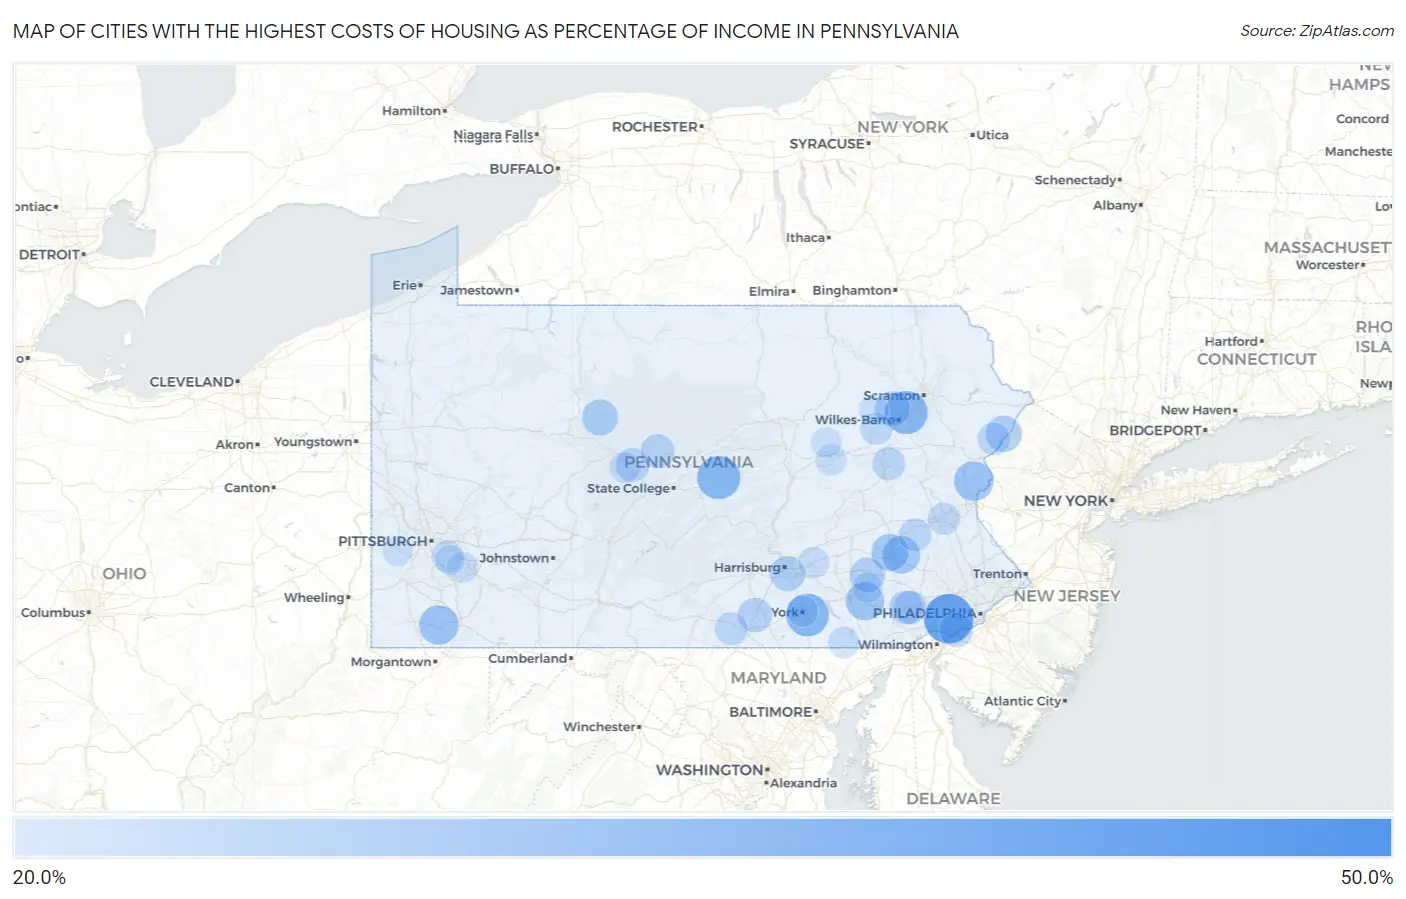
Map of Cities with the Highest Costs of Housing as Percentage of Income in Pennsylvania
0.0%
50.0%
Cities with the Highest Costs of Housing as Percentage of Income in Pennsylvania
| City | Housing Costs / Income | vs State | vs National | |
| 1. | Valencia Borough | 47.5% | 18.6%(+28.8)#1 | 20.4%(+27.1)#92 |
| 2. | Lima | 42.8% | 18.6%(+24.2)#2 | 20.4%(+22.4)#142 |
| 3. | St. Clair | 38.3% | 18.6%(+19.6)#3 | 20.4%(+17.9)#237 |
| 4. | Coburn | 37.0% | 18.6%(+18.4)#4 | 20.4%(+16.6)#297 |
| 5. | Inkerman | 36.9% | 18.6%(+18.3)#5 | 20.4%(+16.5)#302 |
| 6. | Queens Gate | 36.7% | 18.6%(+18.0)#6 | 20.4%(+16.3)#313 |
| 7. | Eagle | 35.9% | 18.6%(+17.2)#7 | 20.4%(+15.5)#357 |
| 8. | Cove Forge | 34.8% | 18.6%(+16.2)#8 | 20.4%(+14.4)#418 |
| 9. | Ackermanville | 33.7% | 18.6%(+15.1)#9 | 20.4%(+13.3)#498 |
| 10. | Nemacolin | 33.5% | 18.6%(+14.9)#10 | 20.4%(+13.1)#509 |
| 11. | State College Borough | 33.2% | 18.6%(+14.6)#11 | 20.4%(+12.8)#531 |
| 12. | Coalmont Borough | 33.2% | 18.6%(+14.5)#12 | 20.4%(+12.8)#538 |
| 13. | Ohiopyle Borough | 32.9% | 18.6%(+14.3)#13 | 20.4%(+12.5)#568 |
| 14. | Homestead Borough | 32.8% | 18.6%(+14.2)#14 | 20.4%(+12.4)#581 |
| 15. | Homewood At Martinsburg | 32.7% | 18.6%(+14.1)#15 | 20.4%(+12.4)#589 |
| 16. | Bird In Hand | 32.7% | 18.6%(+14.0)#16 | 20.4%(+12.3)#595 |
| 17. | Stony Creek Mills | 32.2% | 18.6%(+13.6)#17 | 20.4%(+11.8)#642 |
| 18. | Macungie Borough | 32.1% | 18.6%(+13.5)#18 | 20.4%(+11.7)#652 |
| 19. | Greenfields | 31.6% | 18.6%(+13.0)#19 | 20.4%(+11.2)#713 |
| 20. | Braddock Borough | 31.1% | 18.6%(+12.5)#20 | 20.4%(+10.8)#777 |
| 21. | Honesdale Borough | 31.1% | 18.6%(+12.5)#21 | 20.4%(+10.7)#779 |
| 22. | Nazareth Borough | 31.1% | 18.6%(+12.4)#22 | 20.4%(+10.7)#790 |
| 23. | Lanesboro Borough | 30.8% | 18.6%(+12.2)#23 | 20.4%(+10.5)#824 |
| 24. | Pocono Mountain Lake Estates | 30.8% | 18.6%(+12.2)#24 | 20.4%(+10.4)#830 |
| 25. | Force | 30.8% | 18.6%(+12.1)#25 | 20.4%(+10.4)#834 |
| 26. | Railroad Borough | 30.7% | 18.6%(+12.1)#26 | 20.4%(+10.3)#847 |
| 27. | Kutztown Borough | 30.4% | 18.6%(+11.8)#27 | 20.4%(+10.1)#895 |
| 28. | Darby Borough | 30.3% | 18.6%(+11.6)#28 | 20.4%(+9.89)#916 |
| 29. | Fountain Hill Borough | 30.1% | 18.6%(+11.5)#29 | 20.4%(+9.75)#947 |
| 30. | East Lansdowne Borough | 30.0% | 18.6%(+11.4)#30 | 20.4%(+9.64)#971 |
| 31. | Shavertown | 30.0% | 18.6%(+11.3)#31 | 20.4%(+9.59)#982 |
| 32. | New Market | 29.9% | 18.6%(+11.3)#32 | 20.4%(+9.55)#992 |
| 33. | Stevens | 29.8% | 18.6%(+11.2)#33 | 20.4%(+9.41)#1,012 |
| 34. | Heidlersburg | 29.3% | 18.6%(+10.6)#34 | 20.4%(+8.88)#1,128 |
| 35. | Coal Center Borough | 29.1% | 18.6%(+10.4)#35 | 20.4%(+8.69)#1,172 |
| 36. | Coatesville | 29.0% | 18.6%(+10.4)#36 | 20.4%(+8.64)#1,180 |
| 37. | Moshannon | 29.0% | 18.6%(+10.4)#37 | 20.4%(+8.62)#1,188 |
| 38. | Chester | 28.8% | 18.6%(+10.2)#38 | 20.4%(+8.44)#1,230 |
| 39. | Morrisdale | 28.6% | 18.6%(+10.00)#39 | 20.4%(+8.25)#1,288 |
| 40. | Cross Keys | 28.5% | 18.6%(+9.90)#40 | 20.4%(+8.16)#1,311 |
| 41. | Benton Borough | 28.5% | 18.6%(+9.87)#41 | 20.4%(+8.13)#1,317 |
| 42. | Collingdale Borough | 28.5% | 18.6%(+9.84)#42 | 20.4%(+8.10)#1,332 |
| 43. | Caln | 28.3% | 18.6%(+9.67)#43 | 20.4%(+7.92)#1,391 |
| 44. | Mcconnellsburg Borough | 28.2% | 18.6%(+9.52)#44 | 20.4%(+7.78)#1,435 |
| 45. | Edinboro Borough | 28.1% | 18.6%(+9.51)#45 | 20.4%(+7.77)#1,438 |
| 46. | Colwyn Borough | 28.1% | 18.6%(+9.50)#46 | 20.4%(+7.76)#1,444 |
| 47. | Bowers | 28.0% | 18.6%(+9.42)#47 | 20.4%(+7.67)#1,471 |
| 48. | Hazleton | 28.0% | 18.6%(+9.42)#48 | 20.4%(+7.67)#1,472 |
| 49. | East Stroudsburg Borough | 28.0% | 18.6%(+9.41)#49 | 20.4%(+7.66)#1,475 |
| 50. | Rainsburg Borough | 28.0% | 18.6%(+9.34)#50 | 20.4%(+7.59)#1,507 |
| 51. | Orrtanna | 27.9% | 18.6%(+9.24)#51 | 20.4%(+7.50)#1,552 |
| 52. | Slatington Borough | 27.7% | 18.6%(+9.11)#52 | 20.4%(+7.36)#1,610 |
| 53. | Saw Creek | 27.7% | 18.6%(+9.05)#53 | 20.4%(+7.30)#1,623 |
| 54. | Edwardsville Borough | 27.6% | 18.6%(+8.97)#54 | 20.4%(+7.23)#1,646 |
| 55. | Mount Oliver Borough | 27.4% | 18.6%(+8.81)#55 | 20.4%(+7.07)#1,707 |
| 56. | Glen Lyon | 27.3% | 18.6%(+8.71)#56 | 20.4%(+6.96)#1,744 |
| 57. | Pleasantville Borough Bedford County | 27.3% | 18.6%(+8.65)#57 | 20.4%(+6.91)#1,769 |
| 58. | Allentown | 27.2% | 18.6%(+8.57)#58 | 20.4%(+6.83)#1,802 |
| 59. | Norristown Borough | 27.2% | 18.6%(+8.57)#59 | 20.4%(+6.83)#1,803 |
| 60. | Stroudsburg Borough | 27.1% | 18.6%(+8.45)#60 | 20.4%(+6.70)#1,859 |
| 61. | Braddock Hills Borough | 27.1% | 18.6%(+8.43)#61 | 20.4%(+6.69)#1,864 |
| 62. | Mckeesport | 27.0% | 18.6%(+8.38)#62 | 20.4%(+6.63)#1,893 |
| 63. | Clifton Heights Borough | 26.9% | 18.6%(+8.25)#63 | 20.4%(+6.51)#1,946 |
| 64. | South Coatesville Borough | 26.9% | 18.6%(+8.23)#64 | 20.4%(+6.49)#1,960 |
| 65. | Folcroft Borough | 26.9% | 18.6%(+8.23)#65 | 20.4%(+6.48)#1,962 |
| 66. | Renovo Borough | 26.8% | 18.6%(+8.21)#66 | 20.4%(+6.46)#1,974 |
| 67. | Susquehanna Trails | 26.8% | 18.6%(+8.16)#67 | 20.4%(+6.42)#1,992 |
| 68. | Marcus Hook Borough | 26.7% | 18.6%(+8.07)#68 | 20.4%(+6.33)#2,044 |
| 69. | Brownsville Borough | 26.7% | 18.6%(+8.04)#69 | 20.4%(+6.30)#2,059 |
| 70. | Hayti | 26.6% | 18.6%(+7.96)#70 | 20.4%(+6.21)#2,094 |
| 71. | Morton Borough | 26.6% | 18.6%(+7.94)#71 | 20.4%(+6.19)#2,108 |
| 72. | Ashley Borough | 26.5% | 18.6%(+7.92)#72 | 20.4%(+6.17)#2,119 |
| 73. | Oxford Borough | 26.4% | 18.6%(+7.79)#73 | 20.4%(+6.05)#2,179 |
| 74. | York | 26.4% | 18.6%(+7.78)#74 | 20.4%(+6.03)#2,187 |
| 75. | Palmdale | 26.4% | 18.6%(+7.77)#75 | 20.4%(+6.03)#2,189 |
| 76. | West Decatur | 26.4% | 18.6%(+7.77)#76 | 20.4%(+6.02)#2,192 |
| 77. | Henrietta | 26.4% | 18.6%(+7.77)#77 | 20.4%(+6.02)#2,194 |
| 78. | Rupert | 26.4% | 18.6%(+7.75)#78 | 20.4%(+6.01)#2,204 |
| 79. | Eagles Mere Borough | 26.3% | 18.6%(+7.71)#79 | 20.4%(+5.97)#2,216 |
| 80. | Herminie | 26.2% | 18.6%(+7.61)#80 | 20.4%(+5.86)#2,271 |
| 81. | Mckees Rocks Borough | 26.2% | 18.6%(+7.55)#81 | 20.4%(+5.81)#2,297 |
| 82. | Chester Heights Borough | 26.1% | 18.6%(+7.51)#82 | 20.4%(+5.76)#2,315 |
| 83. | Middletown Borough | 26.0% | 18.6%(+7.41)#83 | 20.4%(+5.66)#2,369 |
| 84. | Eyers Grove | 26.0% | 18.6%(+7.39)#84 | 20.4%(+5.65)#2,385 |
| 85. | Spring Drive Mobile Home Park | 26.0% | 18.6%(+7.35)#85 | 20.4%(+5.61)#2,410 |
| 86. | Farmersville | 26.0% | 18.6%(+7.32)#86 | 20.4%(+5.58)#2,431 |
| 87. | Bath Borough | 25.9% | 18.6%(+7.26)#87 | 20.4%(+5.52)#2,467 |
| 88. | Portland Borough | 25.8% | 18.6%(+7.21)#88 | 20.4%(+5.47)#2,501 |
| 89. | West Chester Borough | 25.8% | 18.6%(+7.18)#89 | 20.4%(+5.44)#2,521 |
| 90. | Midway | 25.8% | 18.6%(+7.13)#90 | 20.4%(+5.38)#2,553 |
| 91. | Rosemont | 25.7% | 18.6%(+7.08)#91 | 20.4%(+5.33)#2,586 |
| 92. | Boyertown Borough | 25.7% | 18.6%(+7.05)#92 | 20.4%(+5.30)#2,606 |
| 93. | Wilmerding Borough | 25.7% | 18.6%(+7.02)#93 | 20.4%(+5.28)#2,622 |
| 94. | Kennett Square Borough | 25.6% | 18.6%(+6.99)#94 | 20.4%(+5.25)#2,639 |
| 95. | Bristol Borough | 25.6% | 18.6%(+6.99)#95 | 20.4%(+5.24)#2,644 |
| 96. | Telford Borough | 25.6% | 18.6%(+6.98)#96 | 20.4%(+5.23)#2,658 |
| 97. | Pikes Creek | 25.6% | 18.6%(+6.95)#97 | 20.4%(+5.20)#2,676 |
| 98. | Wernersville Borough | 25.6% | 18.6%(+6.93)#98 | 20.4%(+5.18)#2,685 |
| 99. | Orrstown Borough | 25.6% | 18.6%(+6.92)#99 | 20.4%(+5.18)#2,688 |
| 100. | Boston | 25.5% | 18.6%(+6.90)#100 | 20.4%(+5.15)#2,703 |
Common Questions
What are the Top 10 Cities with the Highest Costs of Housing as Percentage of Income in Pennsylvania?
Top 10 Cities with the Highest Costs of Housing as Percentage of Income in Pennsylvania are:
#1
42.8%
#2
37.0%
#3
36.9%
#4
36.7%
#5
33.7%
#6
33.5%
#7
32.7%
#8
32.2%
#9
31.6%
#10
30.8%
What city has the Highest Costs of Housing as Percentage of Income in Pennsylvania?
Lima has the Highest Costs of Housing as Percentage of Income in Pennsylvania with 42.8%.
What is the Average Housing Costs as Percentage of Income in the State of Pennsylvania?
Average Housing Costs as Percentage of Income in Pennsylvania is 18.6%.
What is the Average Housing Costs as Percentage of Income in the United States?
Average Housing Costs as Percentage of Income in the United States is 20.4%.