Cities with the Highest Costs of Housing as Percentage of Income in Missouri
RELATED REPORTS & OPTIONS
Highest Housing Costs / Income
Missouri
Compare Cities
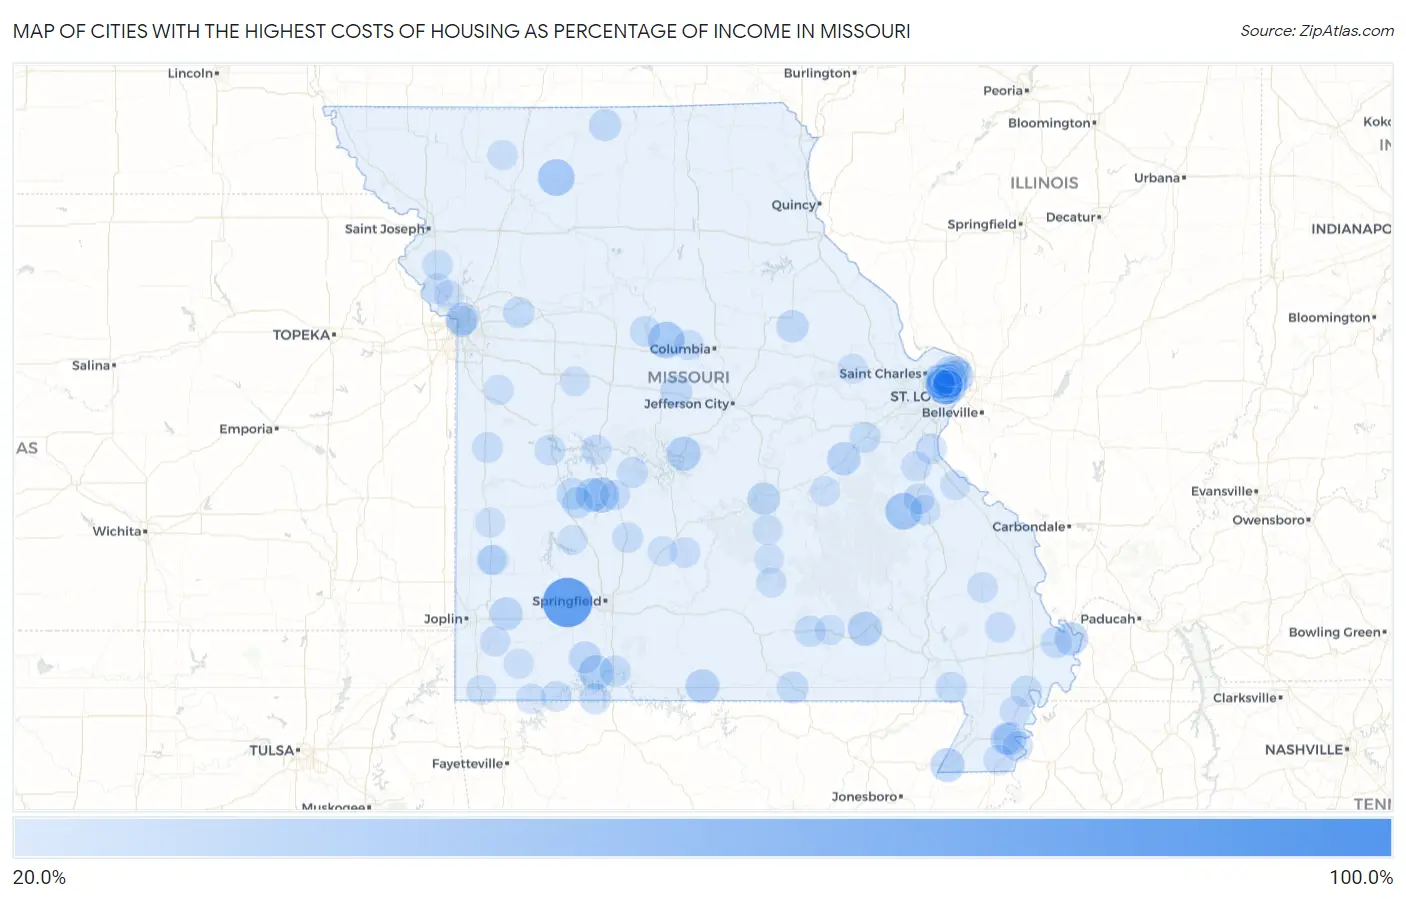
Map of Cities with the Highest Costs of Housing as Percentage of Income in Missouri
0.0%
100.0%
Cities with the Highest Costs of Housing as Percentage of Income in Missouri
| City | Housing Costs / Income | vs State | vs National | |
| 1. | Tarsney Lakes | 100.0% | 18.1%(+81.9)#1 | 20.4%(+79.6)#9 |
| 2. | Halltown | 86.6% | 18.1%(+68.5)#2 | 20.4%(+66.2)#20 |
| 3. | Irondale | 45.4% | 18.1%(+27.3)#3 | 20.4%(+25.0)#108 |
| 4. | Leisure Lake | 44.4% | 18.1%(+26.4)#4 | 20.4%(+24.1)#119 |
| 5. | Franklin | 44.3% | 18.1%(+26.2)#5 | 20.4%(+23.9)#125 |
| 6. | Greendale | 42.8% | 18.1%(+24.7)#6 | 20.4%(+22.4)#141 |
| 7. | Pine Lawn | 40.9% | 18.1%(+22.8)#7 | 20.4%(+20.5)#171 |
| 8. | Hermitage | 40.6% | 18.1%(+22.5)#8 | 20.4%(+20.2)#177 |
| 9. | Flordell Hills | 39.7% | 18.1%(+21.6)#9 | 20.4%(+19.3)#202 |
| 10. | Branson West | 38.0% | 18.1%(+19.9)#10 | 20.4%(+17.6)#249 |
| 11. | Van Buren | 37.2% | 18.1%(+19.1)#11 | 20.4%(+16.8)#291 |
| 12. | Bagnell | 36.7% | 18.1%(+18.6)#12 | 20.4%(+16.3)#316 |
| 13. | Cardwell | 36.2% | 18.1%(+18.2)#13 | 20.4%(+15.9)#338 |
| 14. | Wheatland | 36.0% | 18.1%(+18.0)#14 | 20.4%(+15.7)#346 |
| 15. | Gainesville | 35.9% | 18.1%(+17.8)#15 | 20.4%(+15.5)#359 |
| 16. | Normandy | 35.3% | 18.1%(+17.2)#16 | 20.4%(+14.9)#383 |
| 17. | West Sullivan | 34.4% | 18.1%(+16.4)#17 | 20.4%(+14.1)#441 |
| 18. | Wyatt | 34.3% | 18.1%(+16.2)#18 | 20.4%(+13.9)#450 |
| 19. | Hayti | 33.3% | 18.1%(+15.3)#19 | 20.4%(+13.0)#520 |
| 20. | Hillsdale | 32.7% | 18.1%(+14.6)#20 | 20.4%(+12.3)#591 |
| 21. | Reeds | 32.6% | 18.1%(+14.6)#21 | 20.4%(+12.3)#598 |
| 22. | Castle Point | 32.4% | 18.1%(+14.3)#22 | 20.4%(+12.0)#619 |
| 23. | Newburg | 32.4% | 18.1%(+14.3)#23 | 20.4%(+12.0)#623 |
| 24. | Iantha | 32.3% | 18.1%(+14.2)#24 | 20.4%(+11.9)#630 |
| 25. | Avondale | 32.3% | 18.1%(+14.2)#25 | 20.4%(+11.9)#640 |
| 26. | Jennings | 31.9% | 18.1%(+13.8)#26 | 20.4%(+11.5)#683 |
| 27. | Glasgow Village | 31.8% | 18.1%(+13.7)#27 | 20.4%(+11.4)#687 |
| 28. | Bel Ridge | 31.2% | 18.1%(+13.1)#28 | 20.4%(+10.8)#761 |
| 29. | Galena | 31.2% | 18.1%(+13.1)#29 | 20.4%(+10.8)#767 |
| 30. | Martinsburg | 31.2% | 18.1%(+13.1)#30 | 20.4%(+10.8)#771 |
| 31. | Clarksburg | 30.8% | 18.1%(+12.7)#31 | 20.4%(+10.4)#827 |
| 32. | Lucerne | 30.6% | 18.1%(+12.5)#32 | 20.4%(+10.2)#871 |
| 33. | Berkeley | 30.5% | 18.1%(+12.5)#33 | 20.4%(+10.2)#878 |
| 34. | Hayti Heights | 30.1% | 18.1%(+12.0)#34 | 20.4%(+9.68)#963 |
| 35. | Pagedale | 30.0% | 18.1%(+12.0)#35 | 20.4%(+9.67)#965 |
| 36. | Koshkonong | 29.7% | 18.1%(+11.6)#36 | 20.4%(+9.30)#1,034 |
| 37. | Gerster | 29.7% | 18.1%(+11.6)#37 | 20.4%(+9.30)#1,035 |
| 38. | Howardville | 28.5% | 18.1%(+10.5)#38 | 20.4%(+8.17)#1,308 |
| 39. | Weaubleau | 28.5% | 18.1%(+10.4)#39 | 20.4%(+8.10)#1,328 |
| 40. | Velda Village Hills | 28.5% | 18.1%(+10.4)#40 | 20.4%(+8.10)#1,329 |
| 41. | Bull Creek | 28.5% | 18.1%(+10.4)#41 | 20.4%(+8.10)#1,331 |
| 42. | Charleston | 28.4% | 18.1%(+10.3)#42 | 20.4%(+8.00)#1,361 |
| 43. | North Kansas City | 28.4% | 18.1%(+10.3)#43 | 20.4%(+7.98)#1,370 |
| 44. | Qulin | 28.1% | 18.1%(+10.1)#44 | 20.4%(+7.75)#1,446 |
| 45. | St Clair | 28.0% | 18.1%(+9.89)#45 | 20.4%(+7.59)#1,509 |
| 46. | Blue Eye | 27.8% | 18.1%(+9.74)#46 | 20.4%(+7.45)#1,577 |
| 47. | Birch Tree | 27.6% | 18.1%(+9.53)#47 | 20.4%(+7.23)#1,644 |
| 48. | Fleming | 27.6% | 18.1%(+9.52)#48 | 20.4%(+7.22)#1,648 |
| 49. | Edmundson | 27.5% | 18.1%(+9.44)#49 | 20.4%(+7.14)#1,676 |
| 50. | Climax Springs | 27.1% | 18.1%(+9.03)#50 | 20.4%(+6.73)#1,841 |
| 51. | Horine | 26.9% | 18.1%(+8.84)#51 | 20.4%(+6.54)#1,928 |
| 52. | Butler | 26.7% | 18.1%(+8.64)#52 | 20.4%(+6.34)#2,035 |
| 53. | Deepwater | 26.7% | 18.1%(+8.64)#53 | 20.4%(+6.34)#2,039 |
| 54. | Arrow Rock | 26.7% | 18.1%(+8.60)#54 | 20.4%(+6.30)#2,057 |
| 55. | Bonne Terre | 26.6% | 18.1%(+8.57)#55 | 20.4%(+6.27)#2,069 |
| 56. | Buffalo | 26.6% | 18.1%(+8.53)#56 | 20.4%(+6.23)#2,087 |
| 57. | Wellston | 26.6% | 18.1%(+8.49)#57 | 20.4%(+6.19)#2,109 |
| 58. | Kinloch | 26.4% | 18.1%(+8.35)#58 | 20.4%(+6.05)#2,178 |
| 59. | Chain O Lakes | 26.2% | 18.1%(+8.14)#59 | 20.4%(+5.84)#2,285 |
| 60. | Warsaw | 26.1% | 18.1%(+7.99)#60 | 20.4%(+5.69)#2,349 |
| 61. | Marble Hill | 26.0% | 18.1%(+7.90)#61 | 20.4%(+5.60)#2,418 |
| 62. | Platte City | 26.0% | 18.1%(+7.88)#62 | 20.4%(+5.58)#2,427 |
| 63. | Evergreen | 25.9% | 18.1%(+7.84)#63 | 20.4%(+5.54)#2,450 |
| 64. | Steele | 25.8% | 18.1%(+7.73)#64 | 20.4%(+5.44)#2,523 |
| 65. | Granby | 25.8% | 18.1%(+7.69)#65 | 20.4%(+5.39)#2,547 |
| 66. | Spanish Lake | 25.6% | 18.1%(+7.55)#66 | 20.4%(+5.25)#2,638 |
| 67. | Caruthersville | 25.6% | 18.1%(+7.48)#67 | 20.4%(+5.19)#2,683 |
| 68. | Charlack | 25.6% | 18.1%(+7.47)#68 | 20.4%(+5.17)#2,691 |
| 69. | Portageville | 25.5% | 18.1%(+7.47)#69 | 20.4%(+5.17)#2,694 |
| 70. | Ferguson | 25.5% | 18.1%(+7.41)#70 | 20.4%(+5.11)#2,730 |
| 71. | Bell City | 25.5% | 18.1%(+7.38)#71 | 20.4%(+5.08)#2,744 |
| 72. | Dearborn | 25.4% | 18.1%(+7.32)#72 | 20.4%(+5.02)#2,780 |
| 73. | Norwood Court | 25.4% | 18.1%(+7.30)#73 | 20.4%(+5.00)#2,792 |
| 74. | De Soto | 25.2% | 18.1%(+7.16)#74 | 20.4%(+4.86)#2,882 |
| 75. | Preston | 25.2% | 18.1%(+7.15)#75 | 20.4%(+4.85)#2,889 |
| 76. | Rocheport | 25.0% | 18.1%(+6.97)#76 | 20.4%(+4.67)#3,019 |
| 77. | Leadington | 25.0% | 18.1%(+6.92)#77 | 20.4%(+4.62)#3,050 |
| 78. | Black Jack | 25.0% | 18.1%(+6.88)#78 | 20.4%(+4.58)#3,090 |
| 79. | Country Club Hills | 25.0% | 18.1%(+6.88)#79 | 20.4%(+4.58)#3,092 |
| 80. | Seligman | 24.9% | 18.1%(+6.84)#80 | 20.4%(+4.54)#3,118 |
| 81. | Lamar | 24.9% | 18.1%(+6.83)#81 | 20.4%(+4.53)#3,134 |
| 82. | Fair Play | 24.9% | 18.1%(+6.81)#82 | 20.4%(+4.51)#3,151 |
| 83. | New Hampton | 24.8% | 18.1%(+6.71)#83 | 20.4%(+4.41)#3,221 |
| 84. | East Lynne | 24.8% | 18.1%(+6.71)#84 | 20.4%(+4.41)#3,222 |
| 85. | Winona | 24.8% | 18.1%(+6.69)#85 | 20.4%(+4.39)#3,235 |
| 86. | Steelville | 24.8% | 18.1%(+6.68)#86 | 20.4%(+4.38)#3,241 |
| 87. | Bloomsdale | 24.6% | 18.1%(+6.57)#87 | 20.4%(+4.27)#3,326 |
| 88. | Truesdale | 24.6% | 18.1%(+6.55)#88 | 20.4%(+4.25)#3,347 |
| 89. | Northwoods | 24.5% | 18.1%(+6.44)#89 | 20.4%(+4.14)#3,431 |
| 90. | Wheaton | 24.5% | 18.1%(+6.38)#90 | 20.4%(+4.08)#3,477 |
| 91. | Milo | 24.4% | 18.1%(+6.36)#91 | 20.4%(+4.06)#3,490 |
| 92. | Whiteman Afb | 24.4% | 18.1%(+6.35)#92 | 20.4%(+4.05)#3,498 |
| 93. | Ferrelview | 24.4% | 18.1%(+6.34)#93 | 20.4%(+4.05)#3,505 |
| 94. | Phillipsburg | 24.4% | 18.1%(+6.31)#94 | 20.4%(+4.01)#3,530 |
| 95. | St John | 24.4% | 18.1%(+6.29)#95 | 20.4%(+3.99)#3,560 |
| 96. | Edgar Springs | 24.4% | 18.1%(+6.29)#96 | 20.4%(+3.99)#3,567 |
| 97. | Licking | 24.3% | 18.1%(+6.26)#97 | 20.4%(+3.96)#3,597 |
| 98. | Raymondville | 24.3% | 18.1%(+6.23)#98 | 20.4%(+3.93)#3,616 |
| 99. | Pineville | 24.3% | 18.1%(+6.23)#99 | 20.4%(+3.93)#3,617 |
| 100. | Lamar Heights | 24.3% | 18.1%(+6.19)#100 | 20.4%(+3.89)#3,644 |
Common Questions
What are the Top 10 Cities with the Highest Costs of Housing as Percentage of Income in Missouri?
Top 10 Cities with the Highest Costs of Housing as Percentage of Income in Missouri are:
#1
86.6%
#2
45.4%
#3
44.4%
#4
44.3%
#5
42.8%
#6
40.9%
#7
40.6%
#8
39.7%
#9
38.0%
#10
37.2%
What city has the Highest Costs of Housing as Percentage of Income in Missouri?
Halltown has the Highest Costs of Housing as Percentage of Income in Missouri with 86.6%.
What is the Average Housing Costs as Percentage of Income in the State of Missouri?
Average Housing Costs as Percentage of Income in Missouri is 18.1%.
What is the Average Housing Costs as Percentage of Income in the United States?
Average Housing Costs as Percentage of Income in the United States is 20.4%.