Cities with the Highest Costs of Housing as Percentage of Income in Massachusetts
RELATED REPORTS & OPTIONS
Highest Housing Costs / Income
Massachusetts
Compare Cities
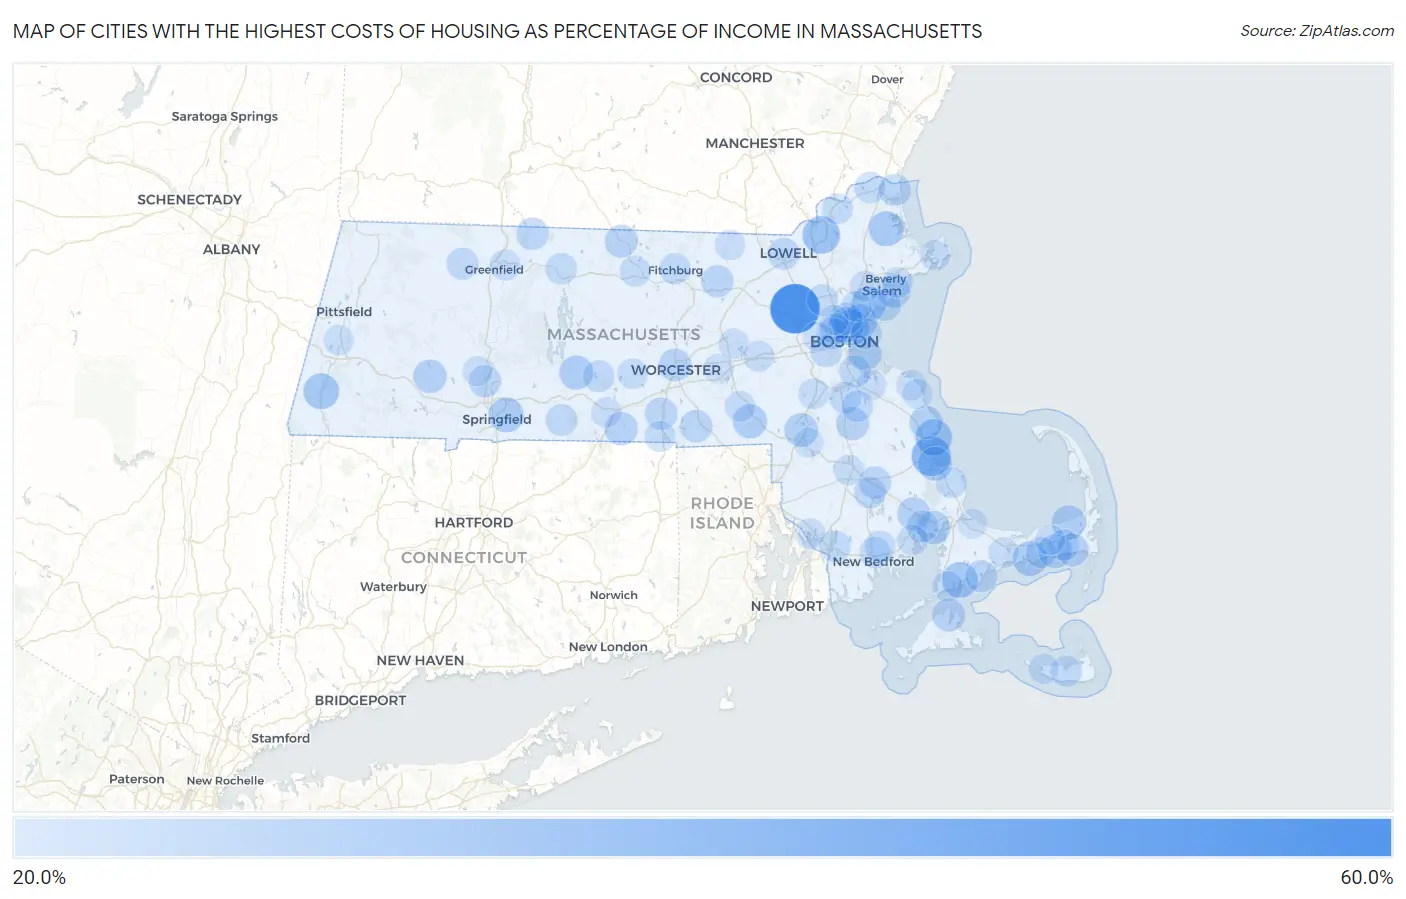
Map of Cities with the Highest Costs of Housing as Percentage of Income in Massachusetts
0.0%
60.0%
Cities with the Highest Costs of Housing as Percentage of Income in Massachusetts
| City | Housing Costs / Income | vs State | vs National | |
| 1. | Hanscom Afb | 53.9% | 22.5%(+31.4)#1 | 20.4%(+33.6)#65 |
| 2. | North Plymouth | 37.3% | 22.5%(+14.8)#2 | 20.4%(+17.0)#280 |
| 3. | Lawrence | 34.5% | 22.5%(+12.0)#3 | 20.4%(+14.1)#436 |
| 4. | Duxbury | 33.0% | 22.5%(+10.5)#4 | 20.4%(+12.6)#555 |
| 5. | East Falmouth | 31.7% | 22.5%(+9.13)#5 | 20.4%(+11.3)#705 |
| 6. | Great Barrington | 31.7% | 22.5%(+9.12)#6 | 20.4%(+11.3)#707 |
| 7. | Chelsea | 31.4% | 22.5%(+8.88)#7 | 20.4%(+11.0)#734 |
| 8. | Rowley | 30.6% | 22.5%(+8.02)#8 | 20.4%(+10.2)#874 |
| 9. | Everett | 30.5% | 22.5%(+7.95)#9 | 20.4%(+10.1)#889 |
| 10. | Springfield | 30.2% | 22.5%(+7.62)#10 | 20.4%(+9.78)#943 |
| 11. | West Yarmouth | 30.0% | 22.5%(+7.45)#11 | 20.4%(+9.61)#978 |
| 12. | Lynn | 30.0% | 22.5%(+7.43)#12 | 20.4%(+9.59)#985 |
| 13. | Ware | 29.2% | 22.5%(+6.69)#13 | 20.4%(+8.84)#1,141 |
| 14. | Plymouth | 29.2% | 22.5%(+6.64)#14 | 20.4%(+8.79)#1,147 |
| 15. | Bellingham | 29.1% | 22.5%(+6.59)#15 | 20.4%(+8.75)#1,160 |
| 16. | Brewster | 29.0% | 22.5%(+6.43)#16 | 20.4%(+8.58)#1,196 |
| 17. | Revere | 28.9% | 22.5%(+6.40)#17 | 20.4%(+8.56)#1,202 |
| 18. | Foxborough | 28.5% | 22.5%(+5.95)#18 | 20.4%(+8.10)#1,327 |
| 19. | Amherst | 28.4% | 22.5%(+5.90)#19 | 20.4%(+8.05)#1,346 |
| 20. | Dennis Port | 28.3% | 22.5%(+5.79)#20 | 20.4%(+7.94)#1,384 |
| 21. | Huntington | 28.2% | 22.5%(+5.66)#21 | 20.4%(+7.82)#1,418 |
| 22. | Marshfield | 27.9% | 22.5%(+5.40)#22 | 20.4%(+7.55)#1,520 |
| 23. | Boston | 27.9% | 22.5%(+5.37)#23 | 20.4%(+7.52)#1,537 |
| 24. | Onset | 27.9% | 22.5%(+5.35)#24 | 20.4%(+7.50)#1,547 |
| 25. | Salem | 27.8% | 22.5%(+5.24)#25 | 20.4%(+7.40)#1,596 |
| 26. | Southbridge Town | 27.8% | 22.5%(+5.24)#26 | 20.4%(+7.39)#1,597 |
| 27. | West Wareham | 27.5% | 22.5%(+4.96)#27 | 20.4%(+7.12)#1,683 |
| 28. | Brockton | 27.4% | 22.5%(+4.85)#28 | 20.4%(+7.01)#1,726 |
| 29. | Winchendon | 27.3% | 22.5%(+4.73)#29 | 20.4%(+6.88)#1,787 |
| 30. | Vineyard Haven | 27.2% | 22.5%(+4.68)#30 | 20.4%(+6.83)#1,801 |
| 31. | Worcester | 26.9% | 22.5%(+4.40)#31 | 20.4%(+6.55)#1,923 |
| 32. | Harwich Port | 26.8% | 22.5%(+4.30)#32 | 20.4%(+6.46)#1,976 |
| 33. | Northfield | 26.6% | 22.5%(+4.11)#33 | 20.4%(+6.27)#2,070 |
| 34. | East Douglas | 26.6% | 22.5%(+4.11)#34 | 20.4%(+6.26)#2,071 |
| 35. | Oxford | 26.5% | 22.5%(+4.02)#35 | 20.4%(+6.17)#2,120 |
| 36. | Malden | 26.5% | 22.5%(+3.99)#36 | 20.4%(+6.15)#2,132 |
| 37. | Devens | 26.3% | 22.5%(+3.74)#37 | 20.4%(+5.90)#2,250 |
| 38. | Middleborough Center | 26.2% | 22.5%(+3.65)#38 | 20.4%(+5.80)#2,299 |
| 39. | Salisbury | 26.1% | 22.5%(+3.62)#39 | 20.4%(+5.77)#2,310 |
| 40. | Holyoke | 25.9% | 22.5%(+3.40)#40 | 20.4%(+5.56)#2,440 |
| 41. | Popponesset Island | 25.8% | 22.5%(+3.26)#41 | 20.4%(+5.41)#2,533 |
| 42. | Swampscott | 25.7% | 22.5%(+3.20)#42 | 20.4%(+5.35)#2,575 |
| 43. | Shelburne Falls | 25.7% | 22.5%(+3.19)#43 | 20.4%(+5.35)#2,580 |
| 44. | Quincy | 25.7% | 22.5%(+3.14)#44 | 20.4%(+5.30)#2,607 |
| 45. | Lowell | 25.7% | 22.5%(+3.13)#45 | 20.4%(+5.28)#2,619 |
| 46. | Wareham Center | 25.7% | 22.5%(+3.12)#46 | 20.4%(+5.27)#2,625 |
| 47. | Greenfield | 25.6% | 22.5%(+3.05)#47 | 20.4%(+5.21)#2,674 |
| 48. | North Lakeville | 25.6% | 22.5%(+3.04)#48 | 20.4%(+5.20)#2,678 |
| 49. | Randolph Town | 25.5% | 22.5%(+2.98)#49 | 20.4%(+5.14)#2,710 |
| 50. | West Brookfield | 25.4% | 22.5%(+2.90)#50 | 20.4%(+5.05)#2,759 |
| 51. | Brookline | 25.4% | 22.5%(+2.89)#51 | 20.4%(+5.05)#2,763 |
| 52. | Monson Center | 25.3% | 22.5%(+2.76)#52 | 20.4%(+4.92)#2,849 |
| 53. | Holbrook | 25.1% | 22.5%(+2.58)#53 | 20.4%(+4.73)#2,973 |
| 54. | Orange | 25.1% | 22.5%(+2.52)#54 | 20.4%(+4.68)#3,011 |
| 55. | Cambridge | 25.0% | 22.5%(+2.42)#55 | 20.4%(+4.57)#3,097 |
| 56. | Fall River | 24.9% | 22.5%(+2.36)#56 | 20.4%(+4.52)#3,144 |
| 57. | Amesbury Town | 24.8% | 22.5%(+2.26)#57 | 20.4%(+4.41)#3,220 |
| 58. | Woburn | 24.8% | 22.5%(+2.24)#58 | 20.4%(+4.40)#3,231 |
| 59. | Fitchburg | 24.7% | 22.5%(+2.21)#59 | 20.4%(+4.37)#3,252 |
| 60. | Nantucket | 24.7% | 22.5%(+2.17)#60 | 20.4%(+4.33)#3,288 |
| 61. | Northwest Harwich | 24.7% | 22.5%(+2.14)#61 | 20.4%(+4.30)#3,310 |
| 62. | Winthrop Town | 24.6% | 22.5%(+2.09)#62 | 20.4%(+4.24)#3,350 |
| 63. | New Bedford | 24.5% | 22.5%(+2.02)#63 | 20.4%(+4.17)#3,406 |
| 64. | Acushnet Center | 24.5% | 22.5%(+1.99)#64 | 20.4%(+4.15)#3,427 |
| 65. | The Pinehills | 24.5% | 22.5%(+1.95)#65 | 20.4%(+4.11)#3,458 |
| 66. | South Yarmouth | 24.4% | 22.5%(+1.86)#66 | 20.4%(+4.02)#3,528 |
| 67. | Gardner | 24.2% | 22.5%(+1.67)#67 | 20.4%(+3.82)#3,701 |
| 68. | Haverhill | 24.2% | 22.5%(+1.66)#68 | 20.4%(+3.82)#3,708 |
| 69. | Webster | 24.2% | 22.5%(+1.66)#69 | 20.4%(+3.82)#3,711 |
| 70. | Turners Falls | 24.2% | 22.5%(+1.62)#70 | 20.4%(+3.78)#3,753 |
| 71. | Peabody | 24.1% | 22.5%(+1.59)#71 | 20.4%(+3.75)#3,776 |
| 72. | Framingham | 24.0% | 22.5%(+1.45)#72 | 20.4%(+3.61)#3,878 |
| 73. | Milford | 24.0% | 22.5%(+1.45)#73 | 20.4%(+3.61)#3,879 |
| 74. | Gloucester | 24.0% | 22.5%(+1.45)#74 | 20.4%(+3.61)#3,883 |
| 75. | Marion Center | 24.0% | 22.5%(+1.44)#75 | 20.4%(+3.60)#3,886 |
| 76. | Somerville | 23.9% | 22.5%(+1.36)#76 | 20.4%(+3.52)#3,965 |
| 77. | Barnstable Town | 23.9% | 22.5%(+1.33)#77 | 20.4%(+3.49)#3,990 |
| 78. | Norwood | 23.8% | 22.5%(+1.31)#78 | 20.4%(+3.47)#4,020 |
| 79. | Beverly | 23.8% | 22.5%(+1.31)#79 | 20.4%(+3.46)#4,025 |
| 80. | Spencer | 23.8% | 22.5%(+1.22)#80 | 20.4%(+3.38)#4,095 |
| 81. | Falmouth | 23.7% | 22.5%(+1.20)#81 | 20.4%(+3.36)#4,120 |
| 82. | Raynham Center | 23.7% | 22.5%(+1.13)#82 | 20.4%(+3.29)#4,201 |
| 83. | North Scituate | 23.5% | 22.5%(+0.999)#83 | 20.4%(+3.16)#4,334 |
| 84. | Ocean Grove | 23.5% | 22.5%(+0.971)#84 | 20.4%(+3.13)#4,368 |
| 85. | Saugus | 23.5% | 22.5%(+0.940)#85 | 20.4%(+3.10)#4,406 |
| 86. | Fiskdale | 23.4% | 22.5%(+0.881)#86 | 20.4%(+3.04)#4,456 |
| 87. | Weymouth Town | 23.3% | 22.5%(+0.810)#87 | 20.4%(+2.97)#4,527 |
| 88. | South Dennis | 23.3% | 22.5%(+0.746)#88 | 20.4%(+2.90)#4,594 |
| 89. | Marlborough | 23.2% | 22.5%(+0.717)#89 | 20.4%(+2.87)#4,613 |
| 90. | Medford | 23.2% | 22.5%(+0.714)#90 | 20.4%(+2.87)#4,616 |
| 91. | Lenox | 23.2% | 22.5%(+0.671)#91 | 20.4%(+2.83)#4,659 |
| 92. | Madaket | 23.2% | 22.5%(+0.660)#92 | 20.4%(+2.82)#4,674 |
| 93. | Scituate | 23.2% | 22.5%(+0.649)#93 | 20.4%(+2.81)#4,685 |
| 94. | East Pepperell | 23.2% | 22.5%(+0.642)#94 | 20.4%(+2.80)#4,692 |
| 95. | Westborough | 23.1% | 22.5%(+0.559)#95 | 20.4%(+2.72)#4,789 |
| 96. | Sandwich | 22.9% | 22.5%(+0.410)#96 | 20.4%(+2.57)#4,981 |
| 97. | Easthampton Town | 22.9% | 22.5%(+0.407)#97 | 20.4%(+2.56)#4,984 |
| 98. | Watertown Town | 22.9% | 22.5%(+0.382)#98 | 20.4%(+2.54)#5,011 |
| 99. | Mansfield Center | 22.9% | 22.5%(+0.368)#99 | 20.4%(+2.52)#5,027 |
| 100. | Oak Bluffs | 22.9% | 22.5%(+0.352)#100 | 20.4%(+2.51)#5,045 |
Common Questions
What are the Top 10 Cities with the Highest Costs of Housing as Percentage of Income in Massachusetts?
Top 10 Cities with the Highest Costs of Housing as Percentage of Income in Massachusetts are:
#1
53.9%
#2
37.3%
#3
34.5%
#4
33.0%
#5
31.7%
#6
31.7%
#7
31.4%
#8
30.6%
#9
30.5%
#10
30.2%
What city has the Highest Costs of Housing as Percentage of Income in Massachusetts?
Hanscom AFB has the Highest Costs of Housing as Percentage of Income in Massachusetts with 53.9%.
What is the Average Housing Costs as Percentage of Income in the State of Massachusetts?
Average Housing Costs as Percentage of Income in Massachusetts is 22.5%.
What is the Average Housing Costs as Percentage of Income in the United States?
Average Housing Costs as Percentage of Income in the United States is 20.4%.