Cities with the Highest Costs of Housing as Percentage of Income in Vermont
RELATED REPORTS & OPTIONS
Highest Housing Costs / Income
Vermont
Compare Cities
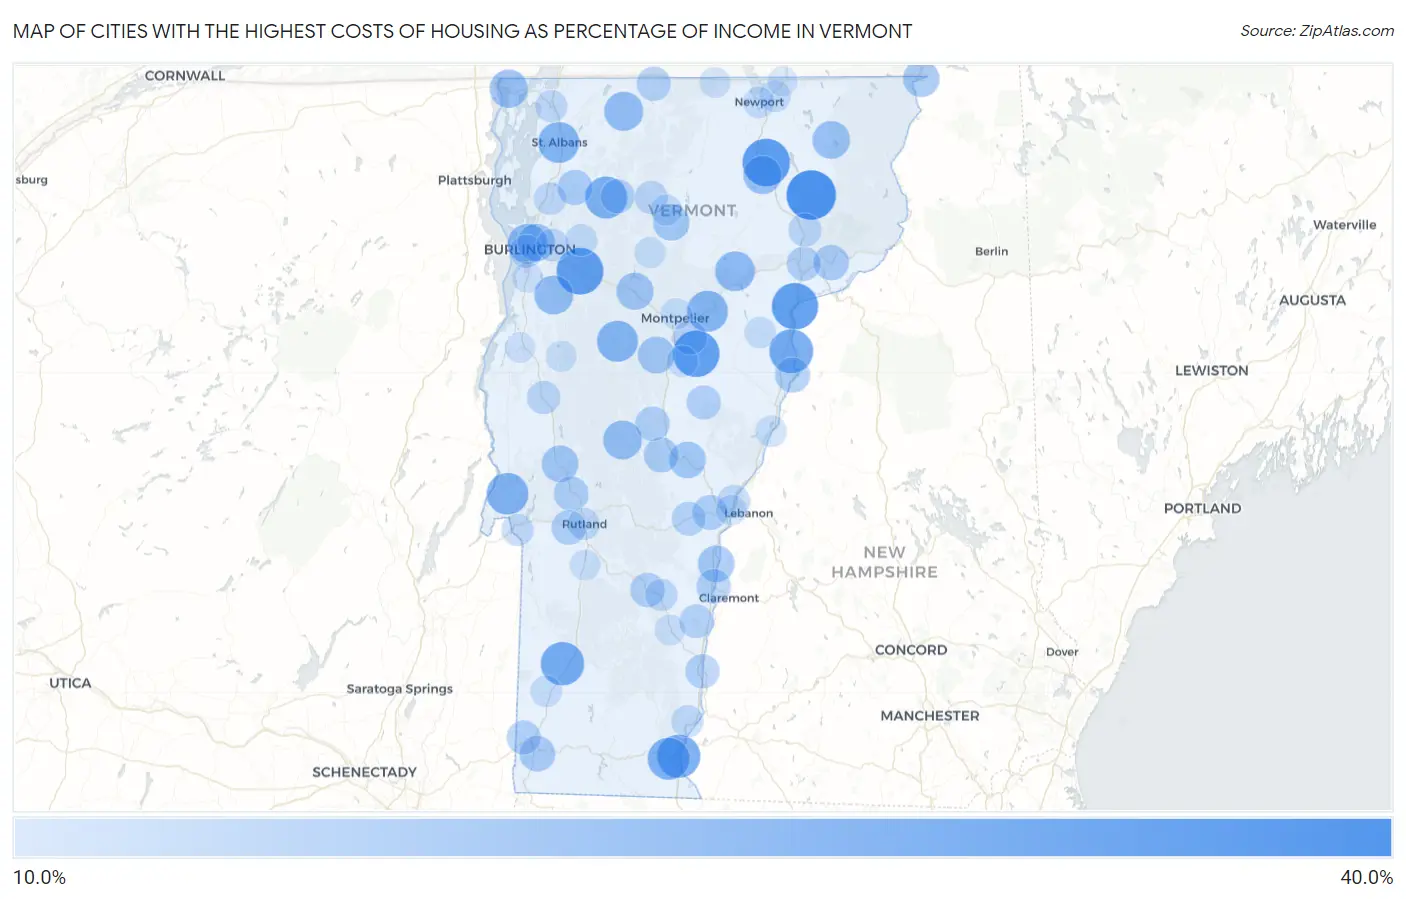
Map of Cities with the Highest Costs of Housing as Percentage of Income in Vermont
0.0%
40.0%
Cities with the Highest Costs of Housing as Percentage of Income in Vermont
| City | Housing Costs / Income | vs State | vs National | |
| 1. | West Burke | 40.0% | 20.9%(+19.1)#1 | 20.4%(+19.6)#193 |
| 2. | Barton | 37.7% | 20.9%(+16.8)#2 | 20.4%(+17.4)#256 |
| 3. | Richmond | 37.1% | 20.9%(+16.2)#3 | 20.4%(+16.7)#293 |
| 4. | Graniteville | 36.7% | 20.9%(+15.8)#4 | 20.4%(+16.4)#307 |
| 5. | Barnet | 36.6% | 20.9%(+15.6)#5 | 20.4%(+16.2)#322 |
| 6. | Lyndon | 34.2% | 20.9%(+13.3)#6 | 20.4%(+13.8)#456 |
| 7. | Wells River | 33.8% | 20.9%(+12.9)#7 | 20.4%(+13.5)#488 |
| 8. | Townshend | 33.8% | 20.9%(+12.9)#8 | 20.4%(+13.4)#489 |
| 9. | Manchester | 33.4% | 20.9%(+12.5)#9 | 20.4%(+13.0)#514 |
| 10. | Brattleboro | 33.2% | 20.9%(+12.2)#10 | 20.4%(+12.8)#540 |
| 11. | Cambridge | 32.0% | 20.9%(+11.1)#11 | 20.4%(+11.6)#661 |
| 12. | West Brattleboro | 32.0% | 20.9%(+11.0)#12 | 20.4%(+11.6)#670 |
| 13. | Benson | 31.5% | 20.9%(+10.6)#13 | 20.4%(+11.2)#718 |
| 14. | Waitsfield | 30.9% | 20.9%(+9.96)#14 | 20.4%(+10.5)#813 |
| 15. | Plainfield | 30.9% | 20.9%(+9.93)#15 | 20.4%(+10.5)#817 |
| 16. | St Albans | 30.7% | 20.9%(+9.76)#16 | 20.4%(+10.3)#844 |
| 17. | Cabot | 29.5% | 20.9%(+8.60)#17 | 20.4%(+9.16)#1,061 |
| 18. | Burlington | 29.4% | 20.9%(+8.49)#18 | 20.4%(+9.05)#1,089 |
| 19. | West Woodstock | 28.9% | 20.9%(+8.00)#19 | 20.4%(+8.56)#1,201 |
| 20. | Enosburg Falls | 28.8% | 20.9%(+7.87)#20 | 20.4%(+8.42)#1,234 |
| 21. | Hinesburg | 28.6% | 20.9%(+7.71)#21 | 20.4%(+8.27)#1,285 |
| 22. | Rochester | 28.5% | 20.9%(+7.61)#22 | 20.4%(+8.16)#1,309 |
| 23. | Pawlet | 28.4% | 20.9%(+7.50)#23 | 20.4%(+8.05)#1,347 |
| 24. | South Londonderry | 28.0% | 20.9%(+7.07)#24 | 20.4%(+7.63)#1,493 |
| 25. | Alburgh | 27.9% | 20.9%(+6.94)#25 | 20.4%(+7.50)#1,548 |
| 26. | Glover | 27.9% | 20.9%(+6.94)#26 | 20.4%(+7.50)#1,551 |
| 27. | Island Pond | 27.4% | 20.9%(+6.46)#27 | 20.4%(+7.01)#1,723 |
| 28. | Winooski | 27.2% | 20.9%(+6.24)#28 | 20.4%(+6.79)#1,819 |
| 29. | Lunenburg | 26.8% | 20.9%(+5.83)#29 | 20.4%(+6.39)#2,010 |
| 30. | Waterbury | 26.7% | 20.9%(+5.76)#30 | 20.4%(+6.32)#2,049 |
| 31. | Northfield | 26.6% | 20.9%(+5.63)#31 | 20.4%(+6.18)#2,113 |
| 32. | Brandon | 26.3% | 20.9%(+5.33)#32 | 20.4%(+5.88)#2,261 |
| 33. | South Royalton | 26.2% | 20.9%(+5.27)#33 | 20.4%(+5.83)#2,290 |
| 34. | Windsor | 26.1% | 20.9%(+5.19)#34 | 20.4%(+5.75)#2,328 |
| 35. | Beecher Falls | 26.0% | 20.9%(+5.06)#35 | 20.4%(+5.62)#2,403 |
| 36. | Morrisville | 26.0% | 20.9%(+5.02)#36 | 20.4%(+5.58)#2,428 |
| 37. | Bennington | 25.2% | 20.9%(+4.25)#37 | 20.4%(+4.81)#2,923 |
| 38. | Concord | 24.9% | 20.9%(+4.02)#38 | 20.4%(+4.57)#3,098 |
| 39. | Fairfax | 24.6% | 20.9%(+3.71)#39 | 20.4%(+4.26)#3,333 |
| 40. | Newbury | 24.6% | 20.9%(+3.70)#40 | 20.4%(+4.26)#3,337 |
| 41. | Bethel | 24.6% | 20.9%(+3.63)#41 | 20.4%(+4.18)#3,399 |
| 42. | Lincoln | 24.5% | 20.9%(+3.58)#42 | 20.4%(+4.14)#3,434 |
| 43. | Quechee | 24.5% | 20.9%(+3.57)#43 | 20.4%(+4.12)#3,440 |
| 44. | Pittsford | 24.2% | 20.9%(+3.32)#44 | 20.4%(+3.87)#3,663 |
| 45. | West Rutland | 24.2% | 20.9%(+3.23)#45 | 20.4%(+3.79)#3,743 |
| 46. | Ludlow | 24.1% | 20.9%(+3.19)#46 | 20.4%(+3.74)#3,782 |
| 47. | Underhill Flats | 24.1% | 20.9%(+3.16)#47 | 20.4%(+3.72)#3,800 |
| 48. | Randolph | 24.1% | 20.9%(+3.14)#48 | 20.4%(+3.69)#3,815 |
| 49. | Ascutney | 23.9% | 20.9%(+2.92)#49 | 20.4%(+3.48)#3,996 |
| 50. | Grafton | 23.8% | 20.9%(+2.86)#50 | 20.4%(+3.41)#4,064 |
| 51. | Chelsea | 23.7% | 20.9%(+2.81)#51 | 20.4%(+3.36)#4,114 |
| 52. | Jeffersonville | 23.7% | 20.9%(+2.81)#52 | 20.4%(+3.36)#4,116 |
| 53. | Barre | 23.7% | 20.9%(+2.80)#53 | 20.4%(+3.36)#4,121 |
| 54. | St Johnsbury | 23.6% | 20.9%(+2.70)#54 | 20.4%(+3.26)#4,229 |
| 55. | Bellows Falls | 23.6% | 20.9%(+2.70)#55 | 20.4%(+3.26)#4,235 |
| 56. | Richford | 23.6% | 20.9%(+2.67)#56 | 20.4%(+3.22)#4,270 |
| 57. | North Bennington | 23.6% | 20.9%(+2.63)#57 | 20.4%(+3.19)#4,296 |
| 58. | Woodstock | 23.4% | 20.9%(+2.48)#58 | 20.4%(+3.04)#4,454 |
| 59. | Killington | 23.4% | 20.9%(+2.48)#59 | 20.4%(+3.03)#4,461 |
| 60. | Springfield | 23.3% | 20.9%(+2.39)#60 | 20.4%(+2.94)#4,550 |
| 61. | Middlebury | 22.8% | 20.9%(+1.85)#61 | 20.4%(+2.41)#5,166 |
| 62. | Lyndonville | 22.7% | 20.9%(+1.78)#62 | 20.4%(+2.34)#5,256 |
| 63. | Johnson | 22.6% | 20.9%(+1.69)#63 | 20.4%(+2.25)#5,384 |
| 64. | South Burlington | 22.4% | 20.9%(+1.51)#64 | 20.4%(+2.07)#5,582 |
| 65. | East Poultney | 22.2% | 20.9%(+1.27)#65 | 20.4%(+1.83)#5,919 |
| 66. | Milton | 22.0% | 20.9%(+1.12)#66 | 20.4%(+1.67)#6,145 |
| 67. | Wilder | 22.0% | 20.9%(+1.03)#67 | 20.4%(+1.59)#6,262 |
| 68. | Gilman | 21.9% | 20.9%(+0.995)#68 | 20.4%(+1.55)#6,316 |
| 69. | Essex Junction | 21.9% | 20.9%(+0.959)#69 | 20.4%(+1.51)#6,369 |
| 70. | Wardsboro | 21.8% | 20.9%(+0.912)#70 | 20.4%(+1.47)#6,441 |
| 71. | Rutland | 21.8% | 20.9%(+0.861)#71 | 20.4%(+1.42)#6,504 |
| 72. | Swanton | 21.7% | 20.9%(+0.774)#72 | 20.4%(+1.33)#6,617 |
| 73. | Proctorsville | 21.6% | 20.9%(+0.717)#73 | 20.4%(+1.27)#6,701 |
| 74. | Fair Haven | 21.6% | 20.9%(+0.626)#74 | 20.4%(+1.18)#6,832 |
| 75. | Putney | 21.5% | 20.9%(+0.561)#75 | 20.4%(+1.12)#6,940 |
| 76. | Castleton Four Corners | 21.4% | 20.9%(+0.475)#76 | 20.4%(+1.03)#7,065 |
| 77. | Jericho | 21.4% | 20.9%(+0.470)#77 | 20.4%(+1.03)#7,071 |
| 78. | Hanksville | 21.2% | 20.9%(+0.294)#78 | 20.4%(+0.850)#7,360 |
| 79. | Derby Center | 21.2% | 20.9%(+0.241)#79 | 20.4%(+0.797)#7,444 |
| 80. | Newport | 21.1% | 20.9%(+0.160)#80 | 20.4%(+0.716)#7,566 |
| 81. | Williamstown | 21.0% | 20.9%(+0.072)#81 | 20.4%(+0.628)#7,721 |
| 82. | Arlington | 21.0% | 20.9%(+0.028)#82 | 20.4%(+0.584)#7,806 |
| 83. | Hyde Park | 20.9% | 20.9%(-0.020)#83 | 20.4%(+0.536)#7,898 |
| 84. | Groton | 20.8% | 20.9%(-0.116)#84 | 20.4%(+0.439)#8,038 |
| 85. | South Hero | 20.8% | 20.9%(-0.143)#85 | 20.4%(+0.413)#8,073 |
| 86. | Fairlee | 20.7% | 20.9%(-0.232)#86 | 20.4%(+0.324)#8,228 |
| 87. | Stowe | 20.6% | 20.9%(-0.313)#87 | 20.4%(+0.243)#8,382 |
| 88. | Montpelier | 20.5% | 20.9%(-0.428)#88 | 20.4%(+0.128)#8,599 |
| 89. | Bristol | 20.3% | 20.9%(-0.606)#89 | 20.4%(-0.051)#8,901 |
| 90. | Algiers | 20.2% | 20.9%(-0.709)#90 | 20.4%(-0.153)#9,108 |
| 91. | Chester | 20.2% | 20.9%(-0.731)#91 | 20.4%(-0.175)#9,152 |
| 92. | North Troy | 20.2% | 20.9%(-0.751)#92 | 20.4%(-0.196)#9,192 |
| 93. | Middletown Springs | 20.2% | 20.9%(-0.753)#93 | 20.4%(-0.197)#9,196 |
| 94. | Wallingford | 20.2% | 20.9%(-0.780)#94 | 20.4%(-0.224)#9,255 |
| 95. | White River Junction | 20.1% | 20.9%(-0.811)#95 | 20.4%(-0.256)#9,294 |
| 96. | Shelburne | 20.1% | 20.9%(-0.855)#96 | 20.4%(-0.300)#9,378 |
| 97. | Vergennes | 19.9% | 20.9%(-1.01)#97 | 20.4%(-0.456)#9,655 |
| 98. | Bakersfield | 19.7% | 20.9%(-1.20)#98 | 20.4%(-0.644)#10,029 |
| 99. | North Hyde Park | 19.6% | 20.9%(-1.34)#99 | 20.4%(-0.781)#10,287 |
| 100. | Derby Line | 19.6% | 20.9%(-1.34)#100 | 20.4%(-0.787)#10,306 |
1
2Common Questions
What are the Top 10 Cities with the Highest Costs of Housing as Percentage of Income in Vermont?
Top 10 Cities with the Highest Costs of Housing as Percentage of Income in Vermont are:
#1
40.0%
#2
37.7%
#3
37.1%
#4
36.7%
#5
36.6%
#6
33.8%
#7
33.4%
#8
33.2%
#9
32.0%
#10
32.0%
What city has the Highest Costs of Housing as Percentage of Income in Vermont?
West Burke has the Highest Costs of Housing as Percentage of Income in Vermont with 40.0%.
What is the Average Housing Costs as Percentage of Income in the State of Vermont?
Average Housing Costs as Percentage of Income in Vermont is 20.9%.
What is the Average Housing Costs as Percentage of Income in the United States?
Average Housing Costs as Percentage of Income in the United States is 20.4%.