Cities with the Highest Costs of Housing as Percentage of Income in Illinois
RELATED REPORTS & OPTIONS
Highest Housing Costs / Income
Illinois
Compare Cities
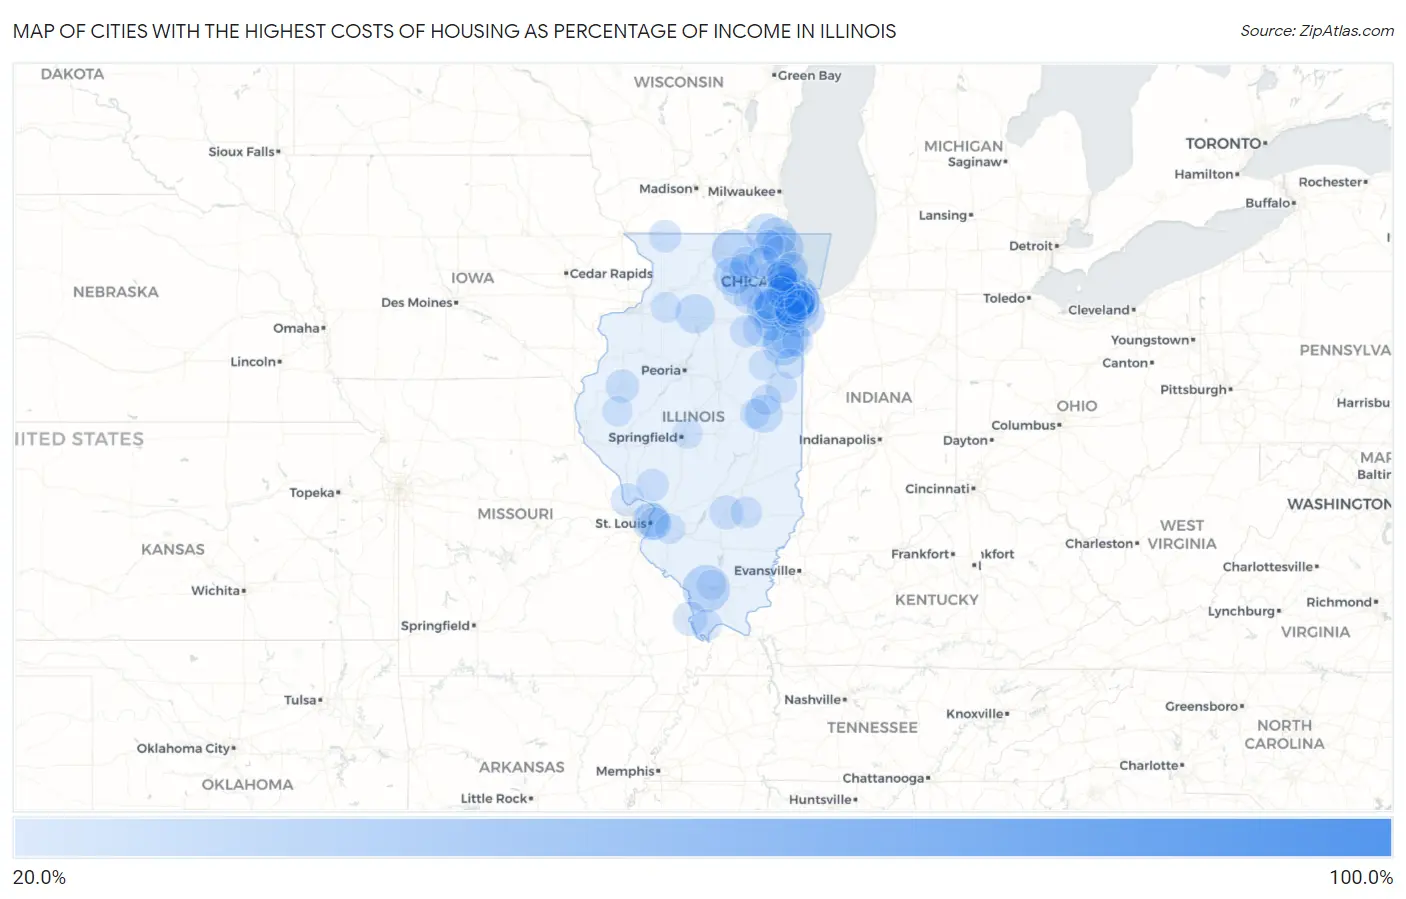
Map of Cities with the Highest Costs of Housing as Percentage of Income in Illinois
0.0%
100.0%
Cities with the Highest Costs of Housing as Percentage of Income in Illinois
| City | Housing Costs / Income | vs State | vs National | |
| 1. | Nekoma | 100.0% | 19.6%(+80.4)#1 | 20.4%(+79.6)#7 |
| 2. | Millersburg | 53.6% | 19.6%(+34.0)#2 | 20.4%(+33.2)#66 |
| 3. | Joslin | 39.1% | 19.6%(+19.5)#3 | 20.4%(+18.7)#217 |
| 4. | Riverdale | 34.5% | 19.6%(+14.9)#4 | 20.4%(+14.1)#437 |
| 5. | Carbondale | 33.4% | 19.6%(+13.8)#5 | 20.4%(+13.0)#515 |
| 6. | Willowbrook | 33.3% | 19.6%(+13.7)#6 | 20.4%(+12.9)#523 |
| 7. | Phoenix | 33.0% | 19.6%(+13.4)#7 | 20.4%(+12.6)#553 |
| 8. | Cahokia Heights | 32.9% | 19.6%(+13.3)#8 | 20.4%(+12.6)#563 |
| 9. | Oakbrook Terrace | 32.4% | 19.6%(+12.8)#9 | 20.4%(+12.1)#616 |
| 10. | Garden Prairie | 31.1% | 19.6%(+11.5)#10 | 20.4%(+10.7)#781 |
| 11. | East Hazel Crest | 30.2% | 19.6%(+10.5)#11 | 20.4%(+9.81)#938 |
| 12. | North Chicago | 30.1% | 19.6%(+10.4)#12 | 20.4%(+9.71)#955 |
| 13. | Markham | 29.9% | 19.6%(+10.2)#13 | 20.4%(+9.50)#997 |
| 14. | Hazel Crest | 29.6% | 19.6%(+9.97)#14 | 20.4%(+9.24)#1,044 |
| 15. | Rockdale | 29.5% | 19.6%(+9.82)#15 | 20.4%(+9.08)#1,074 |
| 16. | Sammons Point | 29.2% | 19.6%(+9.60)#16 | 20.4%(+8.87)#1,132 |
| 17. | Channel Lake | 29.2% | 19.6%(+9.52)#17 | 20.4%(+8.79)#1,149 |
| 18. | La Clede | 29.0% | 19.6%(+9.36)#18 | 20.4%(+8.63)#1,184 |
| 19. | Old Mill Creek | 28.7% | 19.6%(+9.06)#19 | 20.4%(+8.33)#1,260 |
| 20. | Harvey | 28.3% | 19.6%(+8.70)#20 | 20.4%(+7.97)#1,376 |
| 21. | Dover | 28.3% | 19.6%(+8.67)#21 | 20.4%(+7.94)#1,386 |
| 22. | Sun River Terrace | 28.1% | 19.6%(+8.50)#22 | 20.4%(+7.77)#1,439 |
| 23. | Dolton | 28.1% | 19.6%(+8.43)#23 | 20.4%(+7.70)#1,460 |
| 24. | Olympia Fields | 27.9% | 19.6%(+8.28)#24 | 20.4%(+7.55)#1,523 |
| 25. | Dekalb | 27.8% | 19.6%(+8.20)#25 | 20.4%(+7.47)#1,567 |
| 26. | Sauk Village | 27.8% | 19.6%(+8.17)#26 | 20.4%(+7.44)#1,580 |
| 27. | Brooklyn | 27.5% | 19.6%(+7.86)#27 | 20.4%(+7.13)#1,682 |
| 28. | Urbana | 27.4% | 19.6%(+7.79)#28 | 20.4%(+7.06)#1,710 |
| 29. | Kankakee | 27.4% | 19.6%(+7.72)#29 | 20.4%(+6.99)#1,735 |
| 30. | Preston Heights | 27.2% | 19.6%(+7.55)#30 | 20.4%(+6.82)#1,805 |
| 31. | Symerton | 26.7% | 19.6%(+7.03)#31 | 20.4%(+6.30)#2,054 |
| 32. | Godley | 26.6% | 19.6%(+6.99)#32 | 20.4%(+6.26)#2,075 |
| 33. | Hillside | 26.6% | 19.6%(+6.97)#33 | 20.4%(+6.24)#2,081 |
| 34. | South Holland | 26.4% | 19.6%(+6.75)#34 | 20.4%(+6.02)#2,198 |
| 35. | Ingalls Park | 26.0% | 19.6%(+6.40)#35 | 20.4%(+5.67)#2,362 |
| 36. | Merrionette Park | 25.7% | 19.6%(+6.01)#36 | 20.4%(+5.28)#2,618 |
| 37. | Burtons Bridge | 25.6% | 19.6%(+5.97)#37 | 20.4%(+5.23)#2,653 |
| 38. | Lincolnwood | 25.6% | 19.6%(+5.96)#38 | 20.4%(+5.23)#2,656 |
| 39. | East Cape Girardeau | 25.3% | 19.6%(+5.69)#39 | 20.4%(+4.96)#2,814 |
| 40. | Posen | 25.2% | 19.6%(+5.58)#40 | 20.4%(+4.84)#2,894 |
| 41. | Hinckley | 25.2% | 19.6%(+5.57)#41 | 20.4%(+4.84)#2,903 |
| 42. | Burnham | 25.2% | 19.6%(+5.53)#42 | 20.4%(+4.79)#2,932 |
| 43. | Calumet Park | 25.2% | 19.6%(+5.51)#43 | 20.4%(+4.78)#2,944 |
| 44. | Worth | 25.1% | 19.6%(+5.45)#44 | 20.4%(+4.72)#2,984 |
| 45. | Kinmundy | 25.1% | 19.6%(+5.43)#45 | 20.4%(+4.70)#2,998 |
| 46. | Lyons | 25.1% | 19.6%(+5.43)#46 | 20.4%(+4.70)#3,002 |
| 47. | Monee | 25.1% | 19.6%(+5.41)#47 | 20.4%(+4.67)#3,014 |
| 48. | Venice | 25.0% | 19.6%(+5.36)#48 | 20.4%(+4.63)#3,048 |
| 49. | Maywood | 24.9% | 19.6%(+5.24)#49 | 20.4%(+4.51)#3,158 |
| 50. | Sunnyland | 24.7% | 19.6%(+5.09)#50 | 20.4%(+4.36)#3,255 |
| 51. | Wilton Center | 24.7% | 19.6%(+5.09)#51 | 20.4%(+4.36)#3,257 |
| 52. | Glenwood | 24.7% | 19.6%(+5.07)#52 | 20.4%(+4.34)#3,273 |
| 53. | Macomb | 24.7% | 19.6%(+5.06)#53 | 20.4%(+4.33)#3,283 |
| 54. | Mettawa | 24.6% | 19.6%(+4.99)#54 | 20.4%(+4.26)#3,329 |
| 55. | Brussels | 24.5% | 19.6%(+4.90)#55 | 20.4%(+4.17)#3,410 |
| 56. | Justice | 24.5% | 19.6%(+4.88)#56 | 20.4%(+4.15)#3,421 |
| 57. | Broadview | 24.5% | 19.6%(+4.84)#57 | 20.4%(+4.11)#3,457 |
| 58. | Chicago | 24.4% | 19.6%(+4.73)#58 | 20.4%(+4.00)#3,551 |
| 59. | East St Louis | 24.4% | 19.6%(+4.72)#59 | 20.4%(+3.99)#3,566 |
| 60. | Richton Park | 24.3% | 19.6%(+4.69)#60 | 20.4%(+3.95)#3,600 |
| 61. | Robbins | 24.3% | 19.6%(+4.62)#61 | 20.4%(+3.89)#3,646 |
| 62. | Verona | 24.2% | 19.6%(+4.60)#62 | 20.4%(+3.87)#3,665 |
| 63. | Nora | 24.2% | 19.6%(+4.58)#63 | 20.4%(+3.85)#3,685 |
| 64. | Fidelity | 24.2% | 19.6%(+4.56)#64 | 20.4%(+3.83)#3,691 |
| 65. | Cortland | 24.1% | 19.6%(+4.43)#65 | 20.4%(+3.70)#3,811 |
| 66. | Boulder Hill | 24.0% | 19.6%(+4.36)#66 | 20.4%(+3.63)#3,864 |
| 67. | Fairmont | 23.9% | 19.6%(+4.30)#67 | 20.4%(+3.56)#3,912 |
| 68. | Schiller Park | 23.8% | 19.6%(+4.17)#68 | 20.4%(+3.44)#4,042 |
| 69. | Summit | 23.7% | 19.6%(+4.10)#69 | 20.4%(+3.37)#4,107 |
| 70. | Louisville | 23.6% | 19.6%(+3.95)#70 | 20.4%(+3.22)#4,272 |
| 71. | Calumet City | 23.6% | 19.6%(+3.92)#71 | 20.4%(+3.19)#4,295 |
| 72. | Hampshire | 23.5% | 19.6%(+3.84)#72 | 20.4%(+3.11)#4,387 |
| 73. | Dixmoor | 23.4% | 19.6%(+3.76)#73 | 20.4%(+3.03)#4,460 |
| 74. | Rankin | 23.4% | 19.6%(+3.73)#74 | 20.4%(+3.00)#4,486 |
| 75. | Hopkins Park | 23.4% | 19.6%(+3.73)#75 | 20.4%(+3.00)#4,487 |
| 76. | East Dundee | 23.4% | 19.6%(+3.73)#76 | 20.4%(+2.99)#4,491 |
| 77. | Pulaski | 23.4% | 19.6%(+3.71)#77 | 20.4%(+2.98)#4,502 |
| 78. | Evanston | 23.2% | 19.6%(+3.55)#78 | 20.4%(+2.82)#4,672 |
| 79. | Crest Hill | 23.2% | 19.6%(+3.54)#79 | 20.4%(+2.81)#4,684 |
| 80. | Matteson | 23.2% | 19.6%(+3.52)#80 | 20.4%(+2.79)#4,706 |
| 81. | University Park | 23.1% | 19.6%(+3.49)#81 | 20.4%(+2.76)#4,734 |
| 82. | Round Lake | 23.1% | 19.6%(+3.45)#82 | 20.4%(+2.72)#4,781 |
| 83. | Barrington Hills | 23.1% | 19.6%(+3.45)#83 | 20.4%(+2.72)#4,782 |
| 84. | Hooppole | 23.0% | 19.6%(+3.35)#84 | 20.4%(+2.62)#4,906 |
| 85. | Rantoul | 23.0% | 19.6%(+3.32)#85 | 20.4%(+2.59)#4,937 |
| 86. | Bonnie Brae | 22.9% | 19.6%(+3.30)#86 | 20.4%(+2.57)#4,968 |
| 87. | Piper City | 22.9% | 19.6%(+3.30)#87 | 20.4%(+2.57)#4,969 |
| 88. | Scott Afb | 22.9% | 19.6%(+3.28)#88 | 20.4%(+2.55)#4,995 |
| 89. | Lockport Heights | 22.9% | 19.6%(+3.28)#89 | 20.4%(+2.55)#4,998 |
| 90. | Camden | 22.9% | 19.6%(+3.26)#90 | 20.4%(+2.53)#5,014 |
| 91. | Bellwood | 22.9% | 19.6%(+3.25)#91 | 20.4%(+2.52)#5,030 |
| 92. | Cambria | 22.9% | 19.6%(+3.23)#92 | 20.4%(+2.50)#5,051 |
| 93. | Franklin Park | 22.8% | 19.6%(+3.18)#93 | 20.4%(+2.45)#5,106 |
| 94. | Yorkville | 22.8% | 19.6%(+3.15)#94 | 20.4%(+2.42)#5,148 |
| 95. | Burlington | 22.8% | 19.6%(+3.12)#95 | 20.4%(+2.39)#5,193 |
| 96. | Willow Springs | 22.7% | 19.6%(+3.06)#96 | 20.4%(+2.33)#5,260 |
| 97. | Lansing | 22.7% | 19.6%(+3.06)#97 | 20.4%(+2.33)#5,269 |
| 98. | Bondville | 22.7% | 19.6%(+3.06)#98 | 20.4%(+2.33)#5,270 |
| 99. | Riverton | 22.7% | 19.6%(+3.05)#99 | 20.4%(+2.32)#5,278 |
| 100. | Watseka | 22.7% | 19.6%(+3.05)#100 | 20.4%(+2.32)#5,283 |
Common Questions
What are the Top 10 Cities with the Highest Costs of Housing as Percentage of Income in Illinois?
Top 10 Cities with the Highest Costs of Housing as Percentage of Income in Illinois are:
#1
34.5%
#2
33.4%
#3
33.3%
#4
33.0%
#5
32.4%
#6
31.1%
#7
30.2%
#8
30.1%
#9
29.9%
#10
29.6%
What city has the Highest Costs of Housing as Percentage of Income in Illinois?
Riverdale has the Highest Costs of Housing as Percentage of Income in Illinois with 34.5%.
What is the Average Housing Costs as Percentage of Income in the State of Illinois?
Average Housing Costs as Percentage of Income in Illinois is 19.6%.
What is the Average Housing Costs as Percentage of Income in the United States?
Average Housing Costs as Percentage of Income in the United States is 20.4%.