Cities with the Highest Costs of Housing as Percentage of Income in Michigan
RELATED REPORTS & OPTIONS
Highest Housing Costs / Income
Michigan
Compare Cities
Map of Cities with the Highest Costs of Housing as Percentage of Income in Michigan
0.0%
50.0%
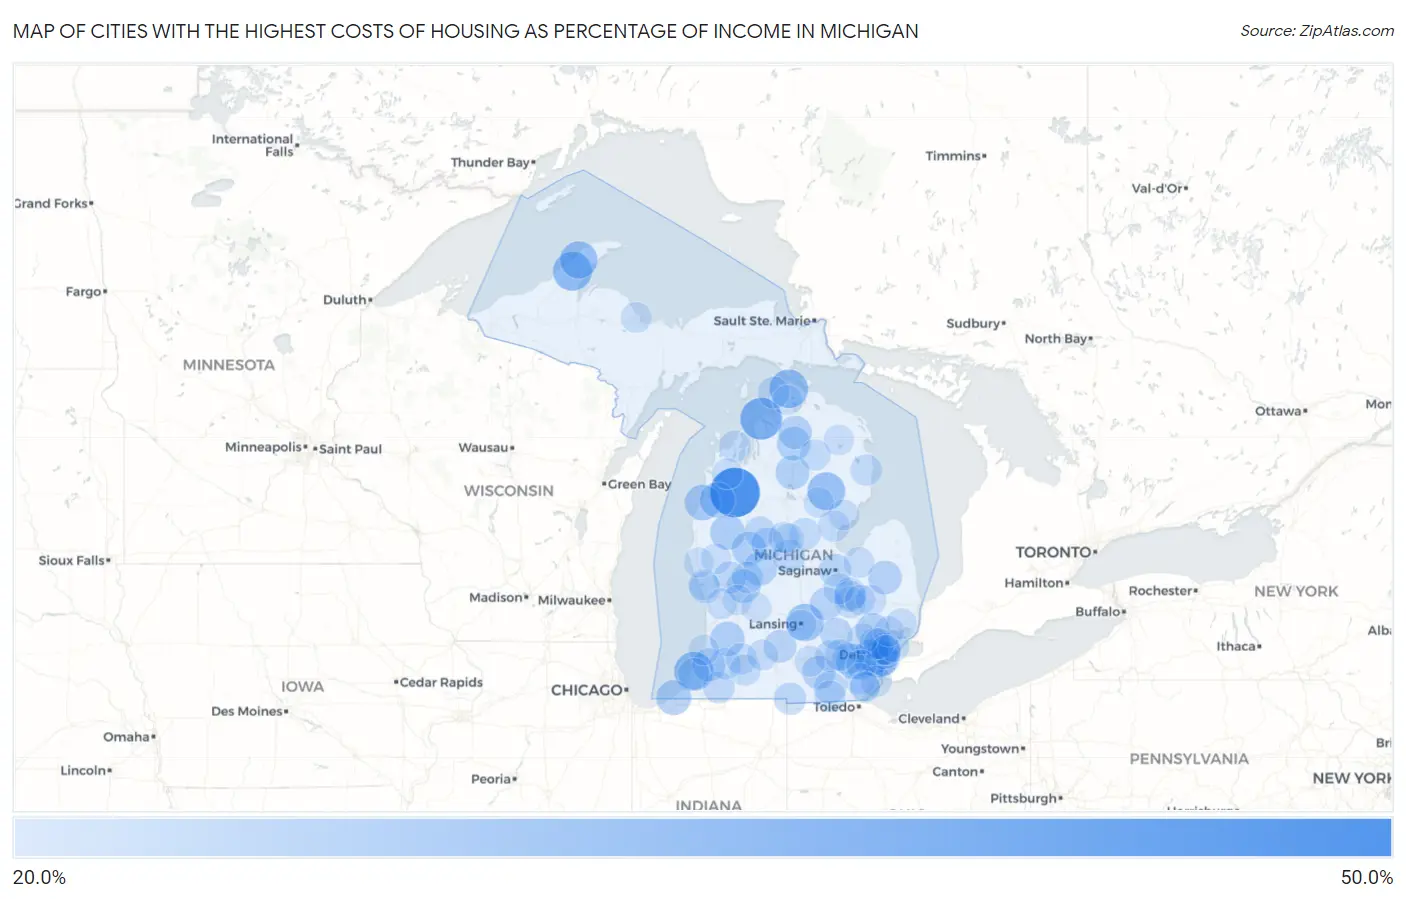
Cities with the Highest Costs of Housing as Percentage of Income in Michigan
| City | Housing Costs / Income | vs State | vs National | |
| 1. | Mesick | 47.3% | 18.2%(+29.0)#1 | 20.4%(+26.9)#94 |
| 2. | Charlevoix | 37.1% | 18.2%(+18.9)#2 | 20.4%(+16.7)#294 |
| 3. | Benton Harbor | 33.4% | 18.2%(+15.2)#3 | 20.4%(+13.1)#512 |
| 4. | Houghton | 33.4% | 18.2%(+15.2)#4 | 20.4%(+13.0)#517 |
| 5. | Carp Lake | 32.9% | 18.2%(+14.6)#5 | 20.4%(+12.5)#576 |
| 6. | Rose City | 31.9% | 18.2%(+13.6)#6 | 20.4%(+11.5)#680 |
| 7. | East Lansing | 31.4% | 18.2%(+13.1)#7 | 20.4%(+11.0)#740 |
| 8. | Melvindale | 31.2% | 18.2%(+13.0)#8 | 20.4%(+10.9)#756 |
| 9. | Calumet | 31.2% | 18.2%(+13.0)#9 | 20.4%(+10.9)#757 |
| 10. | Inkster | 29.8% | 18.2%(+11.6)#10 | 20.4%(+9.45)#1,001 |
| 11. | Parkdale | 28.9% | 18.2%(+10.7)#11 | 20.4%(+8.57)#1,200 |
| 12. | Brethren | 28.7% | 18.2%(+10.5)#12 | 20.4%(+8.32)#1,264 |
| 13. | Ypsilanti | 28.7% | 18.2%(+10.5)#13 | 20.4%(+8.31)#1,269 |
| 14. | Mears | 28.1% | 18.2%(+9.86)#14 | 20.4%(+7.72)#1,455 |
| 15. | Grand Beach | 28.1% | 18.2%(+9.83)#15 | 20.4%(+7.69)#1,463 |
| 16. | Baldwin | 28.0% | 18.2%(+9.72)#16 | 20.4%(+7.58)#1,511 |
| 17. | Allegan | 27.4% | 18.2%(+9.20)#17 | 20.4%(+7.06)#1,709 |
| 18. | Big Rapids | 27.1% | 18.2%(+8.85)#18 | 20.4%(+6.71)#1,852 |
| 19. | River Rouge | 27.0% | 18.2%(+8.73)#19 | 20.4%(+6.59)#1,907 |
| 20. | Lakeview | 26.9% | 18.2%(+8.68)#20 | 20.4%(+6.54)#1,929 |
| 21. | Grayling | 26.9% | 18.2%(+8.63)#21 | 20.4%(+6.49)#1,956 |
| 22. | Pontiac | 26.7% | 18.2%(+8.44)#22 | 20.4%(+6.30)#2,055 |
| 23. | Gaylord | 26.6% | 18.2%(+8.40)#23 | 20.4%(+6.26)#2,072 |
| 24. | Cedar Springs | 26.5% | 18.2%(+8.30)#24 | 20.4%(+6.16)#2,125 |
| 25. | Marlette | 26.4% | 18.2%(+8.20)#25 | 20.4%(+6.06)#2,172 |
| 26. | Detroit | 26.3% | 18.2%(+8.11)#26 | 20.4%(+5.97)#2,215 |
| 27. | Vanderbilt | 26.3% | 18.2%(+8.04)#27 | 20.4%(+5.90)#2,248 |
| 28. | Paris | 26.3% | 18.2%(+8.03)#28 | 20.4%(+5.89)#2,254 |
| 29. | Cambria | 26.2% | 18.2%(+7.92)#29 | 20.4%(+5.78)#2,308 |
| 30. | Brooklyn | 25.9% | 18.2%(+7.64)#30 | 20.4%(+5.50)#2,481 |
| 31. | Hartford | 25.8% | 18.2%(+7.61)#31 | 20.4%(+5.47)#2,498 |
| 32. | Corunna | 25.7% | 18.2%(+7.45)#32 | 20.4%(+5.31)#2,598 |
| 33. | Nunica | 25.5% | 18.2%(+7.31)#33 | 20.4%(+5.17)#2,695 |
| 34. | Olivet | 25.5% | 18.2%(+7.25)#34 | 20.4%(+5.10)#2,735 |
| 35. | Mount Pleasant | 25.3% | 18.2%(+7.06)#35 | 20.4%(+4.92)#2,848 |
| 36. | Saginaw | 25.1% | 18.2%(+6.90)#36 | 20.4%(+4.76)#2,958 |
| 37. | Adrian | 25.0% | 18.2%(+6.80)#37 | 20.4%(+4.66)#3,029 |
| 38. | Highland Park | 25.0% | 18.2%(+6.76)#38 | 20.4%(+4.62)#3,054 |
| 39. | Barryton | 25.0% | 18.2%(+6.72)#39 | 20.4%(+4.58)#3,086 |
| 40. | Chelsea | 24.8% | 18.2%(+6.60)#40 | 20.4%(+4.46)#3,193 |
| 41. | Camden | 24.8% | 18.2%(+6.52)#41 | 20.4%(+4.38)#3,244 |
| 42. | Mount Morris | 24.7% | 18.2%(+6.49)#42 | 20.4%(+4.35)#3,265 |
| 43. | Howell | 24.6% | 18.2%(+6.41)#43 | 20.4%(+4.27)#3,327 |
| 44. | Barnes Lake | 24.6% | 18.2%(+6.35)#44 | 20.4%(+4.21)#3,379 |
| 45. | Grant | 24.6% | 18.2%(+6.33)#45 | 20.4%(+4.19)#3,393 |
| 46. | Trimountain | 24.5% | 18.2%(+6.29)#46 | 20.4%(+4.15)#3,422 |
| 47. | Cross Village | 24.4% | 18.2%(+6.17)#47 | 20.4%(+4.03)#3,515 |
| 48. | Evart | 24.2% | 18.2%(+5.96)#48 | 20.4%(+3.82)#3,704 |
| 49. | Southfield | 24.1% | 18.2%(+5.88)#49 | 20.4%(+3.74)#3,779 |
| 50. | Cassopolis | 24.1% | 18.2%(+5.88)#50 | 20.4%(+3.74)#3,781 |
| 51. | Pierson | 24.0% | 18.2%(+5.76)#51 | 20.4%(+3.62)#3,869 |
| 52. | Fair Plain | 24.0% | 18.2%(+5.73)#52 | 20.4%(+3.59)#3,892 |
| 53. | Ann Arbor | 23.9% | 18.2%(+5.67)#53 | 20.4%(+3.53)#3,948 |
| 54. | Muskegon Heights | 23.9% | 18.2%(+5.62)#54 | 20.4%(+3.48)#3,999 |
| 55. | Lincoln | 23.9% | 18.2%(+5.62)#55 | 20.4%(+3.48)#4,002 |
| 56. | Paw Paw | 23.8% | 18.2%(+5.60)#56 | 20.4%(+3.46)#4,027 |
| 57. | Dexter | 23.8% | 18.2%(+5.53)#57 | 20.4%(+3.39)#4,085 |
| 58. | Beaverton | 23.7% | 18.2%(+5.48)#58 | 20.4%(+3.34)#4,142 |
| 59. | Lake Leelanau | 23.7% | 18.2%(+5.45)#59 | 20.4%(+3.31)#4,176 |
| 60. | Harper Woods | 23.6% | 18.2%(+5.41)#60 | 20.4%(+3.27)#4,215 |
| 61. | Flint | 23.6% | 18.2%(+5.39)#61 | 20.4%(+3.25)#4,239 |
| 62. | Beecher | 23.6% | 18.2%(+5.38)#62 | 20.4%(+3.24)#4,250 |
| 63. | Standish | 23.6% | 18.2%(+5.37)#63 | 20.4%(+3.23)#4,269 |
| 64. | Kalamazoo | 23.6% | 18.2%(+5.35)#64 | 20.4%(+3.21)#4,282 |
| 65. | Maybee | 23.6% | 18.2%(+5.33)#65 | 20.4%(+3.19)#4,293 |
| 66. | Farwell | 23.5% | 18.2%(+5.30)#66 | 20.4%(+3.16)#4,325 |
| 67. | Jasper | 23.5% | 18.2%(+5.27)#67 | 20.4%(+3.13)#4,358 |
| 68. | Lewiston | 23.4% | 18.2%(+5.15)#68 | 20.4%(+3.01)#4,473 |
| 69. | Vicksburg | 23.4% | 18.2%(+5.15)#69 | 20.4%(+3.00)#4,480 |
| 70. | Montrose | 23.3% | 18.2%(+5.05)#70 | 20.4%(+2.91)#4,589 |
| 71. | Estral Beach | 23.2% | 18.2%(+4.97)#71 | 20.4%(+2.83)#4,652 |
| 72. | Bendon | 23.2% | 18.2%(+4.96)#72 | 20.4%(+2.82)#4,664 |
| 73. | New Haven | 23.1% | 18.2%(+4.90)#73 | 20.4%(+2.76)#4,730 |
| 74. | Walled Lake | 23.1% | 18.2%(+4.89)#74 | 20.4%(+2.75)#4,752 |
| 75. | Fairgrove | 23.1% | 18.2%(+4.87)#75 | 20.4%(+2.73)#4,768 |
| 76. | Springfield | 23.1% | 18.2%(+4.84)#76 | 20.4%(+2.70)#4,806 |
| 77. | Clare | 23.0% | 18.2%(+4.79)#77 | 20.4%(+2.65)#4,873 |
| 78. | Jackson | 23.0% | 18.2%(+4.77)#78 | 20.4%(+2.63)#4,892 |
| 79. | Oak Park | 23.0% | 18.2%(+4.74)#79 | 20.4%(+2.60)#4,924 |
| 80. | Muskegon | 23.0% | 18.2%(+4.74)#80 | 20.4%(+2.60)#4,933 |
| 81. | Twining | 23.0% | 18.2%(+4.73)#81 | 20.4%(+2.58)#4,949 |
| 82. | Allendale | 22.9% | 18.2%(+4.64)#82 | 20.4%(+2.50)#5,048 |
| 83. | Trowbridge Park | 22.9% | 18.2%(+4.63)#83 | 20.4%(+2.49)#5,066 |
| 84. | Hesperia | 22.8% | 18.2%(+4.55)#84 | 20.4%(+2.41)#5,169 |
| 85. | Hillman | 22.8% | 18.2%(+4.53)#85 | 20.4%(+2.39)#5,190 |
| 86. | Lapeer | 22.7% | 18.2%(+4.50)#86 | 20.4%(+2.36)#5,223 |
| 87. | South Haven | 22.6% | 18.2%(+4.38)#87 | 20.4%(+2.24)#5,397 |
| 88. | Davison | 22.6% | 18.2%(+4.36)#88 | 20.4%(+2.22)#5,413 |
| 89. | Belleville | 22.6% | 18.2%(+4.36)#89 | 20.4%(+2.22)#5,417 |
| 90. | Lansing | 22.6% | 18.2%(+4.32)#90 | 20.4%(+2.18)#5,462 |
| 91. | West Branch | 22.5% | 18.2%(+4.25)#91 | 20.4%(+2.11)#5,542 |
| 92. | Utica | 22.4% | 18.2%(+4.20)#92 | 20.4%(+2.06)#5,587 |
| 93. | Comstock Park | 22.4% | 18.2%(+4.19)#93 | 20.4%(+2.05)#5,607 |
| 94. | South Monroe | 22.4% | 18.2%(+4.15)#94 | 20.4%(+2.01)#5,663 |
| 95. | Hamtramck | 22.4% | 18.2%(+4.13)#95 | 20.4%(+1.99)#5,683 |
| 96. | Rothbury | 22.3% | 18.2%(+4.10)#96 | 20.4%(+1.96)#5,737 |
| 97. | Lowell | 22.3% | 18.2%(+4.05)#97 | 20.4%(+1.91)#5,793 |
| 98. | Pellston | 22.3% | 18.2%(+4.03)#98 | 20.4%(+1.89)#5,813 |
| 99. | Lake Gogebic | 22.2% | 18.2%(+4.01)#99 | 20.4%(+1.87)#5,855 |
| 100. | West Monroe | 22.2% | 18.2%(+3.99)#100 | 20.4%(+1.85)#5,888 |
Common Questions
What are the Top 10 Cities with the Highest Costs of Housing as Percentage of Income in Michigan?
Top 10 Cities with the Highest Costs of Housing as Percentage of Income in Michigan are:
#1
47.3%
#2
37.1%
#3
33.4%
#4
33.4%
#5
32.9%
#6
31.9%
#7
31.4%
#8
31.2%
#9
31.2%
#10
29.8%
What city has the Highest Costs of Housing as Percentage of Income in Michigan?
Mesick has the Highest Costs of Housing as Percentage of Income in Michigan with 47.3%.
What is the Average Housing Costs as Percentage of Income in the State of Michigan?
Average Housing Costs as Percentage of Income in Michigan is 18.2%.
What is the Average Housing Costs as Percentage of Income in the United States?
Average Housing Costs as Percentage of Income in the United States is 20.4%.