Cities with the Highest Costs of Housing as Percentage of Income in Iowa
RELATED REPORTS & OPTIONS
Highest Housing Costs / Income
Iowa
Compare Cities
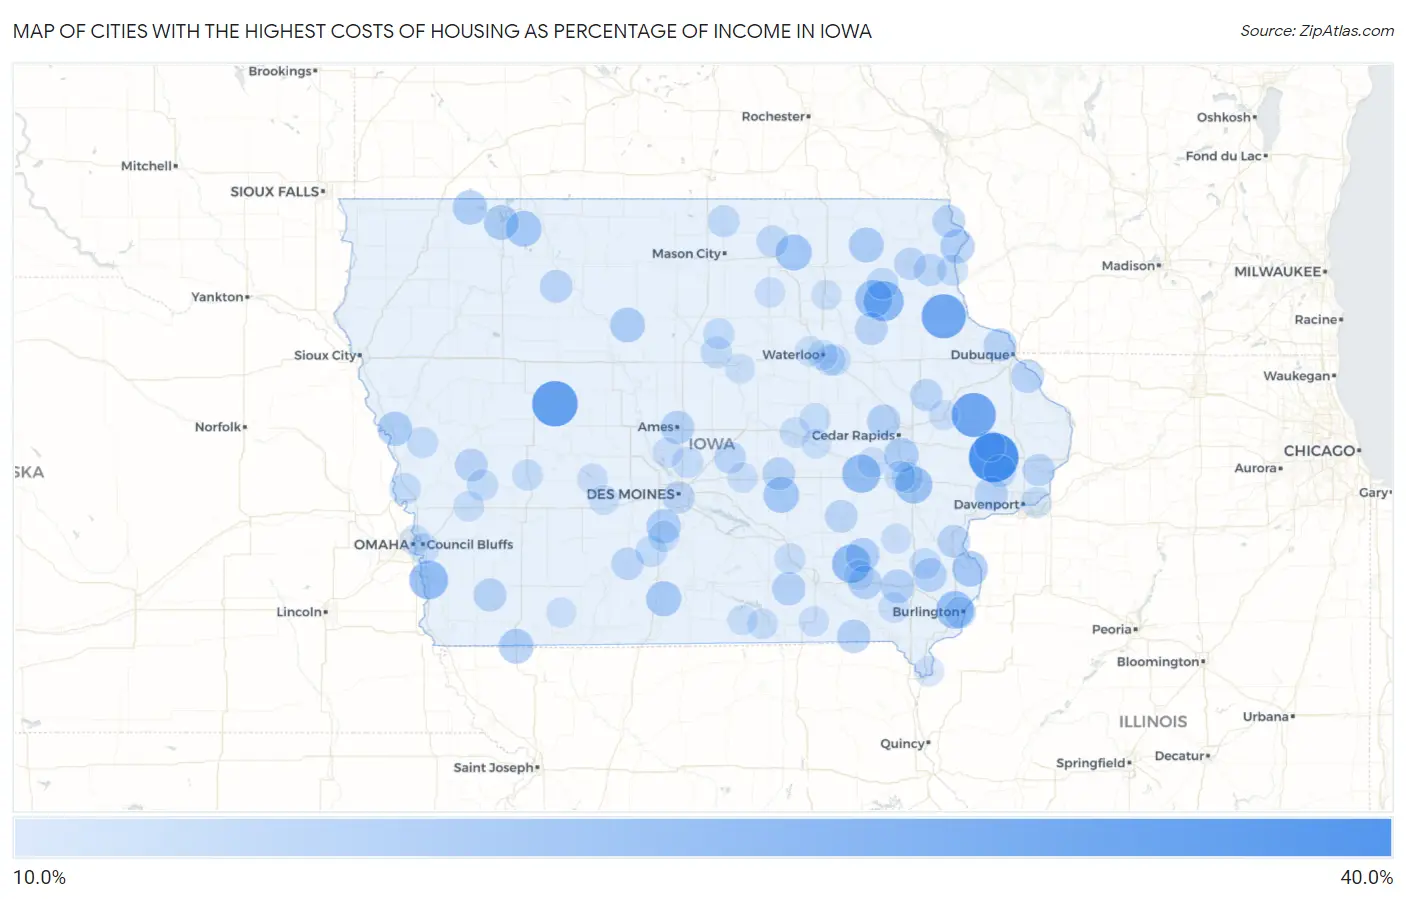
Map of Cities with the Highest Costs of Housing as Percentage of Income in Iowa
0.0%
40.0%
Cities with the Highest Costs of Housing as Percentage of Income in Iowa
| City | Housing Costs / Income | vs State | vs National | |
| 1. | Wheatland | 35.7% | 16.7%(+19.0)#1 | 20.4%(+15.4)#365 |
| 2. | Lanesboro | 32.3% | 16.7%(+15.6)#2 | 20.4%(+12.0)#627 |
| 3. | Elkport | 31.1% | 16.7%(+14.4)#3 | 20.4%(+10.7)#782 |
| 4. | Onslow | 31.0% | 16.7%(+14.3)#4 | 20.4%(+10.6)#797 |
| 5. | Fayette | 27.5% | 16.7%(+10.8)#5 | 20.4%(+7.11)#1,684 |
| 6. | Moscow | 27.0% | 16.7%(+10.3)#6 | 20.4%(+6.67)#1,872 |
| 7. | Pacific Junction | 26.4% | 16.7%(+9.64)#7 | 20.4%(+5.98)#2,213 |
| 8. | Packwood | 26.2% | 16.7%(+9.51)#8 | 20.4%(+5.85)#2,280 |
| 9. | Conroy | 26.0% | 16.7%(+9.32)#9 | 20.4%(+5.66)#2,370 |
| 10. | West Burlington | 25.5% | 16.7%(+8.79)#10 | 20.4%(+5.13)#2,718 |
| 11. | Randalia | 25.3% | 16.7%(+8.54)#11 | 20.4%(+4.88)#2,873 |
| 12. | Iowa City | 25.1% | 16.7%(+8.34)#12 | 20.4%(+4.68)#3,008 |
| 13. | Colwell | 24.2% | 16.7%(+7.45)#13 | 20.4%(+3.79)#3,737 |
| 14. | Terril | 23.9% | 16.7%(+7.18)#14 | 20.4%(+3.52)#3,967 |
| 15. | Searsboro | 23.8% | 16.7%(+7.12)#15 | 20.4%(+3.46)#4,033 |
| 16. | Oakville | 23.8% | 16.7%(+7.04)#16 | 20.4%(+3.38)#4,097 |
| 17. | Weldon | 23.4% | 16.7%(+6.71)#17 | 20.4%(+3.05)#4,448 |
| 18. | Spillville | 23.2% | 16.7%(+6.51)#18 | 20.4%(+2.85)#4,645 |
| 19. | West Okoboji | 23.2% | 16.7%(+6.45)#19 | 20.4%(+2.79)#4,705 |
| 20. | Thor | 23.1% | 16.7%(+6.35)#20 | 20.4%(+2.69)#4,817 |
| 21. | Braddyville | 23.0% | 16.7%(+6.31)#21 | 20.4%(+2.65)#4,870 |
| 22. | Shueyville | 22.9% | 16.7%(+6.19)#22 | 20.4%(+2.53)#5,017 |
| 23. | Harris | 22.8% | 16.7%(+6.08)#23 | 20.4%(+2.42)#5,152 |
| 24. | Onawa | 22.8% | 16.7%(+6.07)#24 | 20.4%(+2.41)#5,165 |
| 25. | Martensdale | 22.7% | 16.7%(+6.01)#25 | 20.4%(+2.35)#5,238 |
| 26. | Harpers Ferry | 22.7% | 16.7%(+5.98)#26 | 20.4%(+2.32)#5,275 |
| 27. | Richland | 22.6% | 16.7%(+5.89)#27 | 20.4%(+2.23)#5,405 |
| 28. | Rome | 22.1% | 16.7%(+5.43)#28 | 20.4%(+1.77)#5,992 |
| 29. | Fairfield | 22.1% | 16.7%(+5.40)#29 | 20.4%(+1.74)#6,035 |
| 30. | Cantril | 22.0% | 16.7%(+5.29)#30 | 20.4%(+1.63)#6,198 |
| 31. | Mount Union | 22.0% | 16.7%(+5.28)#31 | 20.4%(+1.61)#6,217 |
| 32. | Ames | 22.0% | 16.7%(+5.25)#32 | 20.4%(+1.59)#6,263 |
| 33. | Blakesburg | 21.9% | 16.7%(+5.23)#33 | 20.4%(+1.57)#6,291 |
| 34. | Palo | 21.9% | 16.7%(+5.21)#34 | 20.4%(+1.55)#6,311 |
| 35. | St Donatus | 21.9% | 16.7%(+5.17)#35 | 20.4%(+1.51)#6,377 |
| 36. | Stockton | 21.8% | 16.7%(+5.11)#36 | 20.4%(+1.45)#6,468 |
| 37. | Durango | 21.7% | 16.7%(+4.95)#37 | 20.4%(+1.29)#6,675 |
| 38. | Coburg | 21.6% | 16.7%(+4.93)#38 | 20.4%(+1.27)#6,704 |
| 39. | Mallard | 21.5% | 16.7%(+4.75)#39 | 20.4%(+1.09)#6,982 |
| 40. | Earling | 21.5% | 16.7%(+4.74)#40 | 20.4%(+1.08)#6,997 |
| 41. | Grandview | 21.4% | 16.7%(+4.73)#41 | 20.4%(+1.07)#7,006 |
| 42. | Oelwein | 21.4% | 16.7%(+4.67)#42 | 20.4%(+1.01)#7,086 |
| 43. | Grinnell | 21.4% | 16.7%(+4.66)#43 | 20.4%(+1.00)#7,099 |
| 44. | Lansing | 21.4% | 16.7%(+4.66)#44 | 20.4%(+0.995)#7,107 |
| 45. | Webster | 21.3% | 16.7%(+4.63)#45 | 20.4%(+0.972)#7,148 |
| 46. | Dixon | 21.1% | 16.7%(+4.40)#46 | 20.4%(+0.744)#7,519 |
| 47. | Prairieburg | 21.1% | 16.7%(+4.36)#47 | 20.4%(+0.698)#7,609 |
| 48. | Lorimor | 21.1% | 16.7%(+4.36)#48 | 20.4%(+0.695)#7,613 |
| 49. | Mccausland | 21.0% | 16.7%(+4.33)#49 | 20.4%(+0.673)#7,643 |
| 50. | Monona | 21.0% | 16.7%(+4.31)#50 | 20.4%(+0.650)#7,692 |
| 51. | Postville | 21.0% | 16.7%(+4.31)#51 | 20.4%(+0.647)#7,696 |
| 52. | Des Moines | 21.0% | 16.7%(+4.25)#52 | 20.4%(+0.593)#7,783 |
| 53. | Baxter | 20.9% | 16.7%(+4.15)#53 | 20.4%(+0.494)#7,961 |
| 54. | Orchard | 20.8% | 16.7%(+4.09)#54 | 20.4%(+0.432)#8,048 |
| 55. | Kensett | 20.7% | 16.7%(+4.02)#55 | 20.4%(+0.358)#8,166 |
| 56. | West Union | 20.6% | 16.7%(+3.93)#56 | 20.4%(+0.268)#8,334 |
| 57. | Burlington | 20.6% | 16.7%(+3.90)#57 | 20.4%(+0.241)#8,385 |
| 58. | Truro | 20.5% | 16.7%(+3.81)#58 | 20.4%(+0.152)#8,544 |
| 59. | Iowa Falls | 20.5% | 16.7%(+3.74)#59 | 20.4%(+0.082)#8,671 |
| 60. | Modale | 20.5% | 16.7%(+3.74)#60 | 20.4%(+0.078)#8,677 |
| 61. | Coralville | 20.3% | 16.7%(+3.58)#61 | 20.4%(-0.077)#8,949 |
| 62. | Harlan | 20.3% | 16.7%(+3.57)#62 | 20.4%(-0.087)#8,971 |
| 63. | Raymond | 20.3% | 16.7%(+3.56)#63 | 20.4%(-0.104)#9,008 |
| 64. | Elkhart | 20.3% | 16.7%(+3.54)#64 | 20.4%(-0.119)#9,045 |
| 65. | Bradford | 20.2% | 16.7%(+3.51)#65 | 20.4%(-0.148)#9,097 |
| 66. | St Marys | 20.2% | 16.7%(+3.48)#66 | 20.4%(-0.177)#9,155 |
| 67. | Marquette | 20.2% | 16.7%(+3.48)#67 | 20.4%(-0.177)#9,156 |
| 68. | Clutier | 20.2% | 16.7%(+3.44)#68 | 20.4%(-0.216)#9,234 |
| 69. | Winfield | 20.1% | 16.7%(+3.43)#69 | 20.4%(-0.231)#9,267 |
| 70. | Moorhead | 20.1% | 16.7%(+3.38)#70 | 20.4%(-0.282)#9,342 |
| 71. | Tiffin | 20.1% | 16.7%(+3.38)#71 | 20.4%(-0.284)#9,345 |
| 72. | Riverdale | 20.1% | 16.7%(+3.38)#72 | 20.4%(-0.285)#9,348 |
| 73. | Audubon | 20.1% | 16.7%(+3.36)#73 | 20.4%(-0.299)#9,377 |
| 74. | Evansdale | 20.0% | 16.7%(+3.27)#74 | 20.4%(-0.388)#9,537 |
| 75. | Council Bluffs | 19.9% | 16.7%(+3.19)#75 | 20.4%(-0.467)#9,678 |
| 76. | Eddyville | 19.9% | 16.7%(+3.17)#76 | 20.4%(-0.486)#9,710 |
| 77. | Shelby | 19.9% | 16.7%(+3.15)#77 | 20.4%(-0.511)#9,756 |
| 78. | Hillsboro | 19.8% | 16.7%(+3.12)#78 | 20.4%(-0.536)#9,809 |
| 79. | Carter Lake | 19.8% | 16.7%(+3.11)#79 | 20.4%(-0.555)#9,850 |
| 80. | Toledo | 19.8% | 16.7%(+3.04)#80 | 20.4%(-0.621)#9,980 |
| 81. | Toronto | 19.8% | 16.7%(+3.04)#81 | 20.4%(-0.623)#9,984 |
| 82. | Centerville | 19.7% | 16.7%(+3.03)#82 | 20.4%(-0.634)#10,011 |
| 83. | Waterloo | 19.7% | 16.7%(+2.98)#83 | 20.4%(-0.680)#10,088 |
| 84. | Middle Amana | 19.7% | 16.7%(+2.97)#84 | 20.4%(-0.688)#10,109 |
| 85. | Bloomfield | 19.6% | 16.7%(+2.90)#85 | 20.4%(-0.757)#10,242 |
| 86. | Panora | 19.6% | 16.7%(+2.86)#86 | 20.4%(-0.805)#10,348 |
| 87. | Anamosa | 19.5% | 16.7%(+2.83)#87 | 20.4%(-0.831)#10,412 |
| 88. | Newton | 19.5% | 16.7%(+2.82)#88 | 20.4%(-0.841)#10,442 |
| 89. | Plano | 19.5% | 16.7%(+2.81)#89 | 20.4%(-0.846)#10,457 |
| 90. | Keokuk | 19.5% | 16.7%(+2.81)#90 | 20.4%(-0.851)#10,468 |
| 91. | Washington | 19.5% | 16.7%(+2.77)#91 | 20.4%(-0.886)#10,533 |
| 92. | Sheldahl | 19.5% | 16.7%(+2.75)#92 | 20.4%(-0.915)#10,598 |
| 93. | Greene | 19.5% | 16.7%(+2.74)#93 | 20.4%(-0.923)#10,615 |
| 94. | Diamondhead Lake | 19.5% | 16.7%(+2.74)#94 | 20.4%(-0.923)#10,617 |
| 95. | Steamboat Rock | 19.4% | 16.7%(+2.72)#95 | 20.4%(-0.939)#10,644 |
| 96. | Cedar Falls | 19.4% | 16.7%(+2.72)#96 | 20.4%(-0.942)#10,651 |
| 97. | Sharpsburg | 19.4% | 16.7%(+2.66)#97 | 20.4%(-1.00)#10,772 |
| 98. | Maharishi Vedic City | 19.3% | 16.7%(+2.63)#98 | 20.4%(-1.03)#10,815 |
| 99. | Chelsea | 19.3% | 16.7%(+2.61)#99 | 20.4%(-1.05)#10,856 |
| 100. | Frederika | 19.3% | 16.7%(+2.59)#100 | 20.4%(-1.07)#10,916 |
Common Questions
What are the Top 10 Cities with the Highest Costs of Housing as Percentage of Income in Iowa?
Top 10 Cities with the Highest Costs of Housing as Percentage of Income in Iowa are:
#1
35.7%
#2
32.3%
#3
31.1%
#4
31.0%
#5
27.5%
#6
26.4%
#7
26.2%
#8
26.0%
#9
25.5%
#10
25.3%
What city has the Highest Costs of Housing as Percentage of Income in Iowa?
Wheatland has the Highest Costs of Housing as Percentage of Income in Iowa with 35.7%.
What is the Average Housing Costs as Percentage of Income in the State of Iowa?
Average Housing Costs as Percentage of Income in Iowa is 16.7%.
What is the Average Housing Costs as Percentage of Income in the United States?
Average Housing Costs as Percentage of Income in the United States is 20.4%.