Cities with the Highest Costs of Housing as Percentage of Income in Montana
RELATED REPORTS & OPTIONS
Highest Housing Costs / Income
Montana
Compare Cities
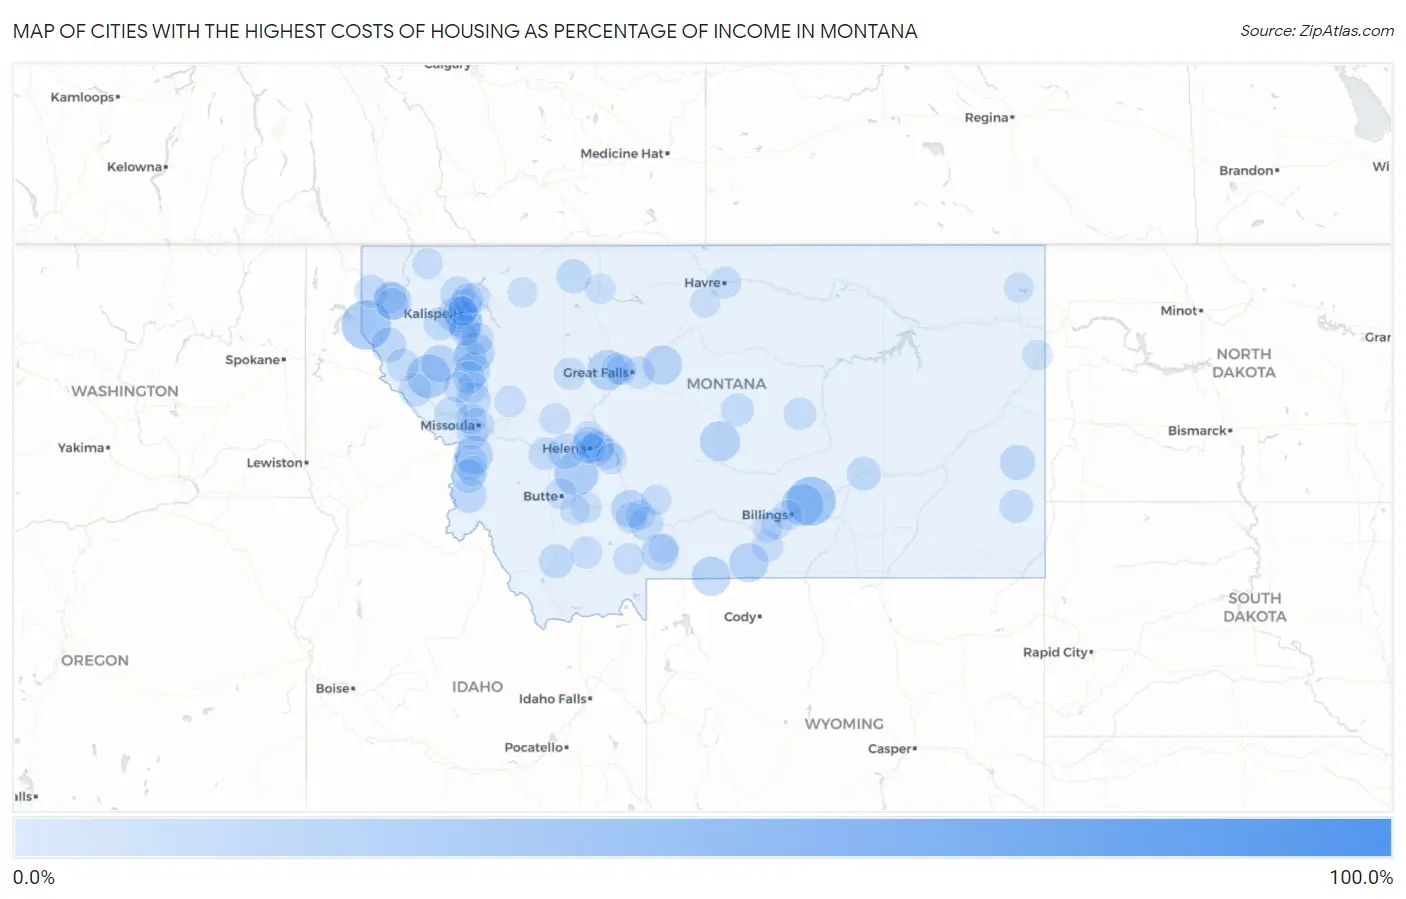
Map of Cities with the Highest Costs of Housing as Percentage of Income in Montana
0.0%
100.0%
Cities with the Highest Costs of Housing as Percentage of Income in Montana
| City | Housing Costs / Income | vs State | vs National | |
| 1. | Moccasin | 100.0% | 18.2%(+81.8)#1 | 20.4%(+79.6)#13 |
| 2. | Jackson | 58.1% | 18.2%(+40.0)#2 | 20.4%(+37.8)#52 |
| 3. | Heron | 43.5% | 18.2%(+25.3)#3 | 20.4%(+23.1)#135 |
| 4. | Ballantine | 42.7% | 18.2%(+24.5)#4 | 20.4%(+22.3)#147 |
| 5. | Tracy | 40.8% | 18.2%(+22.6)#5 | 20.4%(+20.4)#175 |
| 6. | Basin | 36.6% | 18.2%(+18.4)#6 | 20.4%(+16.2)#319 |
| 7. | Plains | 36.2% | 18.2%(+18.0)#7 | 20.4%(+15.8)#341 |
| 8. | Huntley | 34.0% | 18.2%(+15.8)#8 | 20.4%(+13.6)#471 |
| 9. | Judith Gap | 31.9% | 18.2%(+13.7)#9 | 20.4%(+11.5)#677 |
| 10. | Sun River | 31.7% | 18.2%(+13.6)#10 | 20.4%(+11.4)#699 |
| 11. | Red Lodge | 30.6% | 18.2%(+12.4)#11 | 20.4%(+10.2)#870 |
| 12. | Finley Point | 30.5% | 18.2%(+12.3)#12 | 20.4%(+10.1)#891 |
| 13. | Cooke City | 30.4% | 18.2%(+12.2)#13 | 20.4%(+10.0)#897 |
| 14. | Highwood | 30.3% | 18.2%(+12.1)#14 | 20.4%(+9.94)#909 |
| 15. | Stevensville | 29.5% | 18.2%(+11.3)#15 | 20.4%(+9.15)#1,064 |
| 16. | White Haven | 28.7% | 18.2%(+10.5)#16 | 20.4%(+8.30)#1,272 |
| 17. | Hot Springs | 28.6% | 18.2%(+10.4)#17 | 20.4%(+8.19)#1,303 |
| 18. | Manhattan | 28.5% | 18.2%(+10.4)#18 | 20.4%(+8.17)#1,307 |
| 19. | South Glastonbury | 27.9% | 18.2%(+9.69)#19 | 20.4%(+7.50)#1,549 |
| 20. | Forest Hill Village | 27.0% | 18.2%(+8.85)#20 | 20.4%(+6.65)#1,888 |
| 21. | Elliston | 26.2% | 18.2%(+8.02)#21 | 20.4%(+5.82)#2,292 |
| 22. | Batavia | 26.2% | 18.2%(+7.99)#22 | 20.4%(+5.80)#2,300 |
| 23. | Darby | 26.0% | 18.2%(+7.83)#23 | 20.4%(+5.64)#2,391 |
| 24. | Ronan | 25.9% | 18.2%(+7.73)#24 | 20.4%(+5.53)#2,455 |
| 25. | Plevna | 25.8% | 18.2%(+7.62)#25 | 20.4%(+5.43)#2,528 |
| 26. | Somers | 25.6% | 18.2%(+7.40)#26 | 20.4%(+5.20)#2,675 |
| 27. | Trout Creek | 25.5% | 18.2%(+7.34)#27 | 20.4%(+5.15)#2,707 |
| 28. | Victor | 25.4% | 18.2%(+7.21)#28 | 20.4%(+5.01)#2,782 |
| 29. | Arlee | 25.2% | 18.2%(+7.01)#29 | 20.4%(+4.82)#2,918 |
| 30. | Dillon | 24.7% | 18.2%(+6.51)#30 | 20.4%(+4.32)#3,300 |
| 31. | Whitefish | 24.7% | 18.2%(+6.50)#31 | 20.4%(+4.30)#3,308 |
| 32. | Cut Bank | 24.6% | 18.2%(+6.42)#32 | 20.4%(+4.22)#3,369 |
| 33. | Bozeman | 24.4% | 18.2%(+6.27)#33 | 20.4%(+4.07)#3,482 |
| 34. | Hysham | 24.0% | 18.2%(+5.85)#34 | 20.4%(+3.65)#3,855 |
| 35. | Wise River | 23.9% | 18.2%(+5.69)#35 | 20.4%(+3.49)#3,985 |
| 36. | Polson | 23.8% | 18.2%(+5.62)#36 | 20.4%(+3.42)#4,060 |
| 37. | Kalispell | 23.7% | 18.2%(+5.56)#37 | 20.4%(+3.36)#4,113 |
| 38. | Blackfoot | 23.7% | 18.2%(+5.55)#38 | 20.4%(+3.36)#4,124 |
| 39. | Missoula | 23.7% | 18.2%(+5.55)#39 | 20.4%(+3.35)#4,128 |
| 40. | Alberton | 23.7% | 18.2%(+5.51)#40 | 20.4%(+3.31)#4,172 |
| 41. | Hamilton | 23.7% | 18.2%(+5.50)#41 | 20.4%(+3.30)#4,184 |
| 42. | East Helena | 23.6% | 18.2%(+5.43)#42 | 20.4%(+3.23)#4,258 |
| 43. | Ekalaka | 23.5% | 18.2%(+5.32)#43 | 20.4%(+3.12)#4,371 |
| 44. | St Regis | 23.5% | 18.2%(+5.28)#44 | 20.4%(+3.08)#4,419 |
| 45. | Twin Creeks | 23.3% | 18.2%(+5.15)#45 | 20.4%(+2.95)#4,547 |
| 46. | Marion | 23.2% | 18.2%(+5.02)#46 | 20.4%(+2.83)#4,661 |
| 47. | Zurich | 23.1% | 18.2%(+4.92)#47 | 20.4%(+2.72)#4,784 |
| 48. | Troy | 23.0% | 18.2%(+4.81)#48 | 20.4%(+2.61)#4,909 |
| 49. | Garrison | 23.0% | 18.2%(+4.81)#49 | 20.4%(+2.61)#4,915 |
| 50. | Lewistown | 23.0% | 18.2%(+4.79)#50 | 20.4%(+2.59)#4,944 |
| 51. | Thompson Falls | 22.9% | 18.2%(+4.69)#51 | 20.4%(+2.50)#5,055 |
| 52. | Charlo | 22.7% | 18.2%(+4.55)#52 | 20.4%(+2.36)#5,228 |
| 53. | Helena Flats | 22.7% | 18.2%(+4.50)#53 | 20.4%(+2.31)#5,310 |
| 54. | Helena Valley Southeast | 22.7% | 18.2%(+4.49)#54 | 20.4%(+2.29)#5,330 |
| 55. | Bear Dance | 22.5% | 18.2%(+4.33)#55 | 20.4%(+2.13)#5,511 |
| 56. | Helena West Side | 22.4% | 18.2%(+4.26)#56 | 20.4%(+2.06)#5,595 |
| 57. | Malmstrom Afb | 22.3% | 18.2%(+4.16)#57 | 20.4%(+1.97)#5,724 |
| 58. | Winnett | 22.3% | 18.2%(+4.12)#58 | 20.4%(+1.92)#5,774 |
| 59. | Libby | 22.2% | 18.2%(+4.06)#59 | 20.4%(+1.86)#5,868 |
| 60. | Augusta | 22.0% | 18.2%(+3.83)#60 | 20.4%(+1.63)#6,194 |
| 61. | Havre North | 21.9% | 18.2%(+3.70)#61 | 20.4%(+1.50)#6,398 |
| 62. | Alder | 21.8% | 18.2%(+3.66)#62 | 20.4%(+1.46)#6,449 |
| 63. | Vaughn | 21.7% | 18.2%(+3.50)#63 | 20.4%(+1.30)#6,653 |
| 64. | Pioneer Junction | 21.6% | 18.2%(+3.41)#64 | 20.4%(+1.21)#6,794 |
| 65. | Lolo | 21.3% | 18.2%(+3.15)#65 | 20.4%(+0.953)#7,181 |
| 66. | Helena Valley West Central | 21.3% | 18.2%(+3.09)#66 | 20.4%(+0.896)#7,283 |
| 67. | Churchill | 21.2% | 18.2%(+2.98)#67 | 20.4%(+0.779)#7,468 |
| 68. | St Ignatius | 21.1% | 18.2%(+2.94)#68 | 20.4%(+0.744)#7,517 |
| 69. | Lakeside | 21.1% | 18.2%(+2.91)#69 | 20.4%(+0.716)#7,568 |
| 70. | Fromberg | 21.0% | 18.2%(+2.82)#70 | 20.4%(+0.619)#7,738 |
| 71. | Big Sky | 21.0% | 18.2%(+2.81)#71 | 20.4%(+0.611)#7,756 |
| 72. | Seeley Lake | 21.0% | 18.2%(+2.78)#72 | 20.4%(+0.583)#7,807 |
| 73. | Walkerville | 20.8% | 18.2%(+2.58)#73 | 20.4%(+0.387)#8,119 |
| 74. | Spokane Creek | 20.7% | 18.2%(+2.56)#74 | 20.4%(+0.366)#8,155 |
| 75. | Columbia Falls | 20.6% | 18.2%(+2.44)#75 | 20.4%(+0.238)#8,391 |
| 76. | Wye | 20.6% | 18.2%(+2.38)#76 | 20.4%(+0.185)#8,486 |
| 77. | Lincoln | 20.6% | 18.2%(+2.38)#77 | 20.4%(+0.184)#8,490 |
| 78. | Winston | 20.5% | 18.2%(+2.31)#78 | 20.4%(+0.112)#8,627 |
| 79. | Whitehall | 20.5% | 18.2%(+2.30)#79 | 20.4%(+0.108)#8,634 |
| 80. | Wolf Creek | 20.4% | 18.2%(+2.26)#80 | 20.4%(+0.060)#8,704 |
| 81. | Laurel | 20.4% | 18.2%(+2.22)#81 | 20.4%(+0.020)#8,790 |
| 82. | Sedan | 20.4% | 18.2%(+2.19)#82 | 20.4%(-0.002)#8,825 |
| 83. | Fortine | 20.3% | 18.2%(+2.12)#83 | 20.4%(-0.079)#8,952 |
| 84. | Dixon | 20.1% | 18.2%(+1.94)#84 | 20.4%(-0.256)#9,296 |
| 85. | Hungry Horse | 20.0% | 18.2%(+1.80)#85 | 20.4%(-0.401)#9,559 |
| 86. | Belgrade | 20.0% | 18.2%(+1.79)#86 | 20.4%(-0.412)#9,576 |
| 87. | Emigrant | 20.0% | 18.2%(+1.79)#87 | 20.4%(-0.412)#9,578 |
| 88. | Shelby | 19.9% | 18.2%(+1.68)#88 | 20.4%(-0.518)#9,769 |
| 89. | Sun Prairie | 19.8% | 18.2%(+1.66)#89 | 20.4%(-0.533)#9,800 |
| 90. | Helena Valley Northwest | 19.8% | 18.2%(+1.63)#90 | 20.4%(-0.570)#9,884 |
| 91. | Sidney | 19.8% | 18.2%(+1.59)#91 | 20.4%(-0.607)#9,951 |
| 92. | Corvallis | 19.6% | 18.2%(+1.44)#92 | 20.4%(-0.760)#10,250 |
| 93. | Rader Creek | 19.6% | 18.2%(+1.42)#93 | 20.4%(-0.778)#10,280 |
| 94. | Box Elder | 19.6% | 18.2%(+1.41)#94 | 20.4%(-0.785)#10,297 |
| 95. | Park City | 19.6% | 18.2%(+1.39)#95 | 20.4%(-0.807)#10,356 |
| 96. | Helena | 19.4% | 18.2%(+1.21)#96 | 20.4%(-0.986)#10,736 |
| 97. | Billings | 19.4% | 18.2%(+1.21)#97 | 20.4%(-0.987)#10,739 |
| 98. | Medicine Lake | 19.3% | 18.2%(+1.16)#98 | 20.4%(-1.03)#10,827 |
| 99. | East Glacier Park Village | 19.3% | 18.2%(+1.12)#99 | 20.4%(-1.08)#10,917 |
| 100. | Evergreen | 19.3% | 18.2%(+1.12)#100 | 20.4%(-1.08)#10,927 |
Common Questions
What are the Top 10 Cities with the Highest Costs of Housing as Percentage of Income in Montana?
Top 10 Cities with the Highest Costs of Housing as Percentage of Income in Montana are:
#1
43.5%
#2
42.7%
#3
36.6%
#4
36.2%
#5
34.0%
#6
31.9%
#7
31.7%
#8
30.6%
#9
30.5%
#10
30.4%
What city has the Highest Costs of Housing as Percentage of Income in Montana?
Heron has the Highest Costs of Housing as Percentage of Income in Montana with 43.5%.
What is the Average Housing Costs as Percentage of Income in the State of Montana?
Average Housing Costs as Percentage of Income in Montana is 18.2%.
What is the Average Housing Costs as Percentage of Income in the United States?
Average Housing Costs as Percentage of Income in the United States is 20.4%.