North Sultan, WA Map & Demographics
North Sultan Map
North Sultan Overview
$43,979
PER CAPITA INCOME
$142,083
AVG FAMILY INCOME
$142,083
AVG HOUSEHOLD INCOME
29.9%
WAGE / INCOME GAP [ % ]
70.1¢/ $1
WAGE / INCOME GAP [ $ ]
0.37
INEQUALITY / GINI INDEX
336
TOTAL POPULATION
124
MALE POPULATION
212
FEMALE POPULATION
58.49
MALES / 100 FEMALES
170.97
FEMALES / 100 MALES
31.8
MEDIAN AGE
3.5
AVG FAMILY SIZE
3.5
AVG HOUSEHOLD SIZE
168
LABOR FORCE [ PEOPLE ]
68.3%
PERCENT IN LABOR FORCE
Income in North Sultan
Income Overview in North Sultan
Per Capita Income in North Sultan is $43,979, while median incomes of families and households are $142,083 and $142,083 respectively.
| Characteristic | Number | Measure |
| Per Capita Income | 336 | $43,979 |
| Median Family Income | 97 | $142,083 |
| Mean Family Income | 97 | $144,669 |
| Median Household Income | 97 | $142,083 |
| Mean Household Income | 97 | $144,669 |
| Income Deficit | 97 | $0 |
| Wage / Income Gap (%) | 336 | 29.91% |
| Wage / Income Gap ($) | 336 | 70.09¢ per $1 |
| Gini / Inequality Index | 336 | 0.37 |
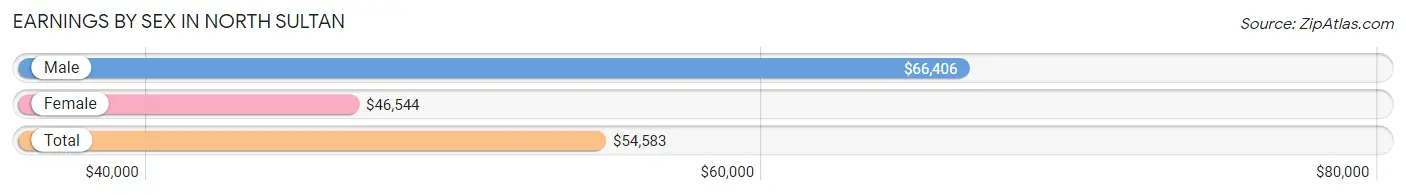
Earnings by Sex in North Sultan
Average Earnings in North Sultan are $54,583, $66,406 for men and $46,544 for women, a difference of 29.9%.
| Sex | Number | Average Earnings |
| Male | 104 (58.1%) | $66,406 |
| Female | 75 (41.9%) | $46,544 |
| Total | 179 (100.0%) | $54,583 |
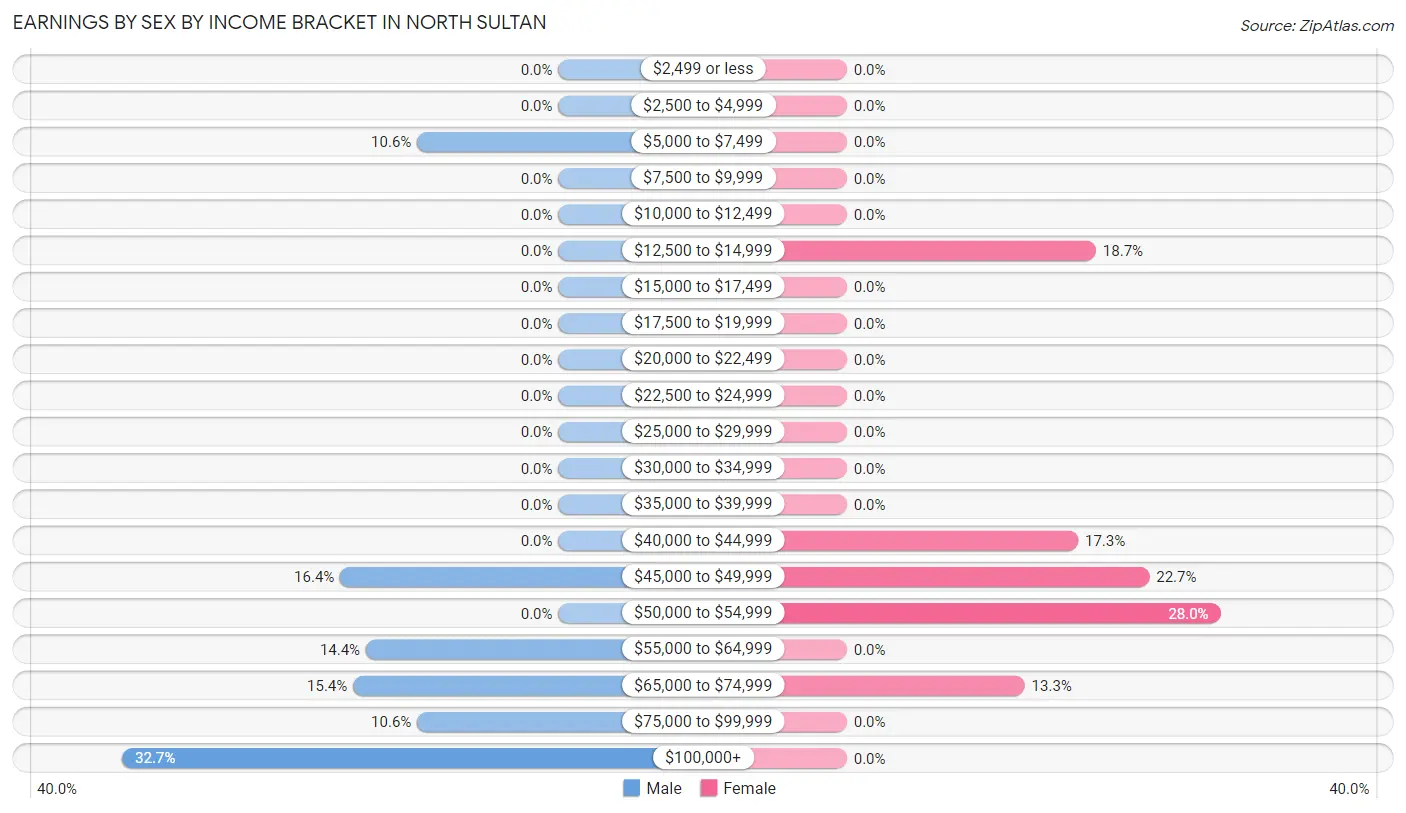
Earnings by Sex by Income Bracket in North Sultan
The most common earnings brackets in North Sultan are $100,000+ for men (34 | 32.7%) and $50,000 to $54,999 for women (21 | 28.0%).
| Income | Male | Female |
| $2,499 or less | 0 (0.0%) | 0 (0.0%) |
| $2,500 to $4,999 | 0 (0.0%) | 0 (0.0%) |
| $5,000 to $7,499 | 11 (10.6%) | 0 (0.0%) |
| $7,500 to $9,999 | 0 (0.0%) | 0 (0.0%) |
| $10,000 to $12,499 | 0 (0.0%) | 0 (0.0%) |
| $12,500 to $14,999 | 0 (0.0%) | 14 (18.7%) |
| $15,000 to $17,499 | 0 (0.0%) | 0 (0.0%) |
| $17,500 to $19,999 | 0 (0.0%) | 0 (0.0%) |
| $20,000 to $22,499 | 0 (0.0%) | 0 (0.0%) |
| $22,500 to $24,999 | 0 (0.0%) | 0 (0.0%) |
| $25,000 to $29,999 | 0 (0.0%) | 0 (0.0%) |
| $30,000 to $34,999 | 0 (0.0%) | 0 (0.0%) |
| $35,000 to $39,999 | 0 (0.0%) | 0 (0.0%) |
| $40,000 to $44,999 | 0 (0.0%) | 13 (17.3%) |
| $45,000 to $49,999 | 17 (16.4%) | 17 (22.7%) |
| $50,000 to $54,999 | 0 (0.0%) | 21 (28.0%) |
| $55,000 to $64,999 | 15 (14.4%) | 0 (0.0%) |
| $65,000 to $74,999 | 16 (15.4%) | 10 (13.3%) |
| $75,000 to $99,999 | 11 (10.6%) | 0 (0.0%) |
| $100,000+ | 34 (32.7%) | 0 (0.0%) |
| Total | 104 (100.0%) | 75 (100.0%) |
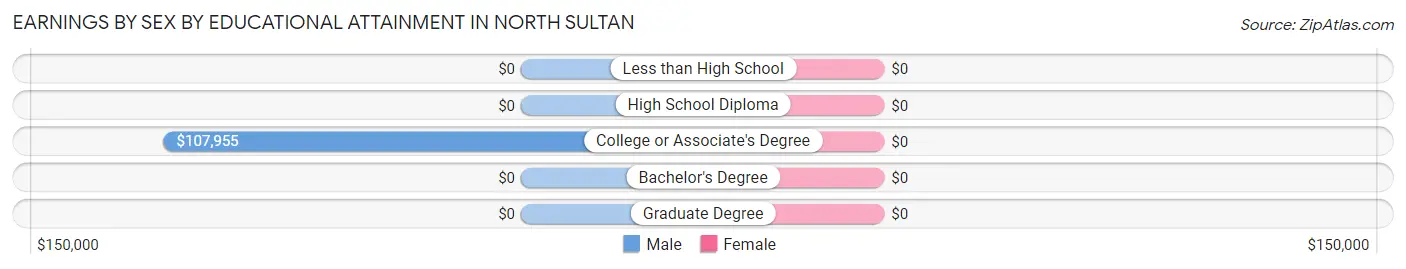
Earnings by Sex by Educational Attainment in North Sultan
| Educational Attainment | Male Income | Female Income |
| Less than High School | - | - |
| High School Diploma | - | - |
| College or Associate's Degree | $107,955 | $0 |
| Bachelor's Degree | - | - |
| Graduate Degree | - | - |
| Total | $67,266 | $46,544 |
Family Income in North Sultan
Family Income Brackets in North Sultan
According to the North Sultan family income data, there are 27 families falling into the $75,000 to $99,999 income range, which is the most common income bracket and makes up 27.8% of all families.
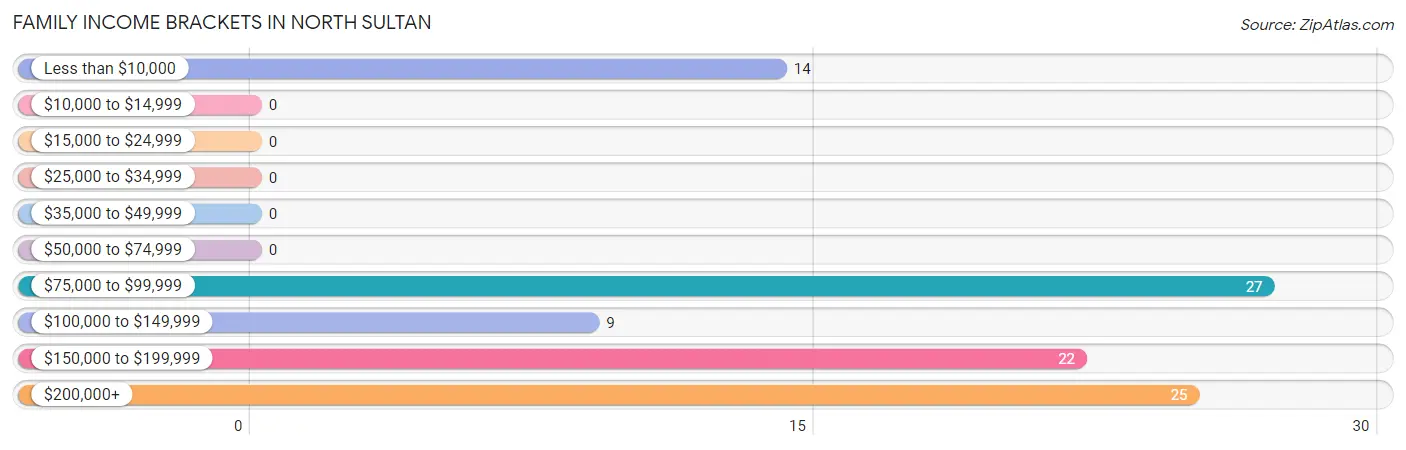
| Income Bracket | # Families | % Families |
| Less than $10,000 | 14 | 14.4% |
| $10,000 to $14,999 | 0 | 0.0% |
| $15,000 to $24,999 | 0 | 0.0% |
| $25,000 to $34,999 | 0 | 0.0% |
| $35,000 to $49,999 | 0 | 0.0% |
| $50,000 to $74,999 | 0 | 0.0% |
| $75,000 to $99,999 | 27 | 27.8% |
| $100,000 to $149,999 | 9 | 9.3% |
| $150,000 to $199,999 | 22 | 22.7% |
| $200,000+ | 25 | 25.8% |
Family Income by Famaliy Size in North Sultan
3-person families (55 | 56.7%) account for the highest median family income in North Sultan with $163,011 per family, while 3-person families (55 | 56.7%) have the highest median income of $54,337 per family member.
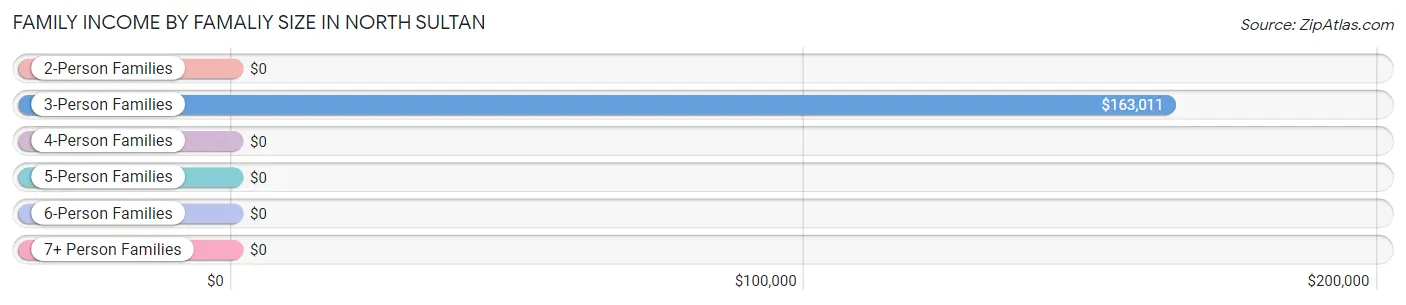
| Income Bracket | # Families | Median Income |
| 2-Person Families | 0 (0.0%) | $0 |
| 3-Person Families | 55 (56.7%) | $163,011 |
| 4-Person Families | 31 (32.0%) | $0 |
| 5-Person Families | 11 (11.3%) | $0 |
| 6-Person Families | 0 (0.0%) | $0 |
| 7+ Person Families | 0 (0.0%) | $0 |
| Total | 97 (100.0%) | $142,083 |
Family Income by Number of Earners in North Sultan
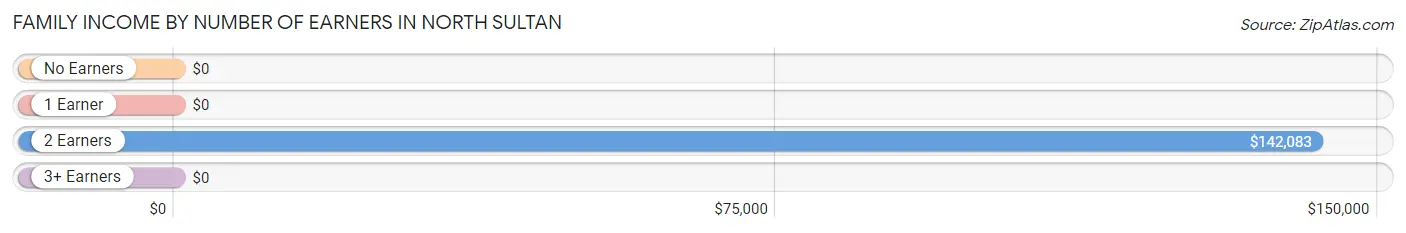
| Number of Earners | # Families | Median Income |
| No Earners | 14 (14.4%) | $0 |
| 1 Earner | 21 (21.6%) | $0 |
| 2 Earners | 47 (48.4%) | $142,083 |
| 3+ Earners | 15 (15.5%) | $0 |
| Total | 97 (100.0%) | $142,083 |
Household Income in North Sultan
Household Income Brackets in North Sultan
With 27 households falling in the category, the $75,000 to $99,999 income range is the most frequent in North Sultan, accounting for 27.8% of all households.
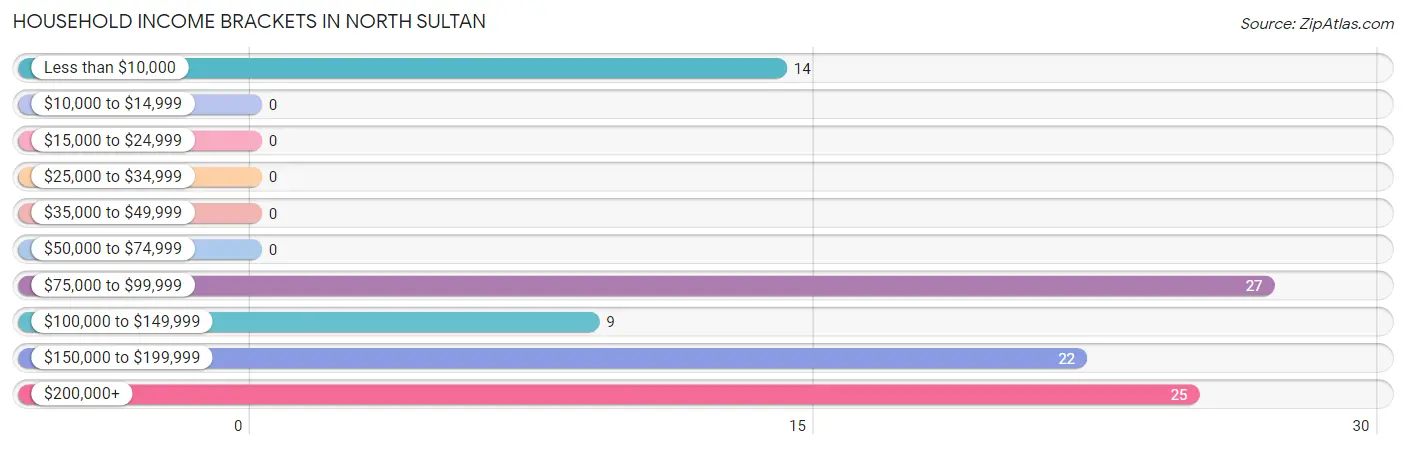
| Income Bracket | # Households | % Households |
| Less than $10,000 | 14 | 14.4% |
| $10,000 to $14,999 | 0 | 0.0% |
| $15,000 to $24,999 | 0 | 0.0% |
| $25,000 to $34,999 | 0 | 0.0% |
| $35,000 to $49,999 | 0 | 0.0% |
| $50,000 to $74,999 | 0 | 0.0% |
| $75,000 to $99,999 | 27 | 27.8% |
| $100,000 to $149,999 | 9 | 9.3% |
| $150,000 to $199,999 | 22 | 22.7% |
| $200,000+ | 25 | 25.8% |
Household Income by Householder Age in North Sultan
The median household income in North Sultan is $142,083, with the highest median household income of $221,333 found in the 65+ years age bracket for the primary householder. A total of 34 households (35.0%) fall into this category.
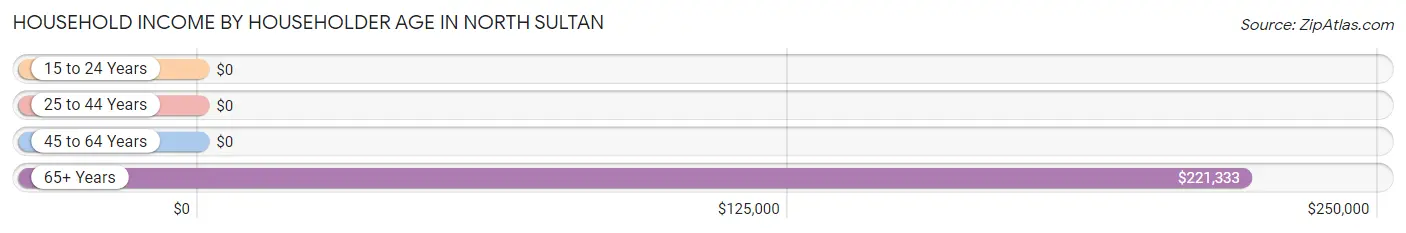
| Income Bracket | # Households | Median Income |
| 15 to 24 Years | 0 (0.0%) | $0 |
| 25 to 44 Years | 52 (53.6%) | $0 |
| 45 to 64 Years | 11 (11.3%) | $0 |
| 65+ Years | 34 (35.0%) | $221,333 |
| Total | 97 (100.0%) | $142,083 |
Poverty in North Sultan
Income Below Poverty by Sex and Age in North Sultan
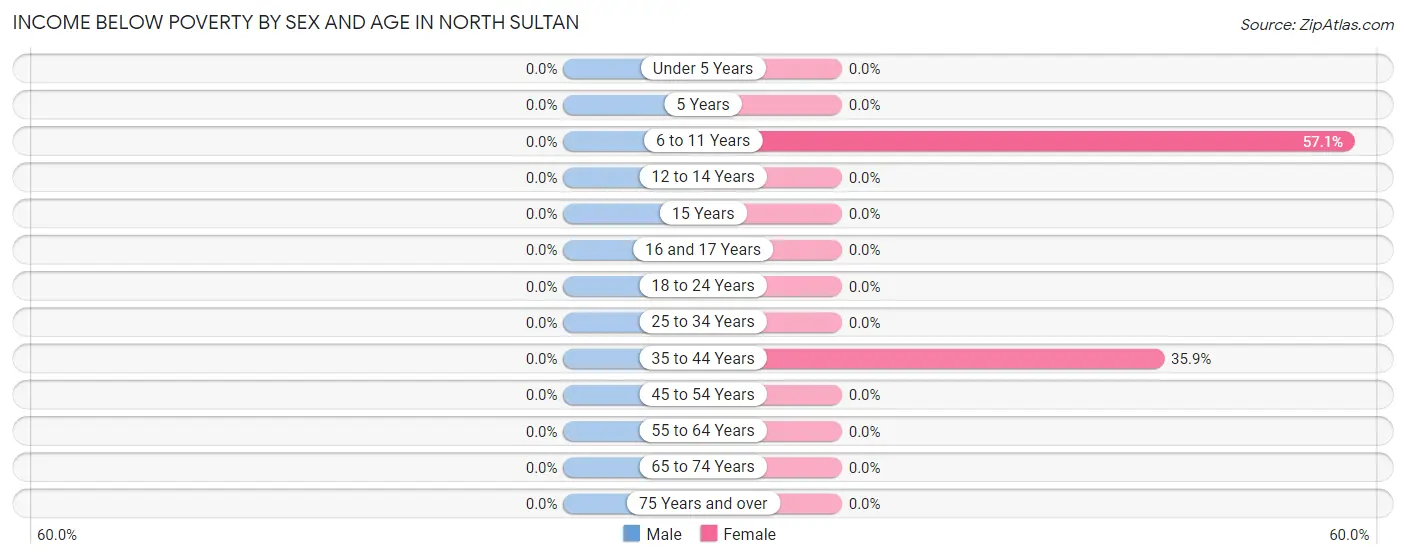
| Age Bracket | Male | Female |
| Under 5 Years | 0 (0.0%) | 0 (0.0%) |
| 5 Years | 0 (0.0%) | 0 (0.0%) |
| 6 to 11 Years | 0 (0.0%) | 20 (57.1%) |
| 12 to 14 Years | 0 (0.0%) | 0 (0.0%) |
| 15 Years | 0 (0.0%) | 0 (0.0%) |
| 16 and 17 Years | 0 (0.0%) | 0 (0.0%) |
| 18 to 24 Years | 0 (0.0%) | 0 (0.0%) |
| 25 to 34 Years | 0 (0.0%) | 0 (0.0%) |
| 35 to 44 Years | 0 (0.0%) | 14 (35.9%) |
| 45 to 54 Years | 0 (0.0%) | 0 (0.0%) |
| 55 to 64 Years | 0 (0.0%) | 0 (0.0%) |
| 65 to 74 Years | 0 (0.0%) | 0 (0.0%) |
| 75 Years and over | 0 (0.0%) | 0 (0.0%) |
| Total | 0 (0.0%) | 34 (16.0%) |
Income Above Poverty by Sex and Age in North Sultan
According to the poverty statistics in North Sultan, males aged 12 to 14 years and females aged under 5 years are the age groups that are most secure financially, with 100.0% of males and 100.0% of females in these age groups living above the poverty line.
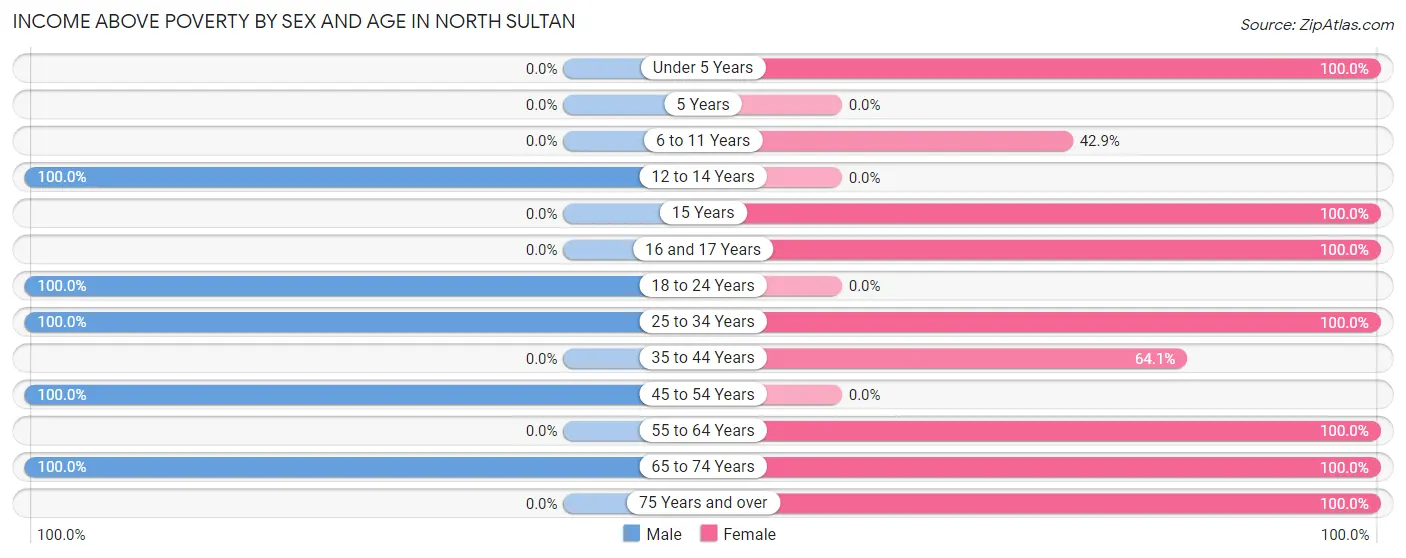
| Age Bracket | Male | Female |
| Under 5 Years | 0 (0.0%) | 33 (100.0%) |
| 5 Years | 0 (0.0%) | 0 (0.0%) |
| 6 to 11 Years | 0 (0.0%) | 15 (42.9%) |
| 12 to 14 Years | 11 (100.0%) | 0 (0.0%) |
| 15 Years | 0 (0.0%) | 11 (100.0%) |
| 16 and 17 Years | 0 (0.0%) | 11 (100.0%) |
| 18 to 24 Years | 11 (100.0%) | 0 (0.0%) |
| 25 to 34 Years | 55 (100.0%) | 38 (100.0%) |
| 35 to 44 Years | 0 (0.0%) | 25 (64.1%) |
| 45 to 54 Years | 11 (100.0%) | 0 (0.0%) |
| 55 to 64 Years | 0 (0.0%) | 22 (100.0%) |
| 65 to 74 Years | 36 (100.0%) | 13 (100.0%) |
| 75 Years and over | 0 (0.0%) | 10 (100.0%) |
| Total | 124 (100.0%) | 178 (84.0%) |
Income Below Poverty Among Married-Couple Families in North Sultan
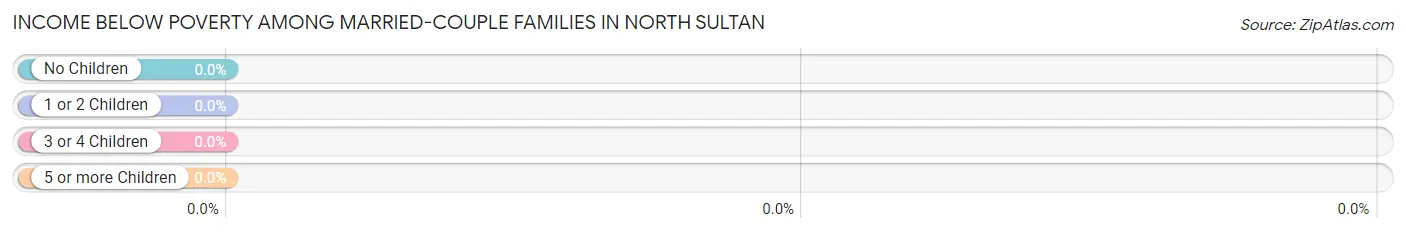
| Children | Above Poverty | Below Poverty |
| No Children | 24 (100.0%) | 0 (0.0%) |
| 1 or 2 Children | 38 (100.0%) | 0 (0.0%) |
| 3 or 4 Children | 11 (100.0%) | 0 (0.0%) |
| 5 or more Children | 0 (0.0%) | 0 (0.0%) |
| Total | 73 (100.0%) | 0 (0.0%) |
Income Below Poverty Among Single-Parent Households in North Sultan
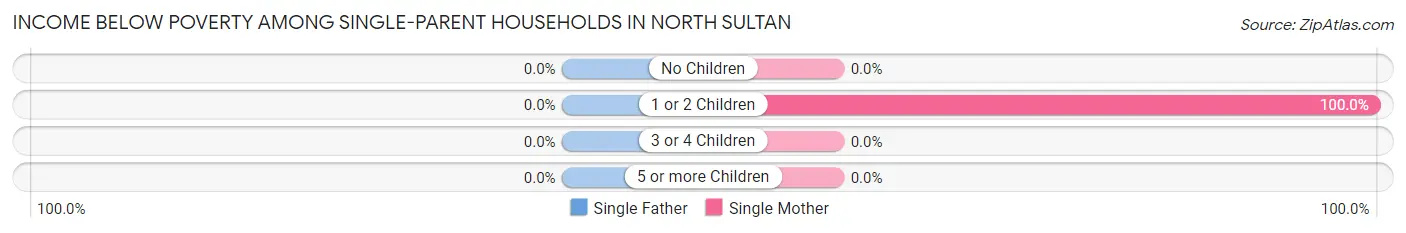
| Children | Single Father | Single Mother |
| No Children | 0 (0.0%) | 0 (0.0%) |
| 1 or 2 Children | 0 (0.0%) | 14 (100.0%) |
| 3 or 4 Children | 0 (0.0%) | 0 (0.0%) |
| 5 or more Children | 0 (0.0%) | 0 (0.0%) |
| Total | 0 (0.0%) | 14 (58.3%) |
Income Below Poverty Among Married-Couple vs Single-Parent Households in North Sultan
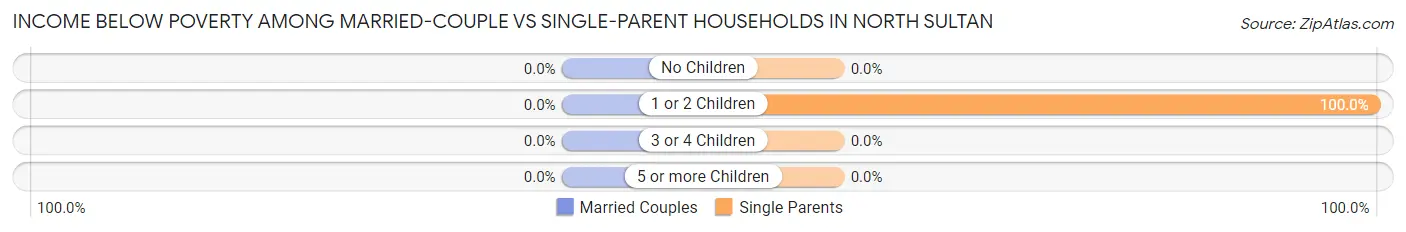
| Children | Married-Couple Families | Single-Parent Households |
| No Children | 0 (0.0%) | 0 (0.0%) |
| 1 or 2 Children | 0 (0.0%) | 14 (100.0%) |
| 3 or 4 Children | 0 (0.0%) | 0 (0.0%) |
| 5 or more Children | 0 (0.0%) | 0 (0.0%) |
| Total | 0 (0.0%) | 14 (58.3%) |
Race in North Sultan
The most populous races in North Sultan are White / Caucasian (316 | 94.1%), and Two or more Races (20 | 5.9%).
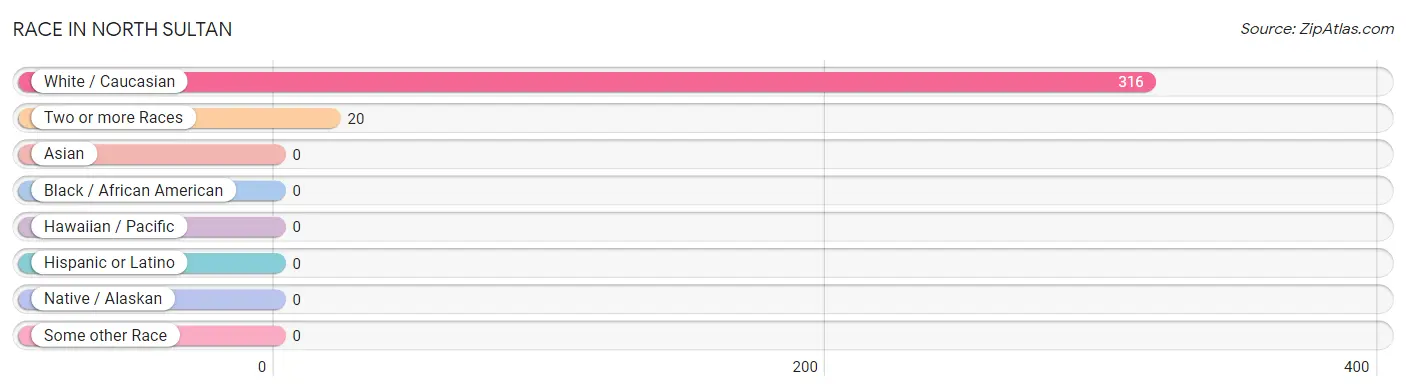
| Race | # Population | % Population |
| Asian | 0 | 0.0% |
| Black / African American | 0 | 0.0% |
| Hawaiian / Pacific | 0 | 0.0% |
| Hispanic or Latino | 0 | 0.0% |
| Native / Alaskan | 0 | 0.0% |
| White / Caucasian | 316 | 94.1% |
| Two or more Races | 20 | 5.9% |
| Some other Race | 0 | 0.0% |
| Total | 336 | 100.0% |
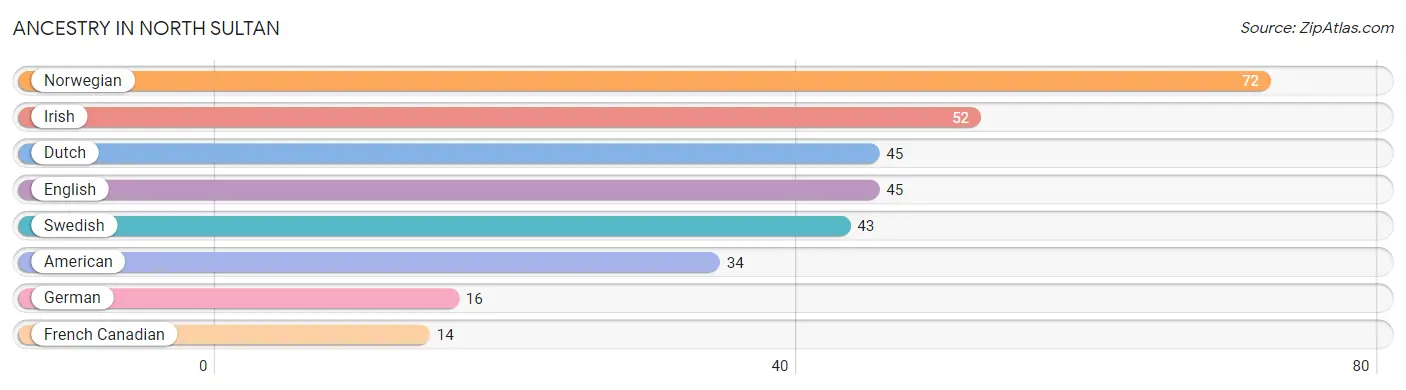
Ancestry in North Sultan
The most populous ancestries reported in North Sultan are Norwegian (72 | 21.4%), Irish (52 | 15.5%), Dutch (45 | 13.4%), English (45 | 13.4%), and Swedish (43 | 12.8%), together accounting for 76.5% of all North Sultan residents.
| Ancestry | # Population | % Population |
| American | 34 | 10.1% |
| Dutch | 45 | 13.4% |
| English | 45 | 13.4% |
| French Canadian | 14 | 4.2% |
| German | 16 | 4.8% |
| Irish | 52 | 15.5% |
| Norwegian | 72 | 21.4% |
| Swedish | 43 | 12.8% | View All 8 Rows |
Immigrants in North Sultan

| Immigration Origin | # Population | % Population | View All 0 Rows |
Sex and Age in North Sultan
Sex and Age in North Sultan
The most populous age groups in North Sultan are 65 to 69 Years (36 | 29.0%) for men and Under 5 Years (33 | 15.6%) for women.
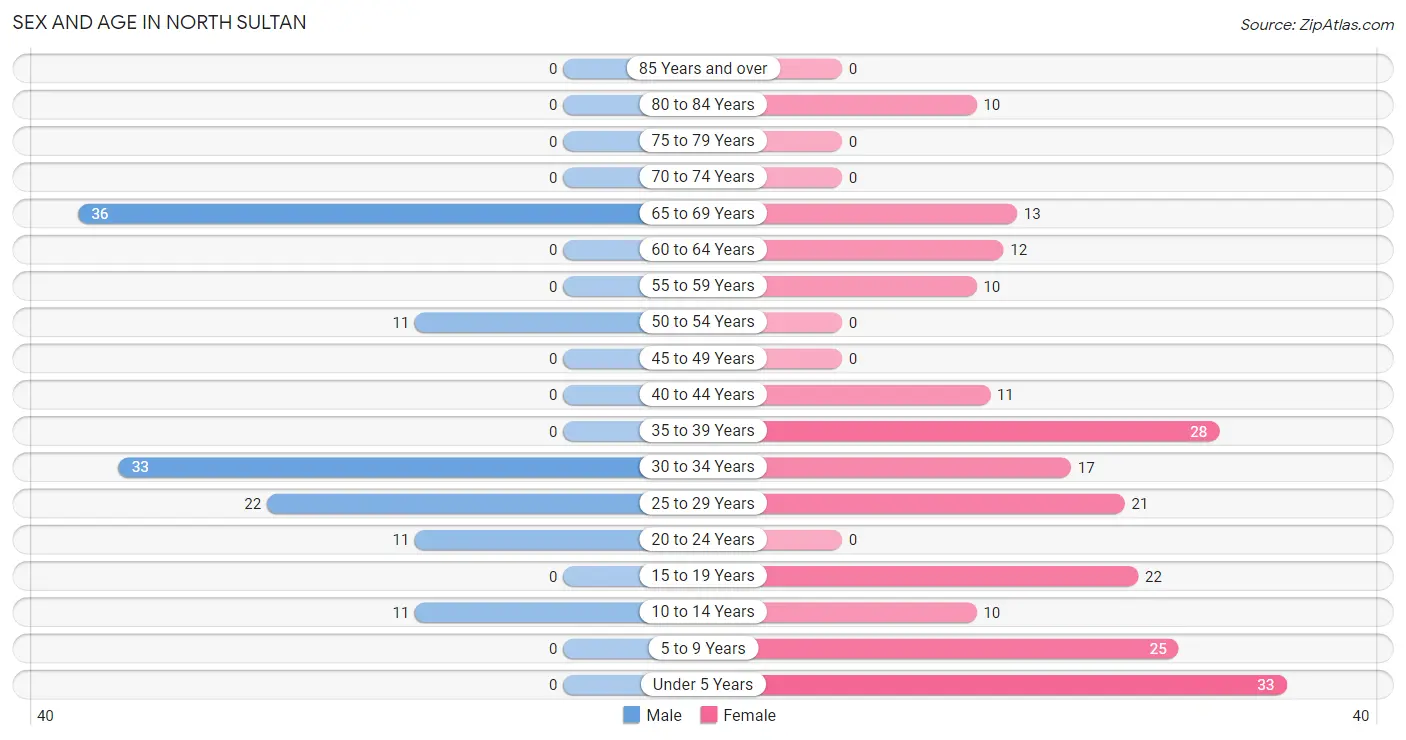
| Age Bracket | Male | Female |
| Under 5 Years | 0 (0.0%) | 33 (15.6%) |
| 5 to 9 Years | 0 (0.0%) | 25 (11.8%) |
| 10 to 14 Years | 11 (8.9%) | 10 (4.7%) |
| 15 to 19 Years | 0 (0.0%) | 22 (10.4%) |
| 20 to 24 Years | 11 (8.9%) | 0 (0.0%) |
| 25 to 29 Years | 22 (17.7%) | 21 (9.9%) |
| 30 to 34 Years | 33 (26.6%) | 17 (8.0%) |
| 35 to 39 Years | 0 (0.0%) | 28 (13.2%) |
| 40 to 44 Years | 0 (0.0%) | 11 (5.2%) |
| 45 to 49 Years | 0 (0.0%) | 0 (0.0%) |
| 50 to 54 Years | 11 (8.9%) | 0 (0.0%) |
| 55 to 59 Years | 0 (0.0%) | 10 (4.7%) |
| 60 to 64 Years | 0 (0.0%) | 12 (5.7%) |
| 65 to 69 Years | 36 (29.0%) | 13 (6.1%) |
| 70 to 74 Years | 0 (0.0%) | 0 (0.0%) |
| 75 to 79 Years | 0 (0.0%) | 0 (0.0%) |
| 80 to 84 Years | 0 (0.0%) | 10 (4.7%) |
| 85 Years and over | 0 (0.0%) | 0 (0.0%) |
| Total | 124 (100.0%) | 212 (100.0%) |
Families and Households in North Sultan
Median Family Size in North Sultan
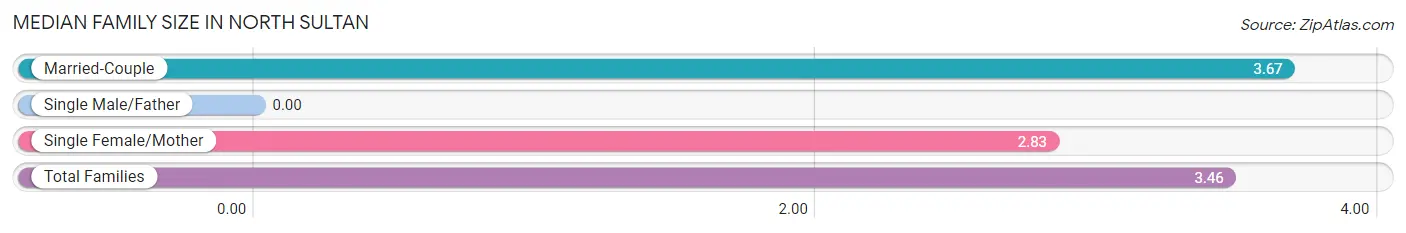
| Family Type | # Families | Family Size |
| Married-Couple | 73 (75.3%) | 3.67 |
| Single Male/Father | 0 (0.0%) | - |
| Single Female/Mother | 24 (24.7%) | 2.83 |
| Total Families | 97 (100.0%) | 3.46 |
Median Household Size in North Sultan
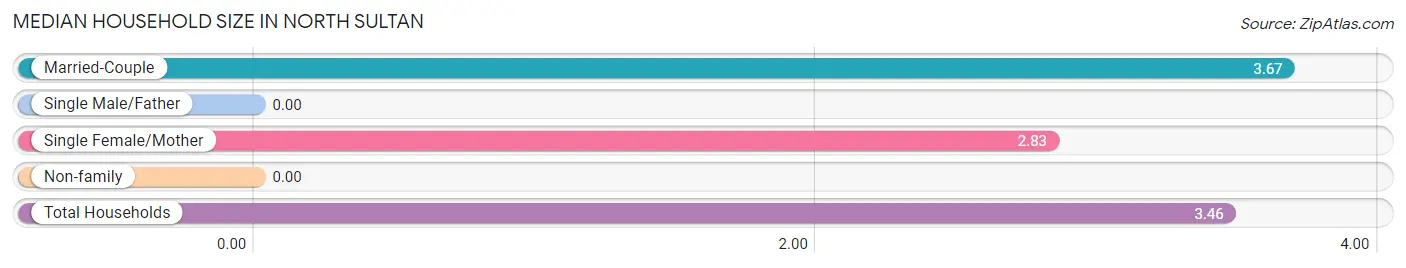
| Household Type | # Households | Household Size |
| Married-Couple | 73 (75.3%) | 3.67 |
| Single Male/Father | 0 (0.0%) | - |
| Single Female/Mother | 24 (24.7%) | 2.83 |
| Non-family | 0 (0.0%) | - |
| Total Households | 97 (100.0%) | 3.46 |
Household Size by Marriage Status in North Sultan
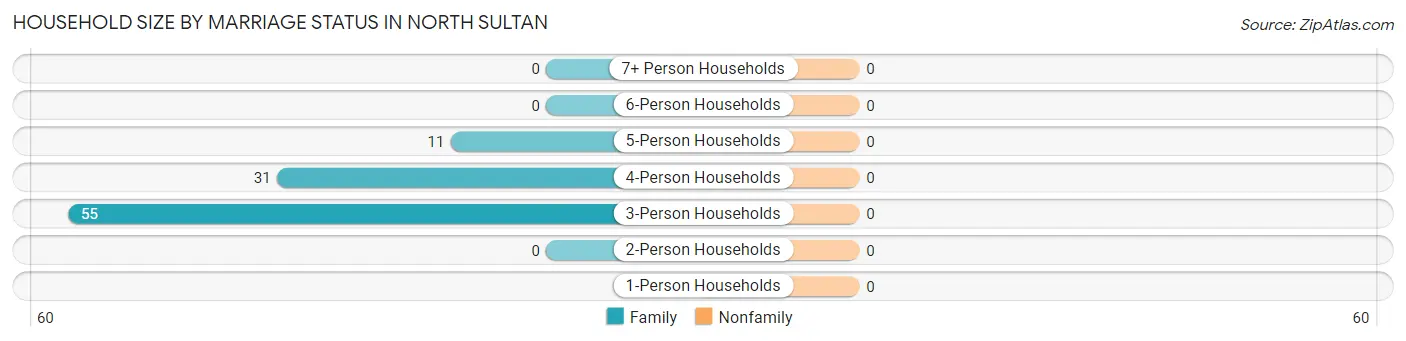
| Household Size | Family Households | Nonfamily Households |
| 1-Person Households | - | 0 (0.0%) |
| 2-Person Households | 0 (0.0%) | 0 (0.0%) |
| 3-Person Households | 55 (56.7%) | 0 (0.0%) |
| 4-Person Households | 31 (32.0%) | 0 (0.0%) |
| 5-Person Households | 11 (11.3%) | 0 (0.0%) |
| 6-Person Households | 0 (0.0%) | 0 (0.0%) |
| 7+ Person Households | 0 (0.0%) | 0 (0.0%) |
| Total | 97 (100.0%) | 0 (0.0%) |
Female Fertility in North Sultan
Fertility by Age in North Sultan
Average fertility rate in North Sultan is 212.0 births per 1,000 women. Women in the age bracket of 20 to 34 years have the highest fertility rate with 553.0 births per 1,000 women. Women in the age bracket of 20 to 34 years acount for 100.0% of all women with births.
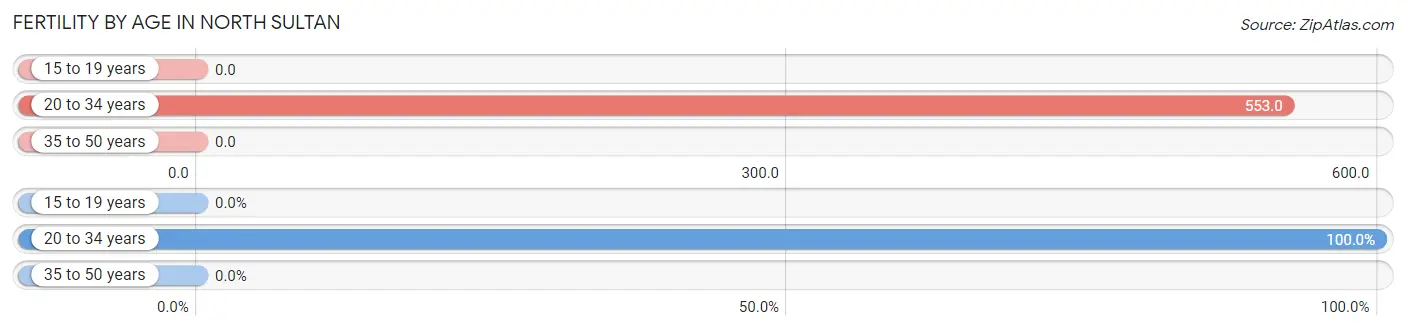
| Age Bracket | Women with Births | Births / 1,000 Women |
| 15 to 19 years | 0 (0.0%) | 0.0 |
| 20 to 34 years | 21 (100.0%) | 553.0 |
| 35 to 50 years | 0 (0.0%) | 0.0 |
| Total | 21 (100.0%) | 212.0 |
Fertility by Age by Marriage Status in North Sultan
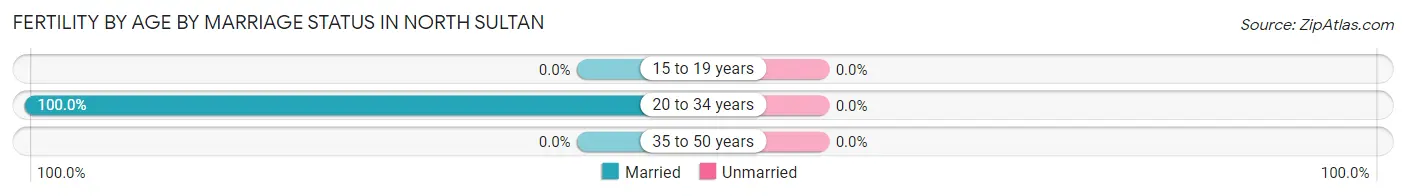
| Age Bracket | Married | Unmarried |
| 15 to 19 years | 0 (0.0%) | 0 (0.0%) |
| 20 to 34 years | 21 (100.0%) | 0 (0.0%) |
| 35 to 50 years | 0 (0.0%) | 0 (0.0%) |
| Total | 21 (100.0%) | 0 (0.0%) |
Fertility by Education in North Sultan
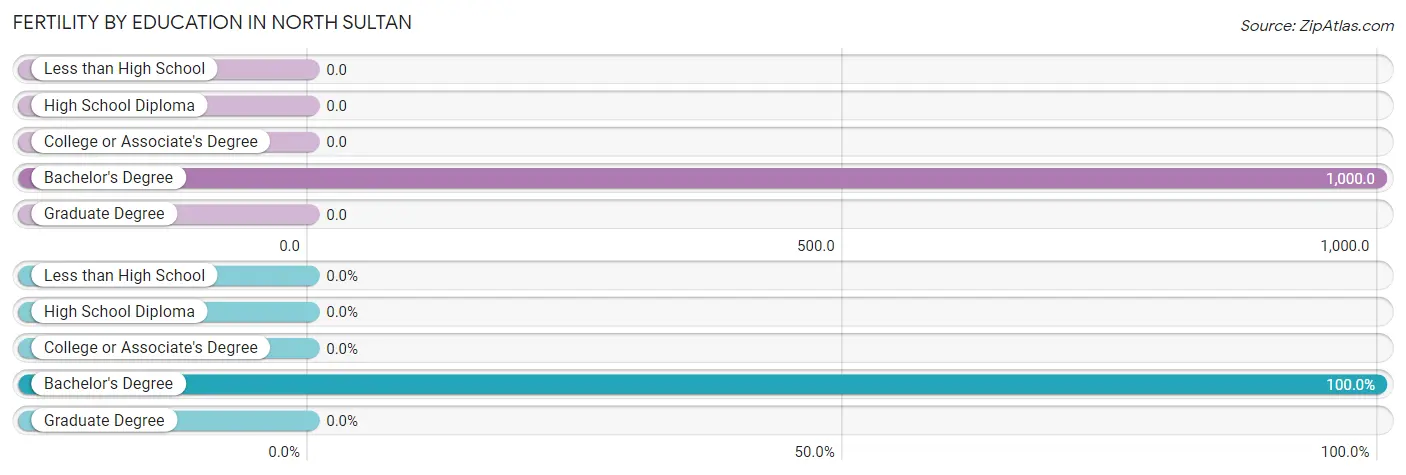
| Educational Attainment | Women with Births | Births / 1,000 Women |
| Less than High School | 0 (0.0%) | 0.0 |
| High School Diploma | 0 (0.0%) | 0.0 |
| College or Associate's Degree | 0 (0.0%) | 0.0 |
| Bachelor's Degree | 21 (100.0%) | 1,000.0 |
| Graduate Degree | 0 (0.0%) | 0.0 |
| Total | 21 (100.0%) | 212.0 |
Fertility by Education by Marriage Status in North Sultan
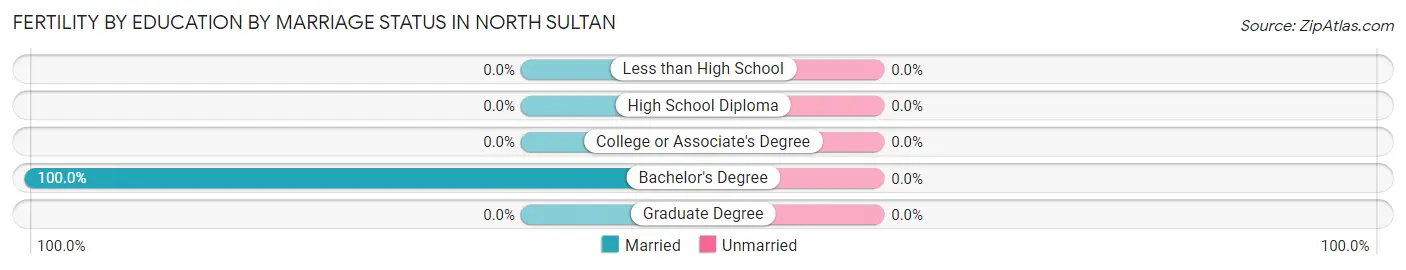
| Educational Attainment | Married | Unmarried |
| Less than High School | 0 (0.0%) | 0 (0.0%) |
| High School Diploma | 0 (0.0%) | 0 (0.0%) |
| College or Associate's Degree | 0 (0.0%) | 0 (0.0%) |
| Bachelor's Degree | 21 (100.0%) | 0 (0.0%) |
| Graduate Degree | 0 (0.0%) | 0 (0.0%) |
| Total | 21 (100.0%) | 0 (0.0%) |
Employment Characteristics in North Sultan
Employment by Class of Employer in North Sultan
Among the 168 employed individuals in North Sultan, private company employees (146 | 86.9%), and local government employees (22 | 13.1%) make up the most common classes of employment.
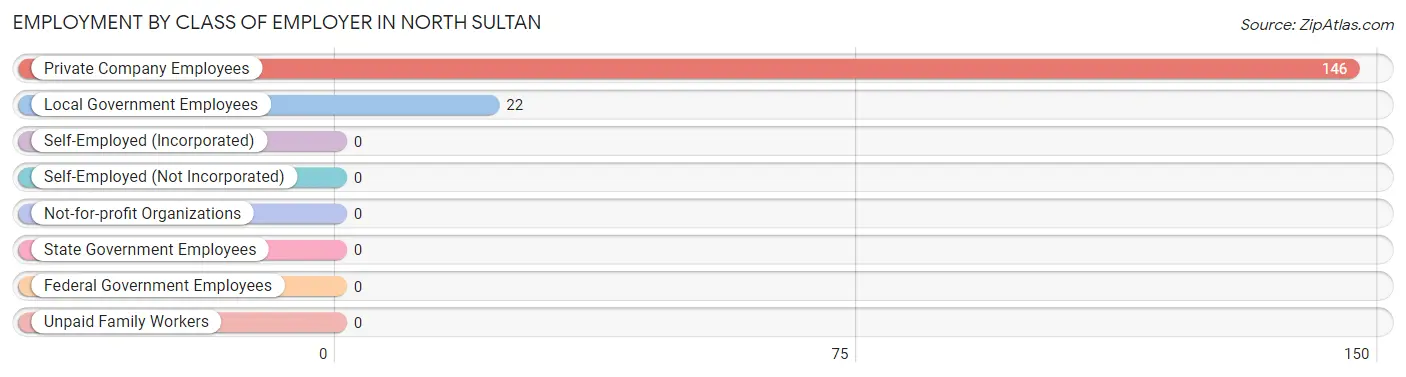
| Employer Class | # Employees | % Employees |
| Private Company Employees | 146 | 86.9% |
| Self-Employed (Incorporated) | 0 | 0.0% |
| Self-Employed (Not Incorporated) | 0 | 0.0% |
| Not-for-profit Organizations | 0 | 0.0% |
| Local Government Employees | 22 | 13.1% |
| State Government Employees | 0 | 0.0% |
| Federal Government Employees | 0 | 0.0% |
| Unpaid Family Workers | 0 | 0.0% |
| Total | 168 | 100.0% |
Employment Status by Age in North Sultan
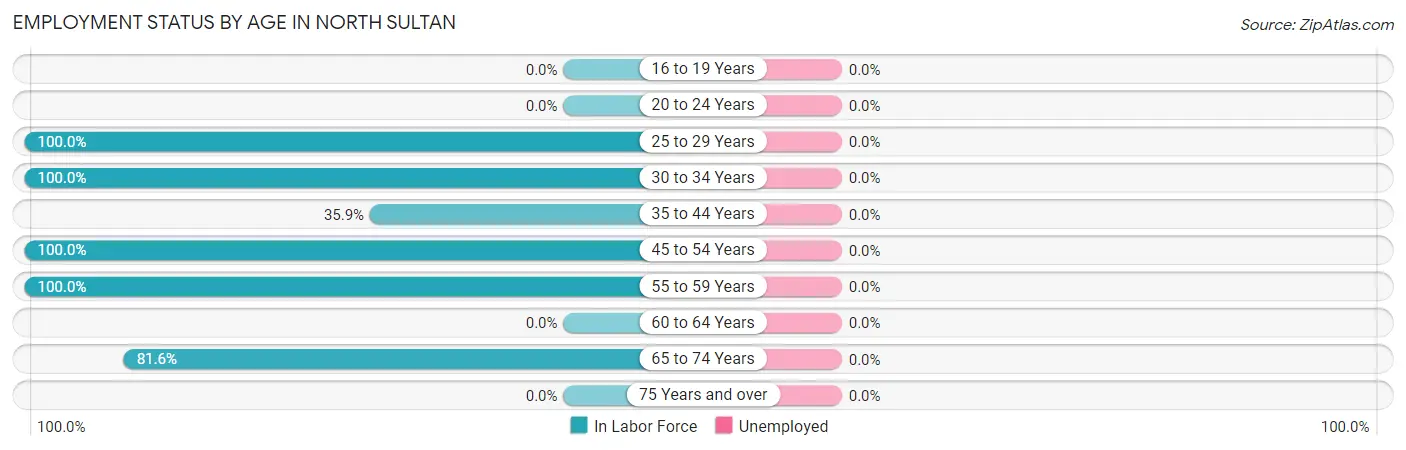
| Age Bracket | In Labor Force | Unemployed |
| 16 to 19 Years | 0 (0.0%) | 0 (0.0%) |
| 20 to 24 Years | 0 (0.0%) | 0 (0.0%) |
| 25 to 29 Years | 43 (100.0%) | 0 (0.0%) |
| 30 to 34 Years | 50 (100.0%) | 0 (0.0%) |
| 35 to 44 Years | 14 (35.9%) | 0 (0.0%) |
| 45 to 54 Years | 11 (100.0%) | 0 (0.0%) |
| 55 to 59 Years | 10 (100.0%) | 0 (0.0%) |
| 60 to 64 Years | 0 (0.0%) | 0 (0.0%) |
| 65 to 74 Years | 40 (81.6%) | 0 (0.0%) |
| 75 Years and over | 0 (0.0%) | 0 (0.0%) |
| Total | 168 (68.3%) | 0 (0.0%) |
Employment Status by Educational Attainment in North Sultan
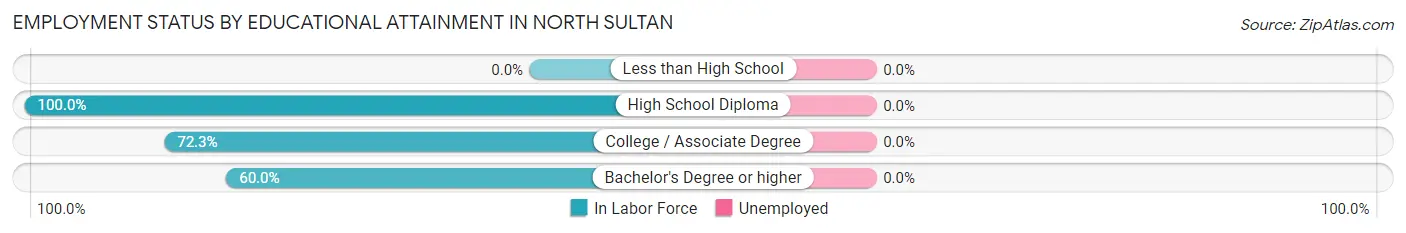
| Educational Attainment | In Labor Force | Unemployed |
| Less than High School | 0 (0.0%) | 0 (0.0%) |
| High School Diploma | 47 (100.0%) | 0 (0.0%) |
| College / Associate Degree | 60 (72.3%) | 0 (0.0%) |
| Bachelor's Degree or higher | 21 (60.0%) | 0 (0.0%) |
| Total | 128 (77.6%) | 0 (0.0%) |
Employment Occupations by Sex in North Sultan
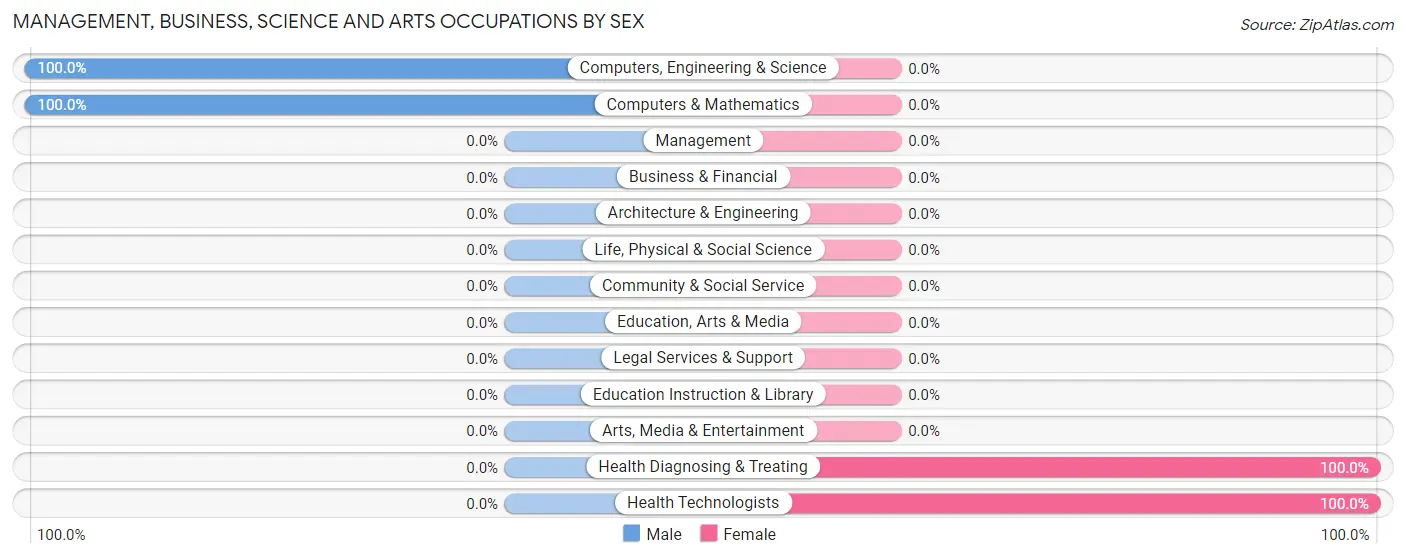
Management, Business, Science and Arts Occupations
The most common Management, Business, Science and Arts occupations in North Sultan are Health Diagnosing & Treating (31 | 18.4%), Health Technologists (21 | 12.5%), Computers, Engineering & Science (11 | 6.6%), and Computers & Mathematics (11 | 6.6%).
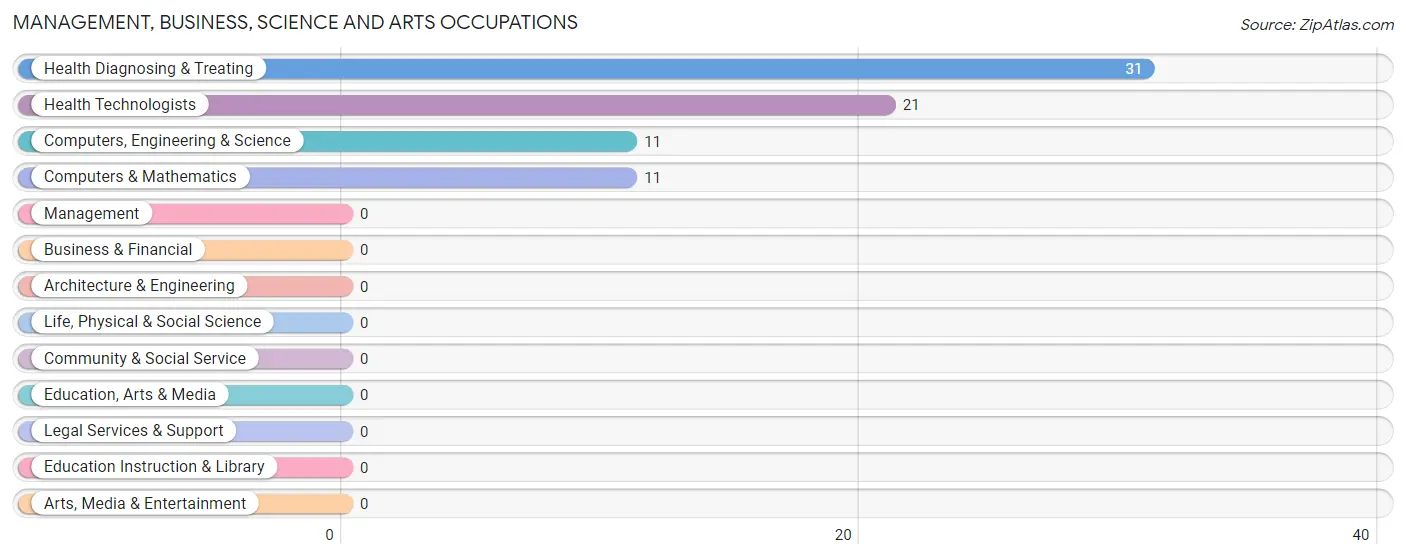
Management, Business, Science and Arts Occupations by Sex
Within the Management, Business, Science and Arts occupations in North Sultan, the most male-oriented occupations are Computers, Engineering & Science (100.0%), and Computers & Mathematics (100.0%), while the most female-oriented occupations are Health Diagnosing & Treating (100.0%), and Health Technologists (100.0%).
| Occupation | Male | Female |
| Management | 0 (0.0%) | 0 (0.0%) |
| Business & Financial | 0 (0.0%) | 0 (0.0%) |
| Computers, Engineering & Science | 11 (100.0%) | 0 (0.0%) |
| Computers & Mathematics | 11 (100.0%) | 0 (0.0%) |
| Architecture & Engineering | 0 (0.0%) | 0 (0.0%) |
| Life, Physical & Social Science | 0 (0.0%) | 0 (0.0%) |
| Community & Social Service | 0 (0.0%) | 0 (0.0%) |
| Education, Arts & Media | 0 (0.0%) | 0 (0.0%) |
| Legal Services & Support | 0 (0.0%) | 0 (0.0%) |
| Education Instruction & Library | 0 (0.0%) | 0 (0.0%) |
| Arts, Media & Entertainment | 0 (0.0%) | 0 (0.0%) |
| Health Diagnosing & Treating | 0 (0.0%) | 31 (100.0%) |
| Health Technologists | 0 (0.0%) | 21 (100.0%) |
| Total (Category) | 11 (26.2%) | 31 (73.8%) |
| Total (Overall) | 93 (55.4%) | 75 (44.6%) |
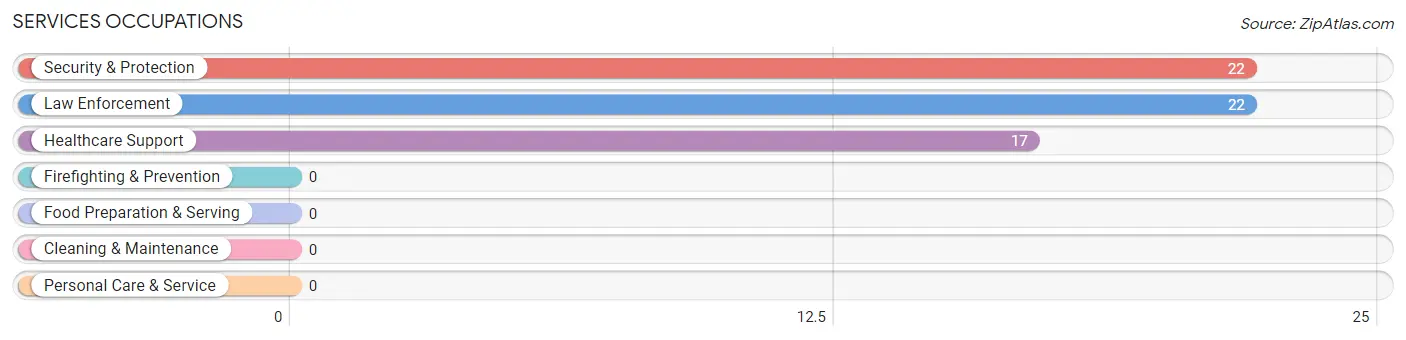
Services Occupations
The most common Services occupations in North Sultan are Security & Protection (22 | 13.1%), Law Enforcement (22 | 13.1%), and Healthcare Support (17 | 10.1%).
Services Occupations by Sex
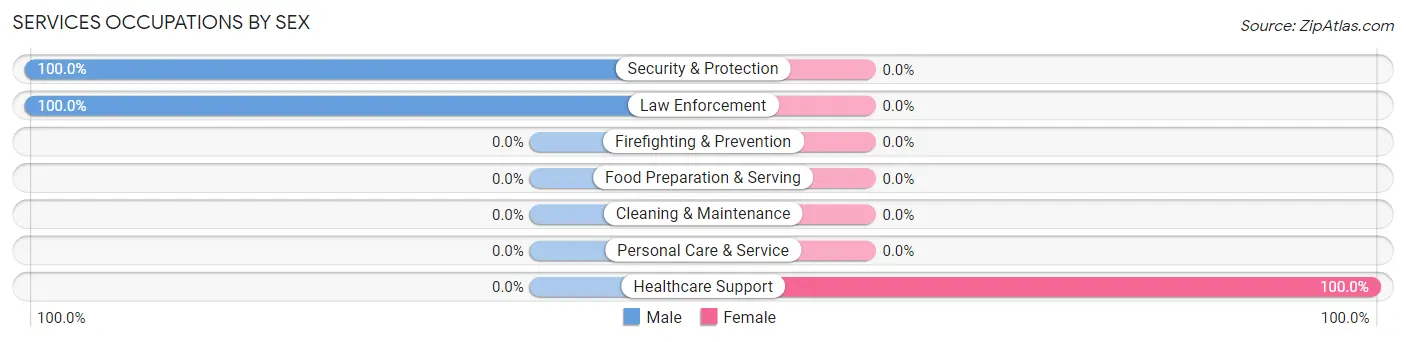
| Occupation | Male | Female |
| Healthcare Support | 0 (0.0%) | 17 (100.0%) |
| Security & Protection | 22 (100.0%) | 0 (0.0%) |
| Firefighting & Prevention | 0 (0.0%) | 0 (0.0%) |
| Law Enforcement | 22 (100.0%) | 0 (0.0%) |
| Food Preparation & Serving | 0 (0.0%) | 0 (0.0%) |
| Cleaning & Maintenance | 0 (0.0%) | 0 (0.0%) |
| Personal Care & Service | 0 (0.0%) | 0 (0.0%) |
| Total (Category) | 22 (56.4%) | 17 (43.6%) |
| Total (Overall) | 93 (55.4%) | 75 (44.6%) |
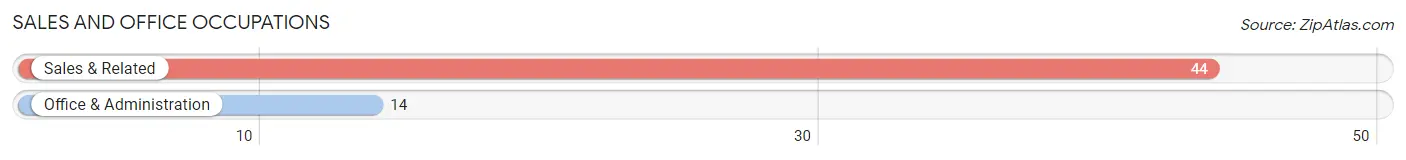
Sales and Office Occupations
The most common Sales and Office occupations in North Sultan are Sales & Related (44 | 26.2%), and Office & Administration (14 | 8.3%).
Sales and Office Occupations by Sex
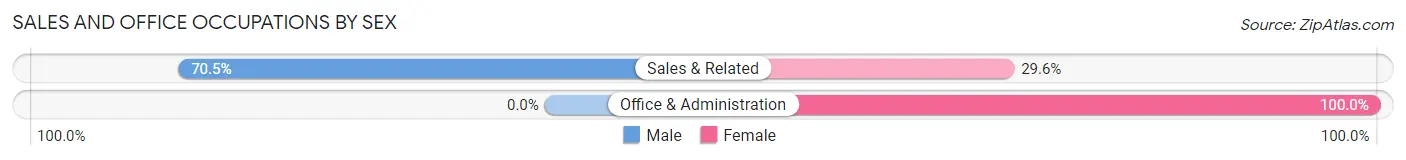
| Occupation | Male | Female |
| Sales & Related | 31 (70.5%) | 13 (29.5%) |
| Office & Administration | 0 (0.0%) | 14 (100.0%) |
| Total (Category) | 31 (53.4%) | 27 (46.6%) |
| Total (Overall) | 93 (55.4%) | 75 (44.6%) |
Natural Resources, Construction and Maintenance Occupations
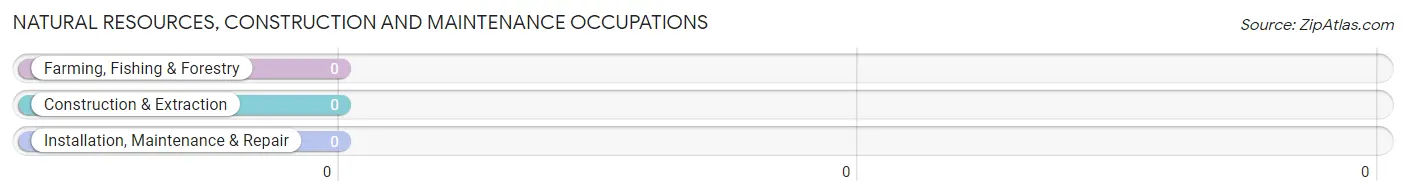
Natural Resources, Construction and Maintenance Occupations by Sex
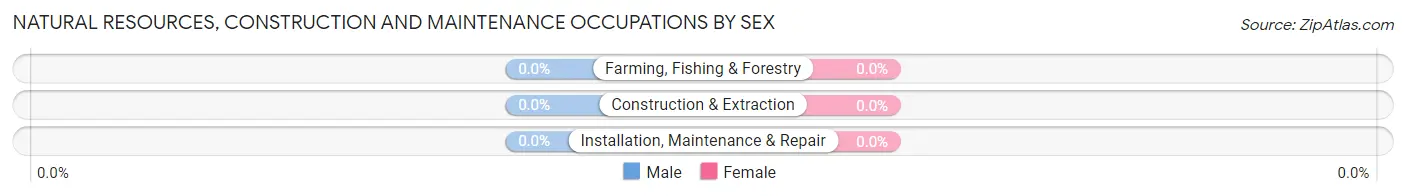
| Occupation | Male | Female |
| Farming, Fishing & Forestry | 0 (0.0%) | 0 (0.0%) |
| Construction & Extraction | 0 (0.0%) | 0 (0.0%) |
| Installation, Maintenance & Repair | 0 (0.0%) | 0 (0.0%) |
| Total (Category) | 0 (0.0%) | 0 (0.0%) |
| Total (Overall) | 93 (55.4%) | 75 (44.6%) |
Production, Transportation and Moving Occupations
The most common Production, Transportation and Moving occupations in North Sultan are Production (17 | 10.1%), and Transportation (12 | 7.1%).
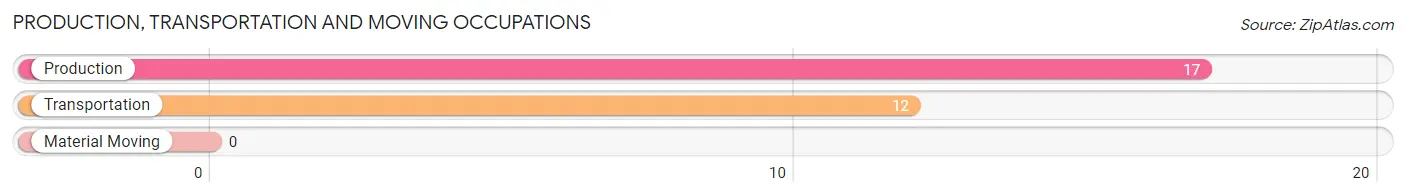
Production, Transportation and Moving Occupations by Sex
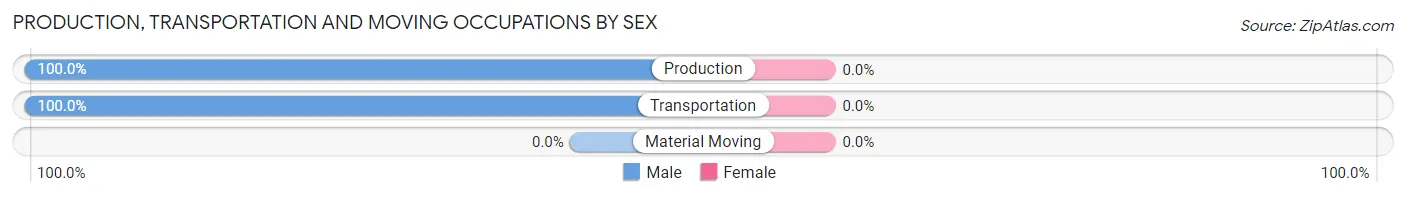
| Occupation | Male | Female |
| Production | 17 (100.0%) | 0 (0.0%) |
| Transportation | 12 (100.0%) | 0 (0.0%) |
| Material Moving | 0 (0.0%) | 0 (0.0%) |
| Total (Category) | 29 (100.0%) | 0 (0.0%) |
| Total (Overall) | 93 (55.4%) | 75 (44.6%) |
Employment Industries by Sex in North Sultan
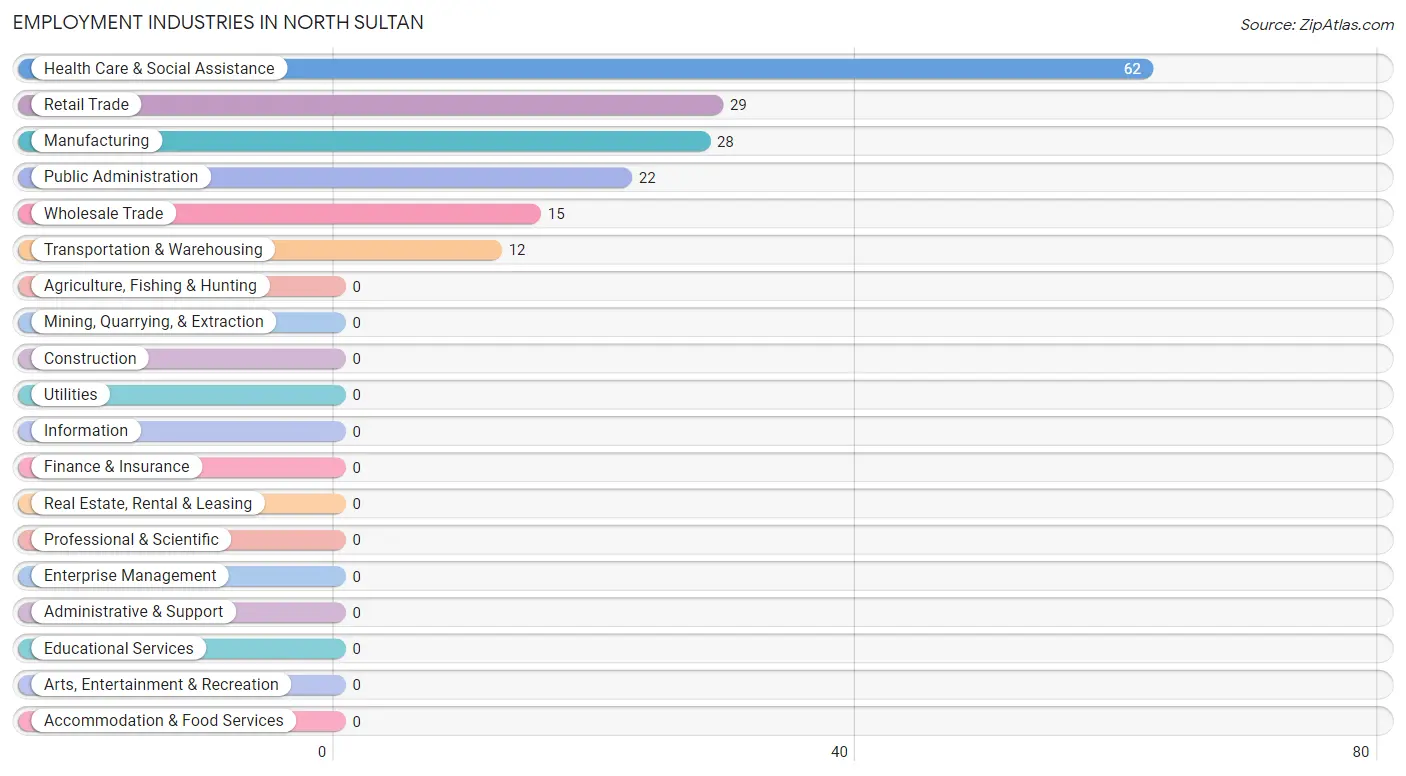
Employment Industries in North Sultan
The major employment industries in North Sultan include Health Care & Social Assistance (62 | 36.9%), Retail Trade (29 | 17.3%), Manufacturing (28 | 16.7%), Public Administration (22 | 13.1%), and Wholesale Trade (15 | 8.9%).
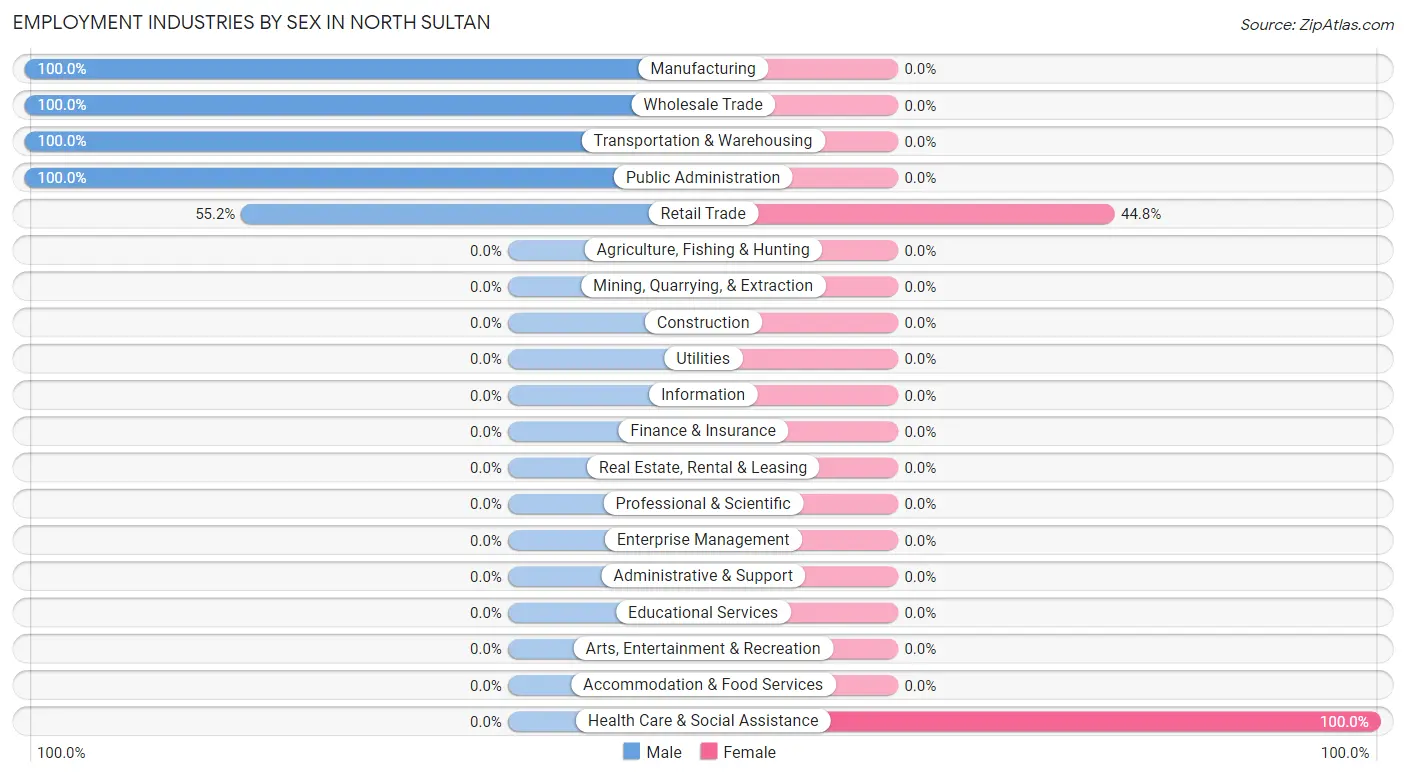
Employment Industries by Sex in North Sultan
The North Sultan industries that see more men than women are Manufacturing (100.0%), Wholesale Trade (100.0%), and Transportation & Warehousing (100.0%), whereas the industries that tend to have a higher number of women are Health Care & Social Assistance (100.0%), and Retail Trade (44.8%).
| Industry | Male | Female |
| Agriculture, Fishing & Hunting | 0 (0.0%) | 0 (0.0%) |
| Mining, Quarrying, & Extraction | 0 (0.0%) | 0 (0.0%) |
| Construction | 0 (0.0%) | 0 (0.0%) |
| Manufacturing | 28 (100.0%) | 0 (0.0%) |
| Wholesale Trade | 15 (100.0%) | 0 (0.0%) |
| Retail Trade | 16 (55.2%) | 13 (44.8%) |
| Transportation & Warehousing | 12 (100.0%) | 0 (0.0%) |
| Utilities | 0 (0.0%) | 0 (0.0%) |
| Information | 0 (0.0%) | 0 (0.0%) |
| Finance & Insurance | 0 (0.0%) | 0 (0.0%) |
| Real Estate, Rental & Leasing | 0 (0.0%) | 0 (0.0%) |
| Professional & Scientific | 0 (0.0%) | 0 (0.0%) |
| Enterprise Management | 0 (0.0%) | 0 (0.0%) |
| Administrative & Support | 0 (0.0%) | 0 (0.0%) |
| Educational Services | 0 (0.0%) | 0 (0.0%) |
| Health Care & Social Assistance | 0 (0.0%) | 62 (100.0%) |
| Arts, Entertainment & Recreation | 0 (0.0%) | 0 (0.0%) |
| Accommodation & Food Services | 0 (0.0%) | 0 (0.0%) |
| Public Administration | 22 (100.0%) | 0 (0.0%) |
| Total | 93 (55.4%) | 75 (44.6%) |
Education in North Sultan
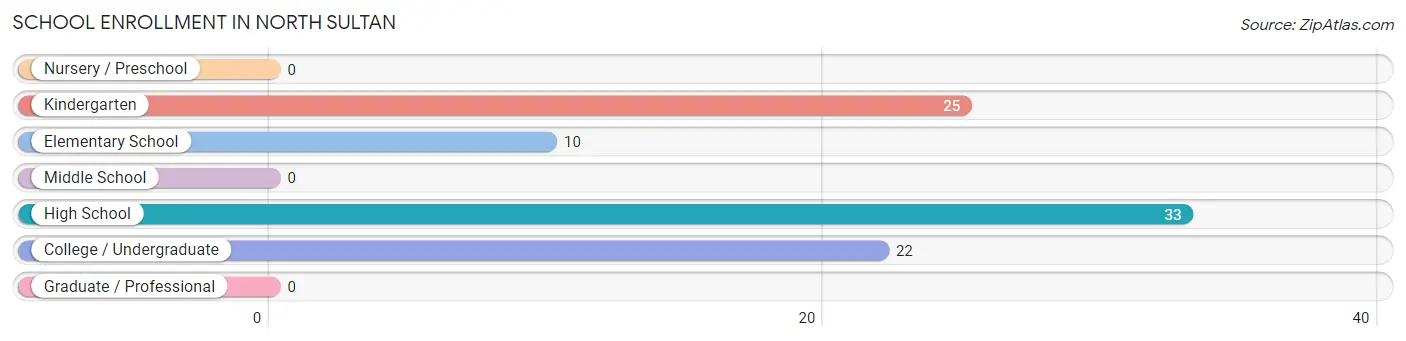
School Enrollment in North Sultan
The most common levels of schooling among the 90 students in North Sultan are high school (33 | 36.7%), kindergarten (25 | 27.8%), and college / undergraduate (22 | 24.4%).
| School Level | # Students | % Students |
| Nursery / Preschool | 0 | 0.0% |
| Kindergarten | 25 | 27.8% |
| Elementary School | 10 | 11.1% |
| Middle School | 0 | 0.0% |
| High School | 33 | 36.7% |
| College / Undergraduate | 22 | 24.4% |
| Graduate / Professional | 0 | 0.0% |
| Total | 90 | 100.0% |
School Enrollment by Age by Funding Source in North Sultan
Out of a total of 90 students who are enrolled in schools in North Sultan, 48 (53.3%) attend a private institution, while the remaining 42 (46.7%) are enrolled in public schools. The age group of 25 to 34 year olds has the highest likelihood of being enrolled in private schools, with 22 (100.0% in the age bracket) enrolled. Conversely, the age group of 10 to 14 year olds has the lowest likelihood of being enrolled in a private school, with 21 (100.0% in the age bracket) attending a public institution.
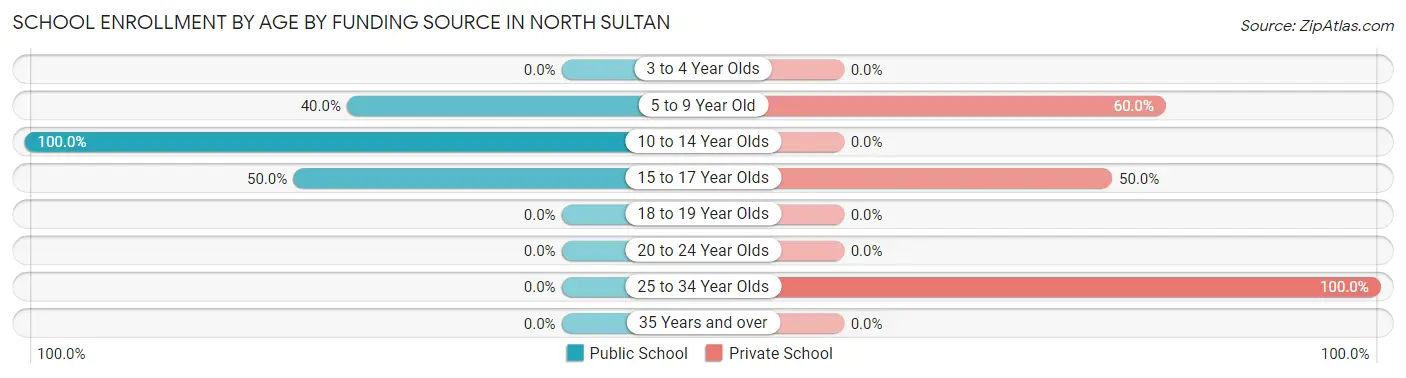
| Age Bracket | Public School | Private School |
| 3 to 4 Year Olds | 0 (0.0%) | 0 (0.0%) |
| 5 to 9 Year Old | 10 (40.0%) | 15 (60.0%) |
| 10 to 14 Year Olds | 21 (100.0%) | 0 (0.0%) |
| 15 to 17 Year Olds | 11 (50.0%) | 11 (50.0%) |
| 18 to 19 Year Olds | 0 (0.0%) | 0 (0.0%) |
| 20 to 24 Year Olds | 0 (0.0%) | 0 (0.0%) |
| 25 to 34 Year Olds | 0 (0.0%) | 22 (100.0%) |
| 35 Years and over | 0 (0.0%) | 0 (0.0%) |
| Total | 42 (46.7%) | 48 (53.3%) |
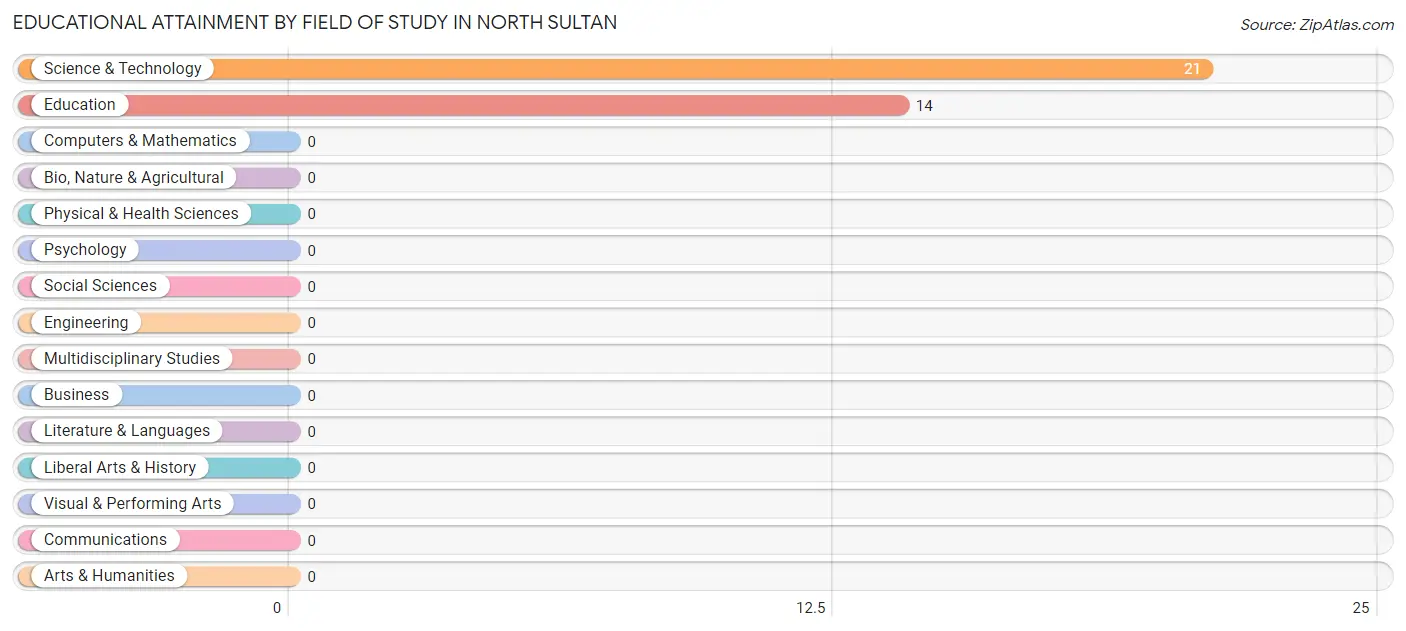
Educational Attainment by Field of Study in North Sultan
Science & technology (21 | 60.0%), and education (14 | 40.0%) are the most common fields of study among 35 individuals in North Sultan who have obtained a bachelor's degree or higher.
| Field of Study | # Graduates | % Graduates |
| Computers & Mathematics | 0 | 0.0% |
| Bio, Nature & Agricultural | 0 | 0.0% |
| Physical & Health Sciences | 0 | 0.0% |
| Psychology | 0 | 0.0% |
| Social Sciences | 0 | 0.0% |
| Engineering | 0 | 0.0% |
| Multidisciplinary Studies | 0 | 0.0% |
| Science & Technology | 21 | 60.0% |
| Business | 0 | 0.0% |
| Education | 14 | 40.0% |
| Literature & Languages | 0 | 0.0% |
| Liberal Arts & History | 0 | 0.0% |
| Visual & Performing Arts | 0 | 0.0% |
| Communications | 0 | 0.0% |
| Arts & Humanities | 0 | 0.0% |
| Total | 35 | 100.0% |
Transportation & Commute in North Sultan
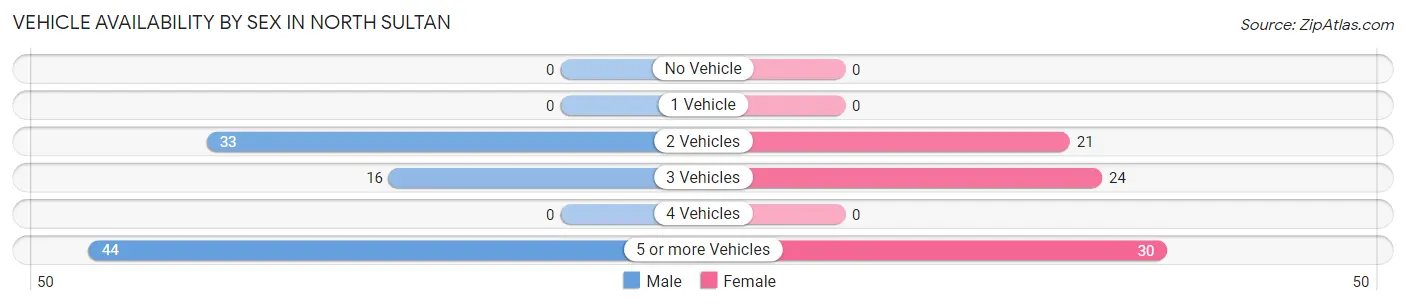
Vehicle Availability by Sex in North Sultan
The most prevalent vehicle ownership categories in North Sultan are males with 5 or more vehicles (44, accounting for 47.3%) and females with 5 or more vehicles (30, making up 58.7%).
| Vehicles Available | Male | Female |
| No Vehicle | 0 (0.0%) | 0 (0.0%) |
| 1 Vehicle | 0 (0.0%) | 0 (0.0%) |
| 2 Vehicles | 33 (35.5%) | 21 (28.0%) |
| 3 Vehicles | 16 (17.2%) | 24 (32.0%) |
| 4 Vehicles | 0 (0.0%) | 0 (0.0%) |
| 5 or more Vehicles | 44 (47.3%) | 30 (40.0%) |
| Total | 93 (100.0%) | 75 (100.0%) |
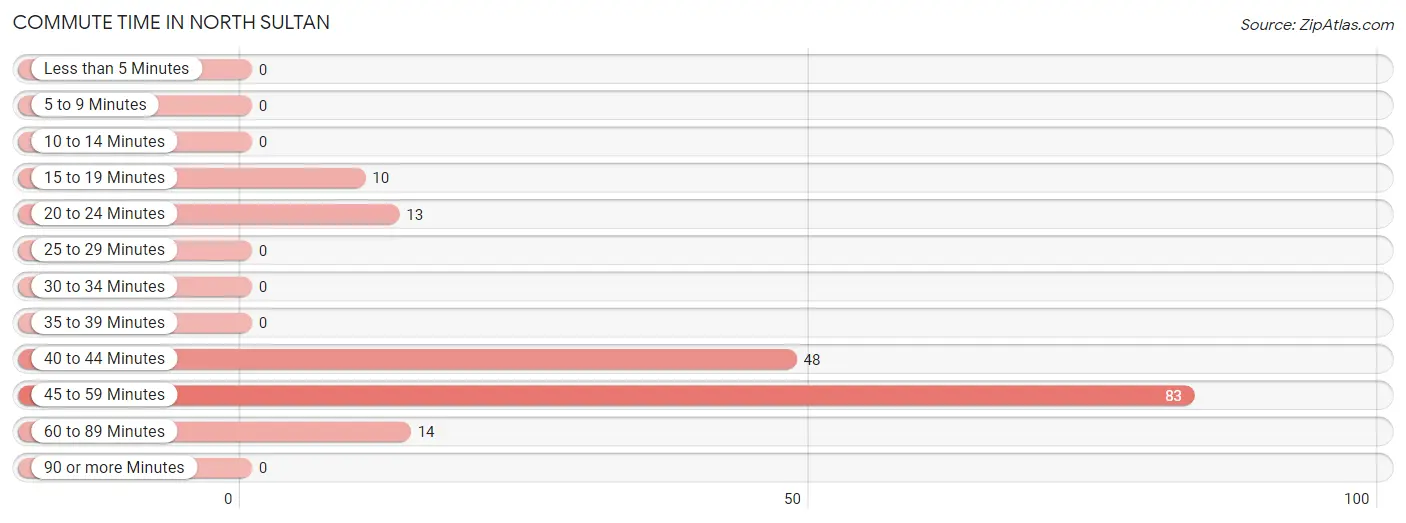
Commute Time in North Sultan
The most frequently occuring commute durations in North Sultan are 45 to 59 minutes (83 commuters, 49.4%), 40 to 44 minutes (48 commuters, 28.6%), and 60 to 89 minutes (14 commuters, 8.3%).
| Commute Time | # Commuters | % Commuters |
| Less than 5 Minutes | 0 | 0.0% |
| 5 to 9 Minutes | 0 | 0.0% |
| 10 to 14 Minutes | 0 | 0.0% |
| 15 to 19 Minutes | 10 | 5.9% |
| 20 to 24 Minutes | 13 | 7.7% |
| 25 to 29 Minutes | 0 | 0.0% |
| 30 to 34 Minutes | 0 | 0.0% |
| 35 to 39 Minutes | 0 | 0.0% |
| 40 to 44 Minutes | 48 | 28.6% |
| 45 to 59 Minutes | 83 | 49.4% |
| 60 to 89 Minutes | 14 | 8.3% |
| 90 or more Minutes | 0 | 0.0% |
Commute Time by Sex in North Sultan
The most common commute times in North Sultan are 40 to 44 minutes (48 commuters, 51.6%) for males and 45 to 59 minutes (38 commuters, 50.7%) for females.
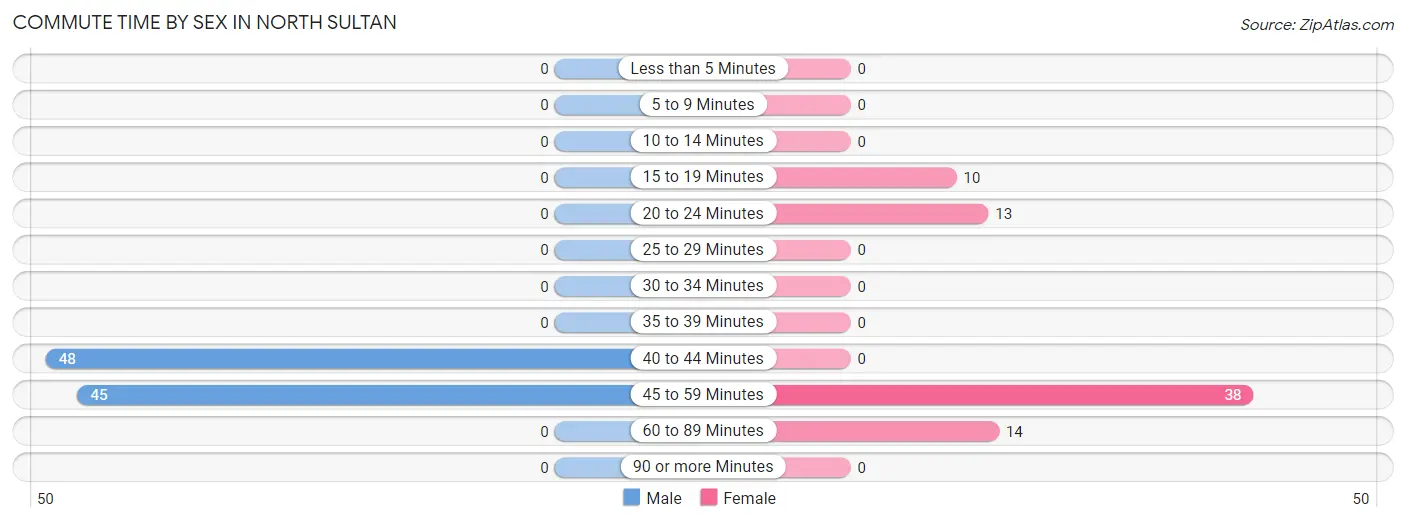
| Commute Time | Male | Female |
| Less than 5 Minutes | 0 (0.0%) | 0 (0.0%) |
| 5 to 9 Minutes | 0 (0.0%) | 0 (0.0%) |
| 10 to 14 Minutes | 0 (0.0%) | 0 (0.0%) |
| 15 to 19 Minutes | 0 (0.0%) | 10 (13.3%) |
| 20 to 24 Minutes | 0 (0.0%) | 13 (17.3%) |
| 25 to 29 Minutes | 0 (0.0%) | 0 (0.0%) |
| 30 to 34 Minutes | 0 (0.0%) | 0 (0.0%) |
| 35 to 39 Minutes | 0 (0.0%) | 0 (0.0%) |
| 40 to 44 Minutes | 48 (51.6%) | 0 (0.0%) |
| 45 to 59 Minutes | 45 (48.4%) | 38 (50.7%) |
| 60 to 89 Minutes | 0 (0.0%) | 14 (18.7%) |
| 90 or more Minutes | 0 (0.0%) | 0 (0.0%) |
Time of Departure to Work by Sex in North Sultan
The most frequent times of departure to work in North Sultan are 5:30 AM to 5:59 AM (26, 28.0%) for males and 6:00 AM to 6:29 AM (38, 50.7%) for females.
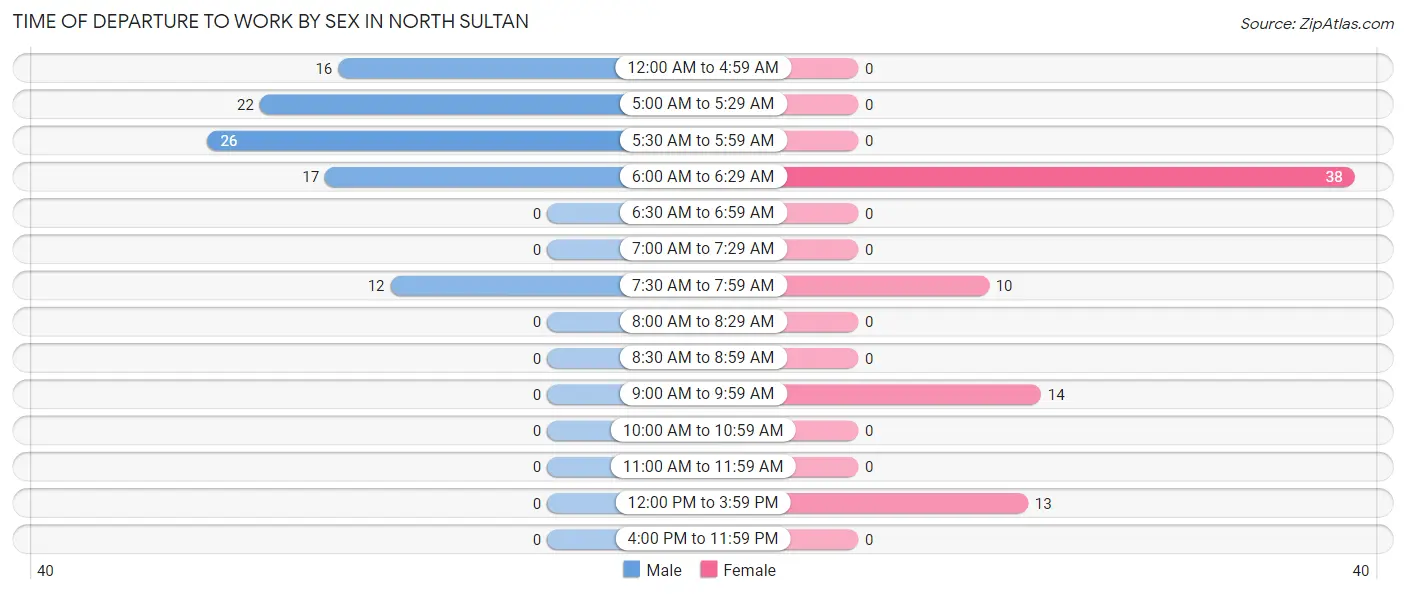
| Time of Departure | Male | Female |
| 12:00 AM to 4:59 AM | 16 (17.2%) | 0 (0.0%) |
| 5:00 AM to 5:29 AM | 22 (23.7%) | 0 (0.0%) |
| 5:30 AM to 5:59 AM | 26 (28.0%) | 0 (0.0%) |
| 6:00 AM to 6:29 AM | 17 (18.3%) | 38 (50.7%) |
| 6:30 AM to 6:59 AM | 0 (0.0%) | 0 (0.0%) |
| 7:00 AM to 7:29 AM | 0 (0.0%) | 0 (0.0%) |
| 7:30 AM to 7:59 AM | 12 (12.9%) | 10 (13.3%) |
| 8:00 AM to 8:29 AM | 0 (0.0%) | 0 (0.0%) |
| 8:30 AM to 8:59 AM | 0 (0.0%) | 0 (0.0%) |
| 9:00 AM to 9:59 AM | 0 (0.0%) | 14 (18.7%) |
| 10:00 AM to 10:59 AM | 0 (0.0%) | 0 (0.0%) |
| 11:00 AM to 11:59 AM | 0 (0.0%) | 0 (0.0%) |
| 12:00 PM to 3:59 PM | 0 (0.0%) | 13 (17.3%) |
| 4:00 PM to 11:59 PM | 0 (0.0%) | 0 (0.0%) |
| Total | 93 (100.0%) | 75 (100.0%) |
Housing Occupancy in North Sultan
Occupancy by Ownership in North Sultan
Of the total 97 dwellings in North Sultan, owner-occupied units account for 97 (100.0%), while renter-occupied units make up 0 (0.0%).
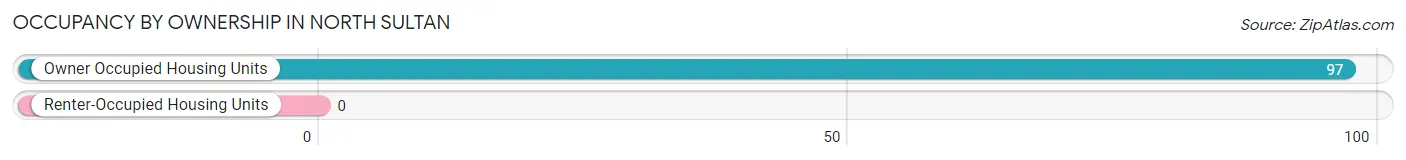
| Occupancy | # Housing Units | % Housing Units |
| Owner Occupied Housing Units | 97 | 100.0% |
| Renter-Occupied Housing Units | 0 | 0.0% |
| Total Occupied Housing Units | 97 | 100.0% |
Occupancy by Household Size in North Sultan
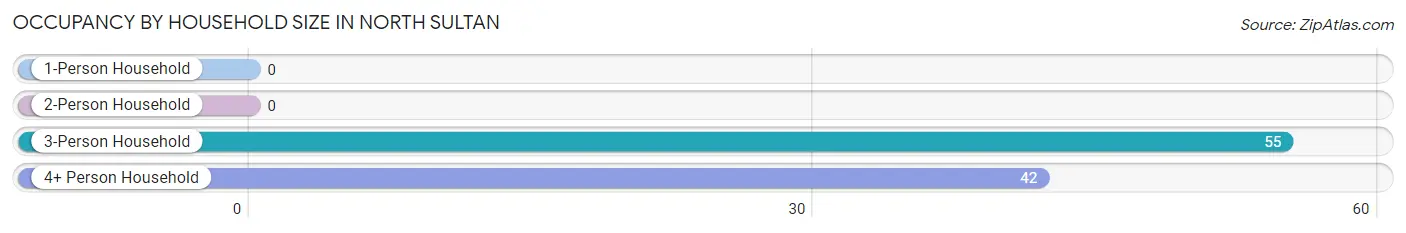
| Household Size | # Housing Units | % Housing Units |
| 1-Person Household | 0 | 0.0% |
| 2-Person Household | 0 | 0.0% |
| 3-Person Household | 55 | 56.7% |
| 4+ Person Household | 42 | 43.3% |
| Total Housing Units | 97 | 100.0% |
Occupancy by Ownership by Household Size in North Sultan
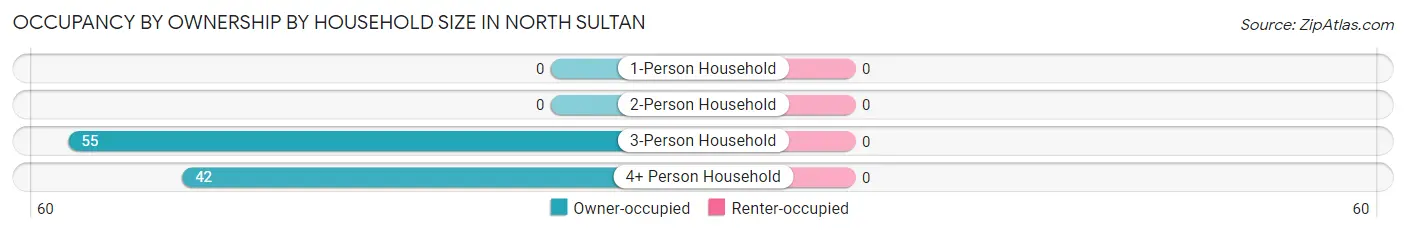
| Household Size | Owner-occupied | Renter-occupied |
| 1-Person Household | 0 (0.0%) | 0 (0.0%) |
| 2-Person Household | 0 (0.0%) | 0 (0.0%) |
| 3-Person Household | 55 (100.0%) | 0 (0.0%) |
| 4+ Person Household | 42 (100.0%) | 0 (0.0%) |
| Total Housing Units | 97 (100.0%) | 0 (0.0%) |
Occupancy by Educational Attainment in North Sultan
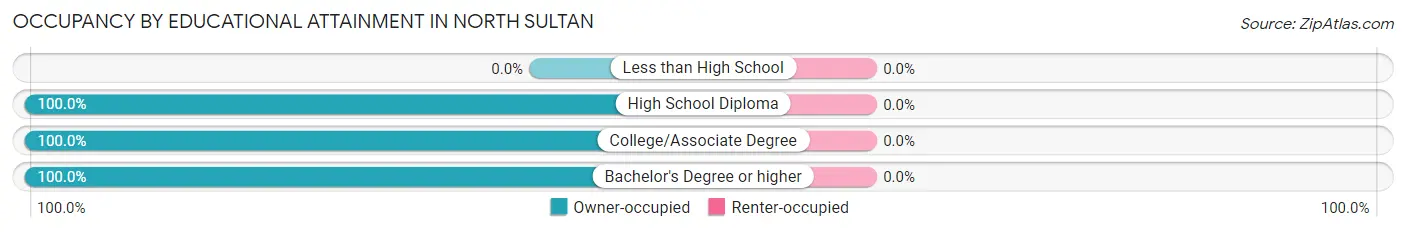
| Household Size | Owner-occupied | Renter-occupied |
| Less than High School | 0 (0.0%) | 0 (0.0%) |
| High School Diploma | 25 (100.0%) | 0 (0.0%) |
| College/Associate Degree | 58 (100.0%) | 0 (0.0%) |
| Bachelor's Degree or higher | 14 (100.0%) | 0 (0.0%) |
Occupancy by Age of Householder in North Sultan
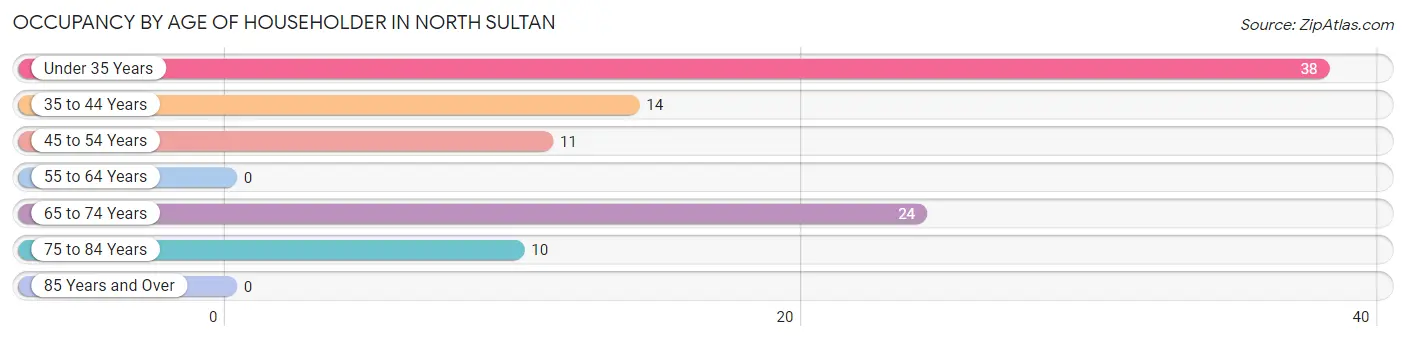
| Age Bracket | # Households | % Households |
| Under 35 Years | 38 | 39.2% |
| 35 to 44 Years | 14 | 14.4% |
| 45 to 54 Years | 11 | 11.3% |
| 55 to 64 Years | 0 | 0.0% |
| 65 to 74 Years | 24 | 24.7% |
| 75 to 84 Years | 10 | 10.3% |
| 85 Years and Over | 0 | 0.0% |
| Total | 97 | 100.0% |
Housing Finances in North Sultan
Median Income by Occupancy in North Sultan
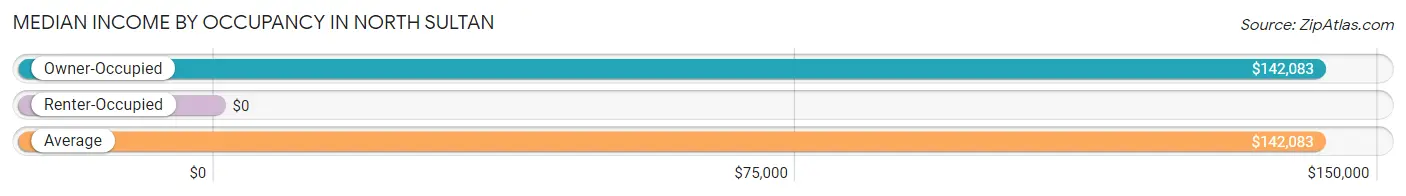
| Occupancy Type | # Households | Median Income |
| Owner-Occupied | 97 (100.0%) | $142,083 |
| Renter-Occupied | 0 (0.0%) | $0 |
| Average | 97 (100.0%) | $142,083 |
Occupancy by Householder Income Bracket in North Sultan
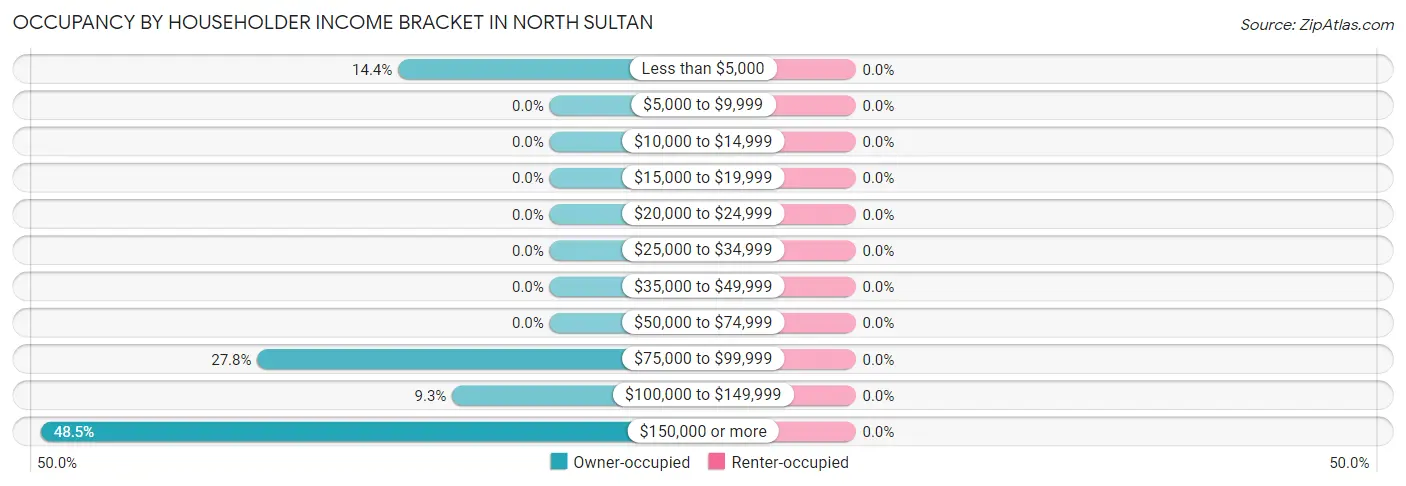
| Income Bracket | Owner-occupied | Renter-occupied |
| Less than $5,000 | 14 (14.4%) | 0 (0.0%) |
| $5,000 to $9,999 | 0 (0.0%) | 0 (0.0%) |
| $10,000 to $14,999 | 0 (0.0%) | 0 (0.0%) |
| $15,000 to $19,999 | 0 (0.0%) | 0 (0.0%) |
| $20,000 to $24,999 | 0 (0.0%) | 0 (0.0%) |
| $25,000 to $34,999 | 0 (0.0%) | 0 (0.0%) |
| $35,000 to $49,999 | 0 (0.0%) | 0 (0.0%) |
| $50,000 to $74,999 | 0 (0.0%) | 0 (0.0%) |
| $75,000 to $99,999 | 27 (27.8%) | 0 (0.0%) |
| $100,000 to $149,999 | 9 (9.3%) | 0 (0.0%) |
| $150,000 or more | 47 (48.4%) | 0 (0.0%) |
| Total | 97 (100.0%) | 0 (0.0%) |
Monthly Housing Cost Tiers in North Sultan
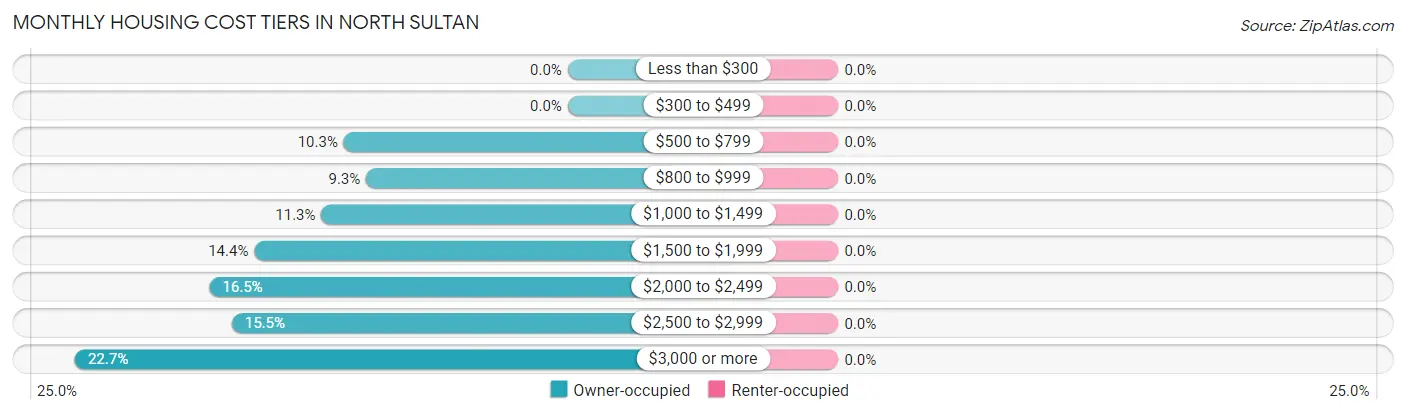
| Monthly Cost | Owner-occupied | Renter-occupied |
| Less than $300 | 0 (0.0%) | 0 (0.0%) |
| $300 to $499 | 0 (0.0%) | 0 (0.0%) |
| $500 to $799 | 10 (10.3%) | 0 (0.0%) |
| $800 to $999 | 9 (9.3%) | 0 (0.0%) |
| $1,000 to $1,499 | 11 (11.3%) | 0 (0.0%) |
| $1,500 to $1,999 | 14 (14.4%) | 0 (0.0%) |
| $2,000 to $2,499 | 16 (16.5%) | 0 (0.0%) |
| $2,500 to $2,999 | 15 (15.5%) | 0 (0.0%) |
| $3,000 or more | 22 (22.7%) | 0 (0.0%) |
| Total | 97 (100.0%) | 0 (0.0%) |
Physical Housing Characteristics in North Sultan
Housing Structures in North Sultan
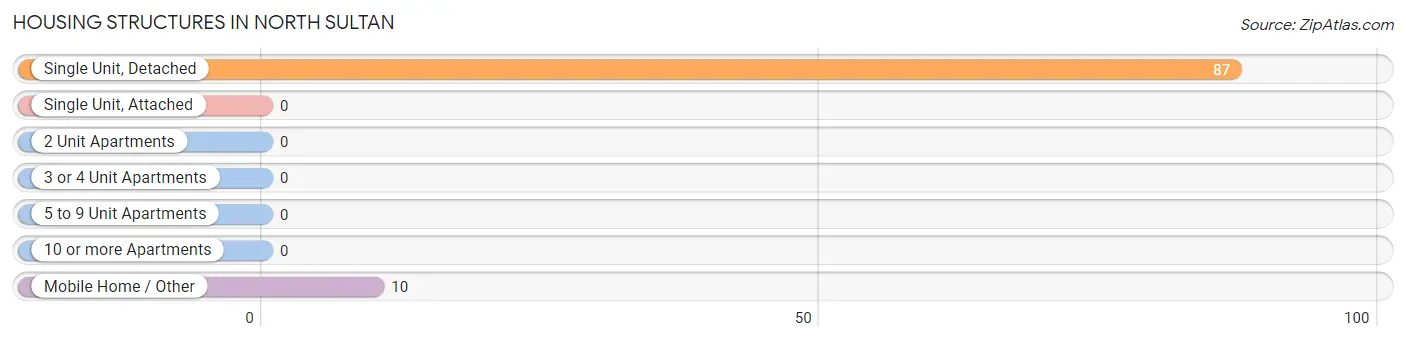
| Structure Type | # Housing Units | % Housing Units |
| Single Unit, Detached | 87 | 89.7% |
| Single Unit, Attached | 0 | 0.0% |
| 2 Unit Apartments | 0 | 0.0% |
| 3 or 4 Unit Apartments | 0 | 0.0% |
| 5 to 9 Unit Apartments | 0 | 0.0% |
| 10 or more Apartments | 0 | 0.0% |
| Mobile Home / Other | 10 | 10.3% |
| Total | 97 | 100.0% |
Housing Structures by Occupancy in North Sultan
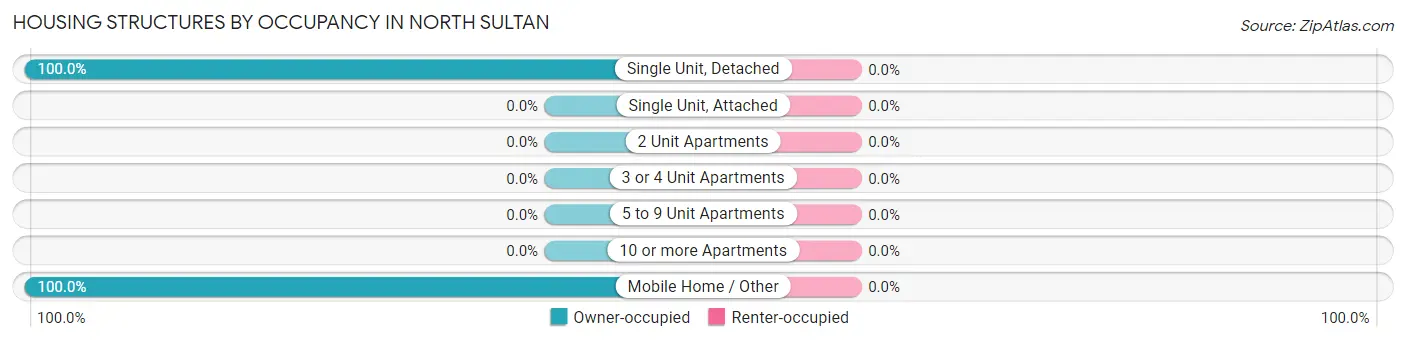
| Structure Type | Owner-occupied | Renter-occupied |
| Single Unit, Detached | 87 (100.0%) | 0 (0.0%) |
| Single Unit, Attached | 0 (0.0%) | 0 (0.0%) |
| 2 Unit Apartments | 0 (0.0%) | 0 (0.0%) |
| 3 or 4 Unit Apartments | 0 (0.0%) | 0 (0.0%) |
| 5 to 9 Unit Apartments | 0 (0.0%) | 0 (0.0%) |
| 10 or more Apartments | 0 (0.0%) | 0 (0.0%) |
| Mobile Home / Other | 10 (100.0%) | 0 (0.0%) |
| Total | 97 (100.0%) | 0 (0.0%) |
Housing Structures by Number of Rooms in North Sultan
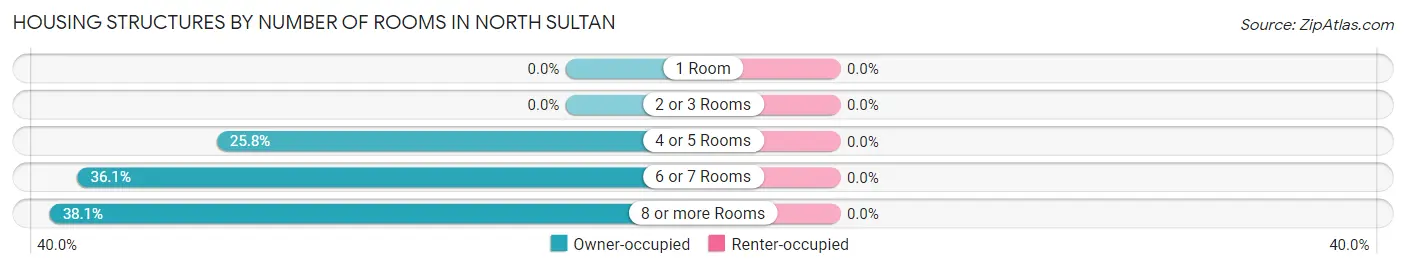
| Number of Rooms | Owner-occupied | Renter-occupied |
| 1 Room | 0 (0.0%) | 0 (0.0%) |
| 2 or 3 Rooms | 0 (0.0%) | 0 (0.0%) |
| 4 or 5 Rooms | 25 (25.8%) | 0 (0.0%) |
| 6 or 7 Rooms | 35 (36.1%) | 0 (0.0%) |
| 8 or more Rooms | 37 (38.1%) | 0 (0.0%) |
| Total | 97 (100.0%) | 0 (0.0%) |
Housing Structure by Heating Type in North Sultan
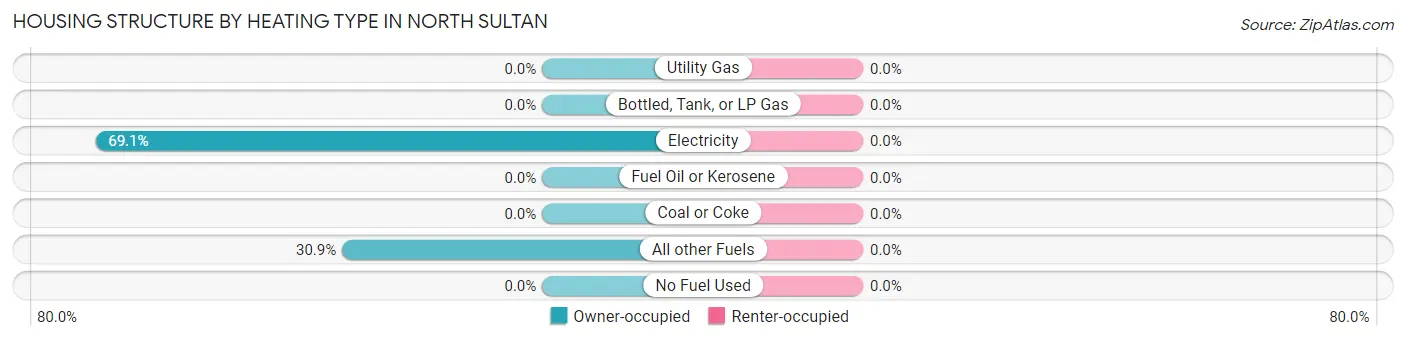
| Heating Type | Owner-occupied | Renter-occupied |
| Utility Gas | 0 (0.0%) | 0 (0.0%) |
| Bottled, Tank, or LP Gas | 0 (0.0%) | 0 (0.0%) |
| Electricity | 67 (69.1%) | 0 (0.0%) |
| Fuel Oil or Kerosene | 0 (0.0%) | 0 (0.0%) |
| Coal or Coke | 0 (0.0%) | 0 (0.0%) |
| All other Fuels | 30 (30.9%) | 0 (0.0%) |
| No Fuel Used | 0 (0.0%) | 0 (0.0%) |
| Total | 97 (100.0%) | 0 (0.0%) |
Household Vehicle Usage in North Sultan
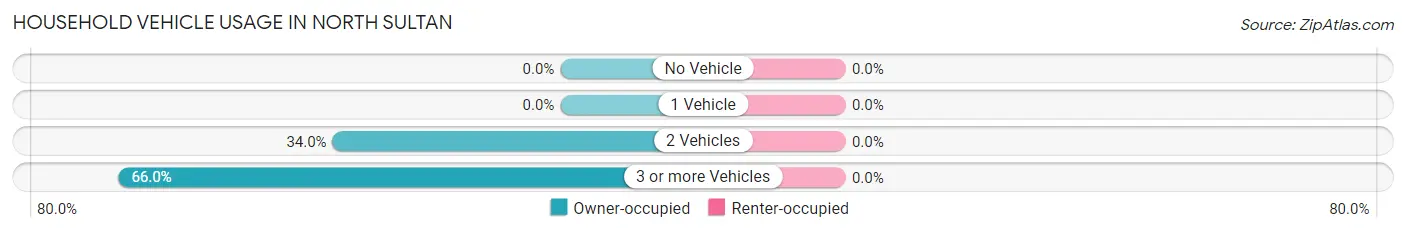
| Vehicles per Household | Owner-occupied | Renter-occupied |
| No Vehicle | 0 (0.0%) | 0 (0.0%) |
| 1 Vehicle | 0 (0.0%) | 0 (0.0%) |
| 2 Vehicles | 33 (34.0%) | 0 (0.0%) |
| 3 or more Vehicles | 64 (66.0%) | 0 (0.0%) |
| Total | 97 (100.0%) | 0 (0.0%) |
Real Estate & Mortgages in North Sultan
Real Estate and Mortgage Overview in North Sultan
| Characteristic | Without Mortgage | With Mortgage |
| Housing Units | 19 | 78 |
| Median Property Value | - | - |
| Median Household Income | - | - |
| Monthly Housing Costs | - | - |
| Real Estate Taxes | - | - |
Property Value by Mortgage Status in North Sultan
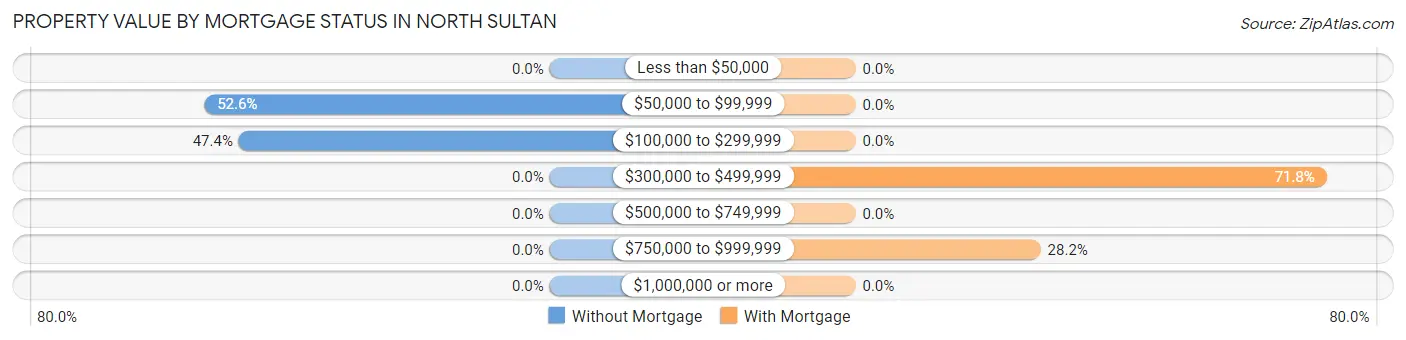
| Property Value | Without Mortgage | With Mortgage |
| Less than $50,000 | 0 (0.0%) | 0 (0.0%) |
| $50,000 to $99,999 | 10 (52.6%) | 0 (0.0%) |
| $100,000 to $299,999 | 9 (47.4%) | 0 (0.0%) |
| $300,000 to $499,999 | 0 (0.0%) | 56 (71.8%) |
| $500,000 to $749,999 | 0 (0.0%) | 0 (0.0%) |
| $750,000 to $999,999 | 0 (0.0%) | 22 (28.2%) |
| $1,000,000 or more | 0 (0.0%) | 0 (0.0%) |
| Total | 19 (100.0%) | 78 (100.0%) |
Household Income by Mortgage Status in North Sultan
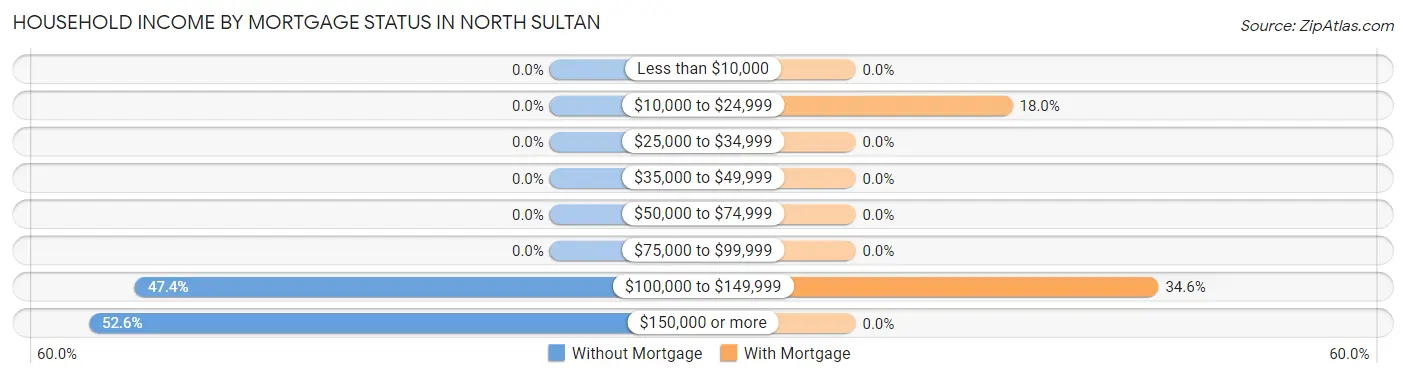
| Household Income | Without Mortgage | With Mortgage |
| Less than $10,000 | 0 (0.0%) | 0 (0.0%) |
| $10,000 to $24,999 | 0 (0.0%) | 14 (17.9%) |
| $25,000 to $34,999 | 0 (0.0%) | 0 (0.0%) |
| $35,000 to $49,999 | 0 (0.0%) | 0 (0.0%) |
| $50,000 to $74,999 | 0 (0.0%) | 0 (0.0%) |
| $75,000 to $99,999 | 0 (0.0%) | 0 (0.0%) |
| $100,000 to $149,999 | 9 (47.4%) | 27 (34.6%) |
| $150,000 or more | 10 (52.6%) | 0 (0.0%) |
| Total | 19 (100.0%) | 78 (100.0%) |
Property Value to Household Income Ratio in North Sultan
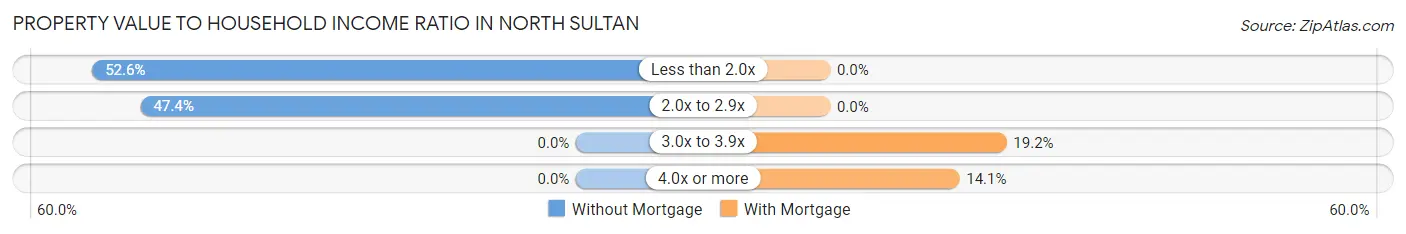
| Value-to-Income Ratio | Without Mortgage | With Mortgage |
| Less than 2.0x | 10 (52.6%) | 0 (0.0%) |
| 2.0x to 2.9x | 9 (47.4%) | 0 (0.0%) |
| 3.0x to 3.9x | 0 (0.0%) | 15 (19.2%) |
| 4.0x or more | 0 (0.0%) | 11 (14.1%) |
| Total | 19 (100.0%) | 78 (100.0%) |
Real Estate Taxes by Mortgage Status in North Sultan
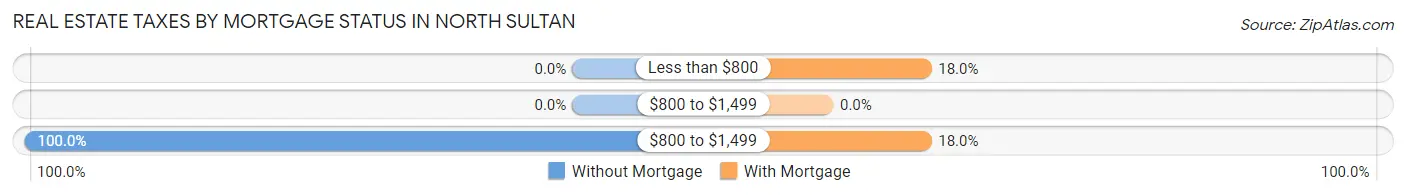
| Property Taxes | Without Mortgage | With Mortgage |
| Less than $800 | 0 (0.0%) | 14 (17.9%) |
| $800 to $1,499 | 0 (0.0%) | 0 (0.0%) |
| $800 to $1,499 | 19 (100.0%) | 14 (17.9%) |
| Total | 19 (100.0%) | 78 (100.0%) |
Health & Disability in North Sultan
Health Insurance Coverage by Age in North Sultan
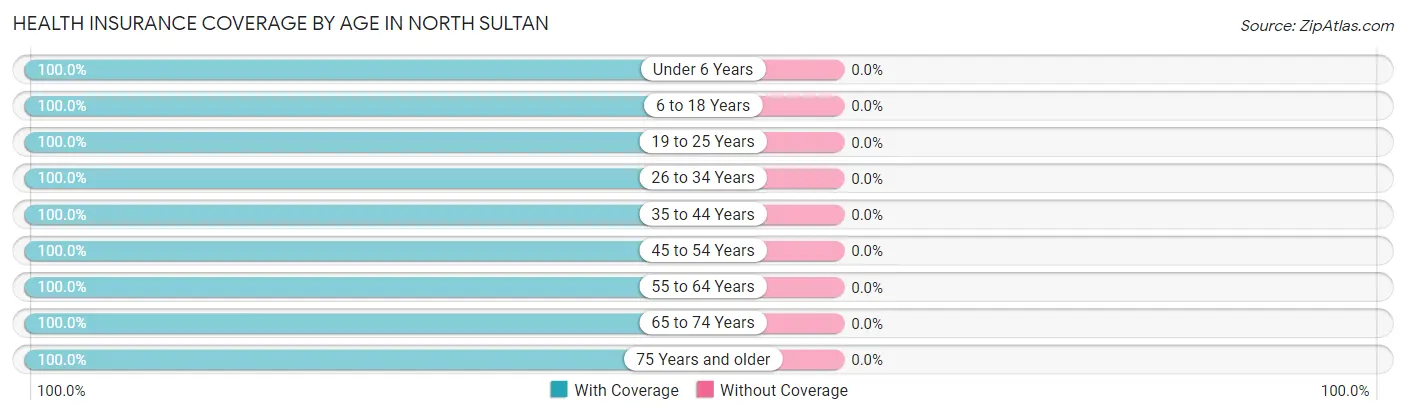
| Age Bracket | With Coverage | Without Coverage |
| Under 6 Years | 33 (100.0%) | 0 (0.0%) |
| 6 to 18 Years | 68 (100.0%) | 0 (0.0%) |
| 19 to 25 Years | 11 (100.0%) | 0 (0.0%) |
| 26 to 34 Years | 93 (100.0%) | 0 (0.0%) |
| 35 to 44 Years | 39 (100.0%) | 0 (0.0%) |
| 45 to 54 Years | 11 (100.0%) | 0 (0.0%) |
| 55 to 64 Years | 22 (100.0%) | 0 (0.0%) |
| 65 to 74 Years | 49 (100.0%) | 0 (0.0%) |
| 75 Years and older | 10 (100.0%) | 0 (0.0%) |
| Total | 336 (100.0%) | 0 (0.0%) |
Health Insurance Coverage by Citizenship Status in North Sultan
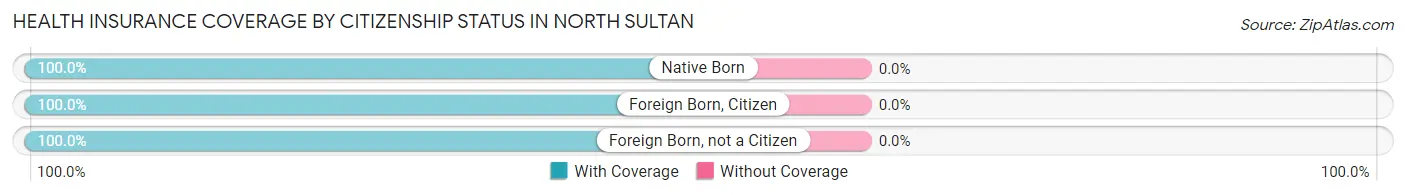
| Citizenship Status | With Coverage | Without Coverage |
| Native Born | 33 (100.0%) | 0 (0.0%) |
| Foreign Born, Citizen | 68 (100.0%) | 0 (0.0%) |
| Foreign Born, not a Citizen | 11 (100.0%) | 0 (0.0%) |
Health Insurance Coverage by Household Income in North Sultan
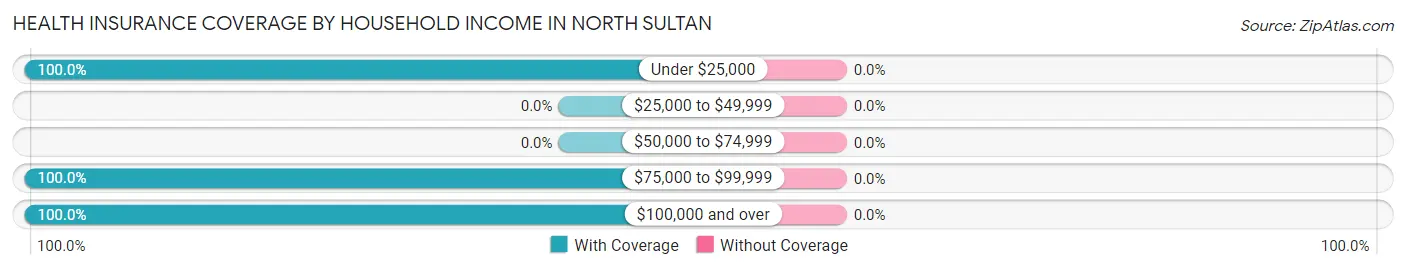
| Household Income | With Coverage | Without Coverage |
| Under $25,000 | 34 (100.0%) | 0 (0.0%) |
| $25,000 to $49,999 | 0 (0.0%) | 0 (0.0%) |
| $50,000 to $74,999 | 0 (0.0%) | 0 (0.0%) |
| $75,000 to $99,999 | 114 (100.0%) | 0 (0.0%) |
| $100,000 and over | 188 (100.0%) | 0 (0.0%) |
Public vs Private Health Insurance Coverage by Age in North Sultan
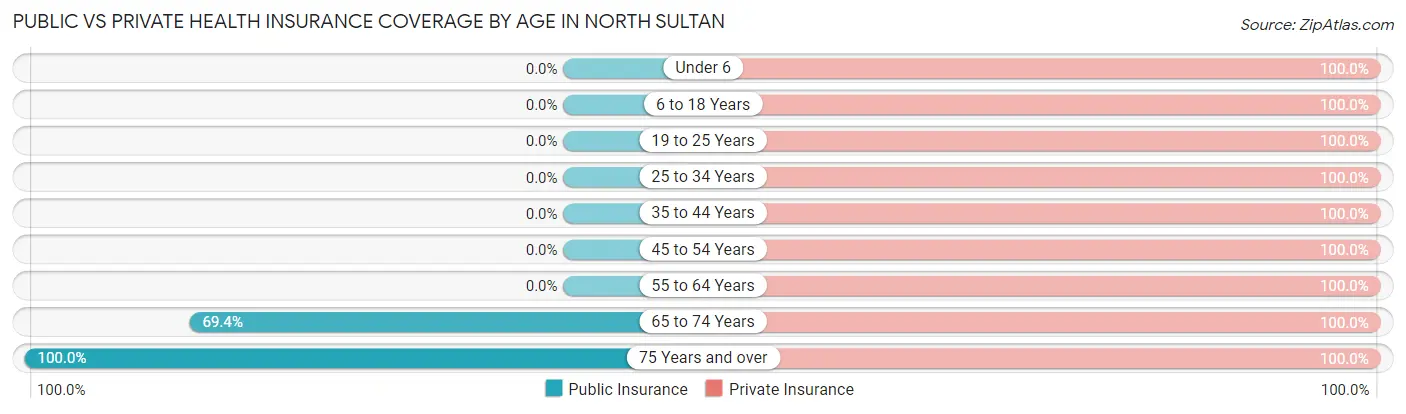
| Age Bracket | Public Insurance | Private Insurance |
| Under 6 | 0 (0.0%) | 33 (100.0%) |
| 6 to 18 Years | 0 (0.0%) | 68 (100.0%) |
| 19 to 25 Years | 0 (0.0%) | 11 (100.0%) |
| 25 to 34 Years | 0 (0.0%) | 93 (100.0%) |
| 35 to 44 Years | 0 (0.0%) | 39 (100.0%) |
| 45 to 54 Years | 0 (0.0%) | 11 (100.0%) |
| 55 to 64 Years | 0 (0.0%) | 22 (100.0%) |
| 65 to 74 Years | 34 (69.4%) | 49 (100.0%) |
| 75 Years and over | 10 (100.0%) | 10 (100.0%) |
| Total | 44 (13.1%) | 336 (100.0%) |
Disability Status by Sex by Age in North Sultan
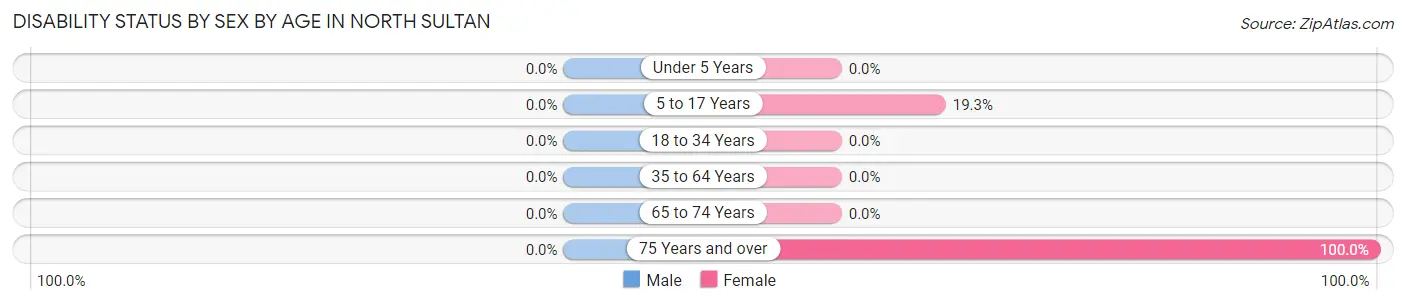
| Age Bracket | Male | Female |
| Under 5 Years | 0 (0.0%) | 0 (0.0%) |
| 5 to 17 Years | 0 (0.0%) | 11 (19.3%) |
| 18 to 34 Years | 0 (0.0%) | 0 (0.0%) |
| 35 to 64 Years | 0 (0.0%) | 0 (0.0%) |
| 65 to 74 Years | 0 (0.0%) | 0 (0.0%) |
| 75 Years and over | 0 (0.0%) | 10 (100.0%) |
Disability Class by Sex by Age in North Sultan
Disability Class: Hearing Difficulty
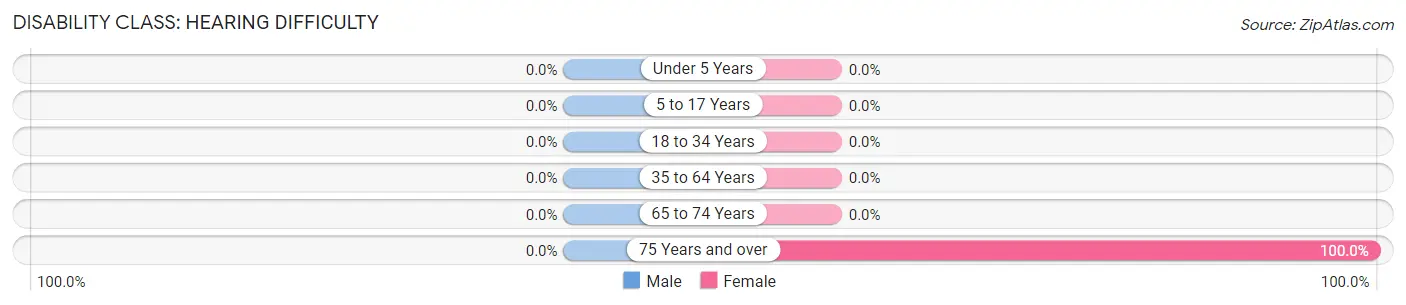
| Age Bracket | Male | Female |
| Under 5 Years | 0 (0.0%) | 0 (0.0%) |
| 5 to 17 Years | 0 (0.0%) | 0 (0.0%) |
| 18 to 34 Years | 0 (0.0%) | 0 (0.0%) |
| 35 to 64 Years | 0 (0.0%) | 0 (0.0%) |
| 65 to 74 Years | 0 (0.0%) | 0 (0.0%) |
| 75 Years and over | 0 (0.0%) | 10 (100.0%) |
Disability Class: Vision Difficulty
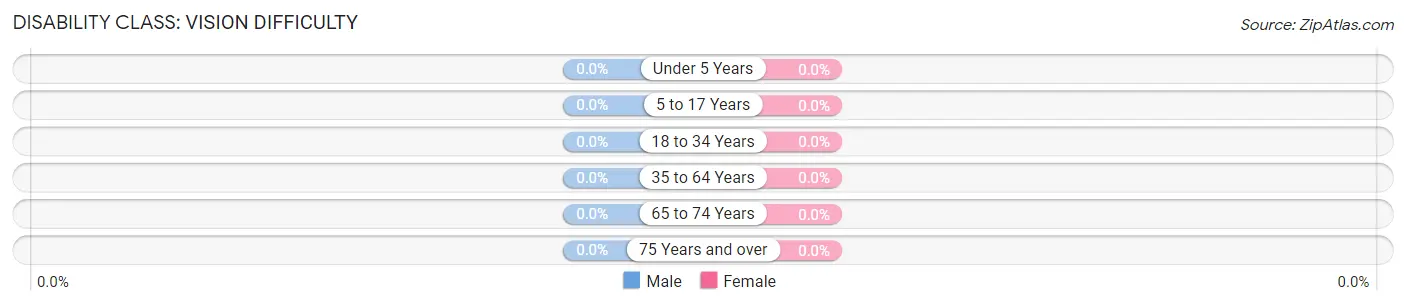
| Age Bracket | Male | Female |
| Under 5 Years | 0 (0.0%) | 0 (0.0%) |
| 5 to 17 Years | 0 (0.0%) | 0 (0.0%) |
| 18 to 34 Years | 0 (0.0%) | 0 (0.0%) |
| 35 to 64 Years | 0 (0.0%) | 0 (0.0%) |
| 65 to 74 Years | 0 (0.0%) | 0 (0.0%) |
| 75 Years and over | 0 (0.0%) | 0 (0.0%) |
Disability Class: Cognitive Difficulty
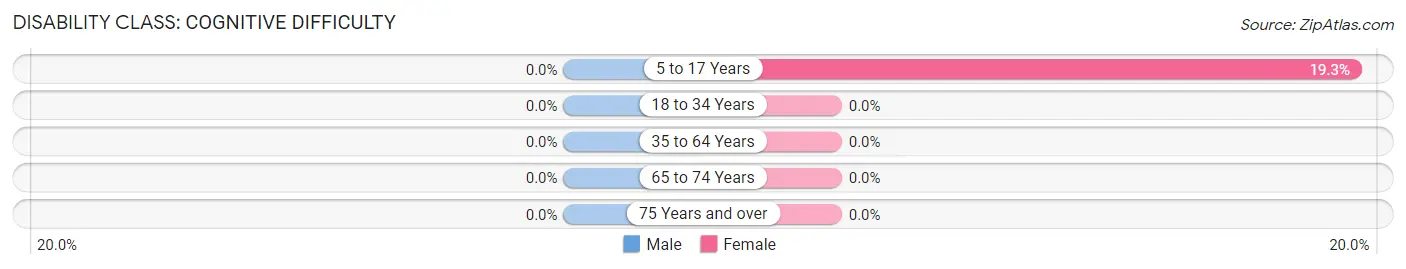
| Age Bracket | Male | Female |
| 5 to 17 Years | 0 (0.0%) | 11 (19.3%) |
| 18 to 34 Years | 0 (0.0%) | 0 (0.0%) |
| 35 to 64 Years | 0 (0.0%) | 0 (0.0%) |
| 65 to 74 Years | 0 (0.0%) | 0 (0.0%) |
| 75 Years and over | 0 (0.0%) | 0 (0.0%) |
Disability Class: Ambulatory Difficulty
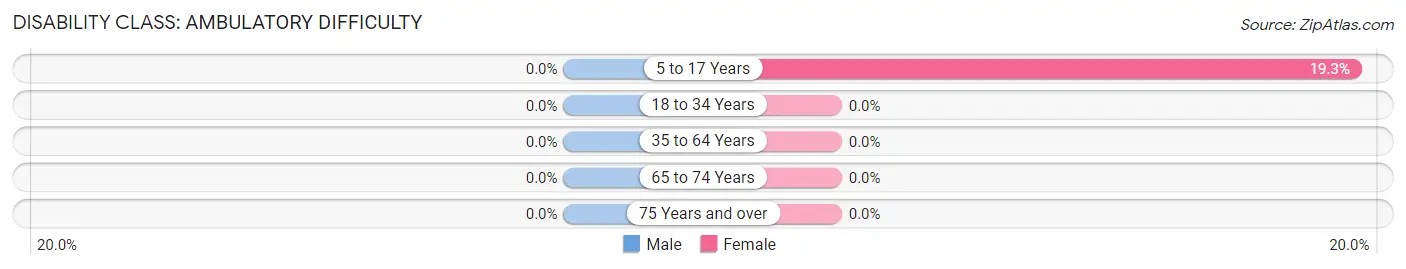
| Age Bracket | Male | Female |
| 5 to 17 Years | 0 (0.0%) | 11 (19.3%) |
| 18 to 34 Years | 0 (0.0%) | 0 (0.0%) |
| 35 to 64 Years | 0 (0.0%) | 0 (0.0%) |
| 65 to 74 Years | 0 (0.0%) | 0 (0.0%) |
| 75 Years and over | 0 (0.0%) | 0 (0.0%) |
Disability Class: Self-Care Difficulty
| Age Bracket | Male | Female |
| 5 to 17 Years | 0 (0.0%) | 0 (0.0%) |
| 18 to 34 Years | 0 (0.0%) | 0 (0.0%) |
| 35 to 64 Years | 0 (0.0%) | 0 (0.0%) |
| 65 to 74 Years | 0 (0.0%) | 0 (0.0%) |
| 75 Years and over | 0 (0.0%) | 0 (0.0%) |
Technology Access in North Sultan
Computing Device Access in North Sultan
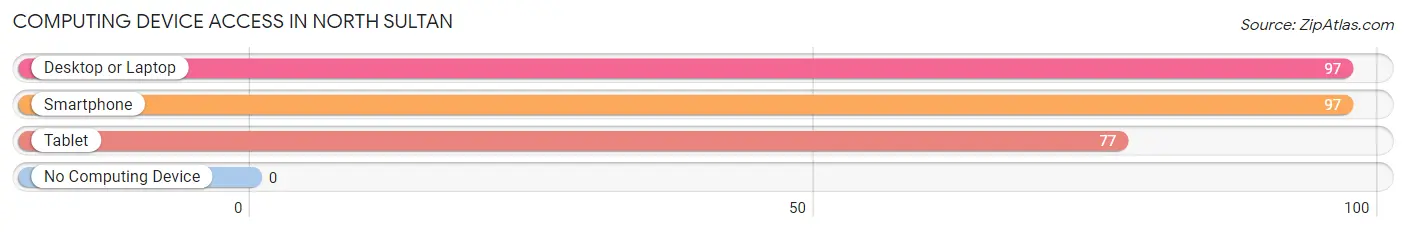
| Device Type | # Households | % Households |
| Desktop or Laptop | 97 | 100.0% |
| Smartphone | 97 | 100.0% |
| Tablet | 77 | 79.4% |
| No Computing Device | 0 | 0.0% |
| Total | 97 | 100.0% |
Internet Access in North Sultan
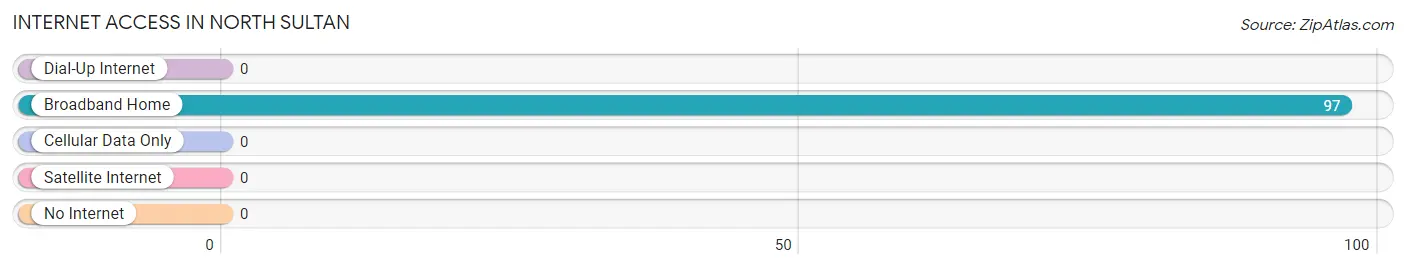
| Internet Type | # Households | % Households |
| Dial-Up Internet | 0 | 0.0% |
| Broadband Home | 97 | 100.0% |
| Cellular Data Only | 0 | 0.0% |
| Satellite Internet | 0 | 0.0% |
| No Internet | 0 | 0.0% |
| Total | 97 | 100.0% |
North Sultan Summary
Sultan, Washington is a small city located in the foothills of the Cascade Mountains in Snohomish County, Washington. The city is located about 30 miles northeast of Seattle and is part of the Seattle metropolitan area. The city was founded in 1891 and has a population of about 5,000 people.
History
The area that is now Sultan was originally inhabited by the Snohomish people, who were part of the Coast Salish tribe. The first European settlers arrived in the area in the late 1800s and the city was officially incorporated in 1891. The city was named after Sultan, a local Native American chief.
The city was originally a logging town, and the timber industry was the main source of employment for many years. In the early 1900s, the city was home to several sawmills and logging camps. The timber industry declined in the mid-1900s, and the city began to diversify its economy.
Geography
Sultan is located in the foothills of the Cascade Mountains in Snohomish County, Washington. The city is located about 30 miles northeast of Seattle and is part of the Seattle metropolitan area. The city is situated at the confluence of the Skykomish and Sultan Rivers. The city has a total area of 2.3 square miles, all of which is land.
The city is surrounded by forests and mountains, and the nearby Cascade Mountains provide a scenic backdrop. The city is located in a temperate rainforest climate, with mild temperatures and abundant rainfall.
Economy
The economy of Sultan is largely based on tourism and outdoor recreation. The city is home to several outdoor recreation areas, including Wallace Falls State Park and the Skykomish River. The city is also home to several small businesses, including restaurants, shops, and galleries.
The city is also home to several manufacturing companies, including a paper mill and a wood products plant. The city is also home to several technology companies, including Microsoft and Amazon.
Demographics
As of the 2010 census, the population of Sultan was 5,231. The racial makeup of the city was 87.3% White, 0.7% African American, 1.2% Native American, 0.7% Asian, 0.1% Pacific Islander, 6.2% from other races, and 3.9% from two or more races. Hispanic or Latino of any race were 11.2% of the population.
The median income for a household in the city was $50,902, and the median income for a family was $58,958. The per capita income for the city was $22,945. About 10.2% of families and 13.2% of the population were below the poverty line, including 17.2% of those under age 18 and 8.2% of those age 65 or over.
Common Questions
What is Per Capita Income in North Sultan?
Per Capita income in North Sultan is $43,979.
What is the Median Family Income in North Sultan?
Median Family Income in North Sultan is $142,083.
What is the Median Household income in North Sultan?
Median Household Income in North Sultan is $142,083.
What is Income or Wage Gap in North Sultan?
Income or Wage Gap in North Sultan is 29.9%.
Women in North Sultan earn 70.1 cents for every dollar earned by a man.
What is Inequality or Gini Index in North Sultan?
Inequality or Gini Index in North Sultan is 0.37.
What is the Total Population of North Sultan?
Total Population of North Sultan is 336.
What is the Total Male Population of North Sultan?
Total Male Population of North Sultan is 124.
What is the Total Female Population of North Sultan?
Total Female Population of North Sultan is 212.
What is the Ratio of Males per 100 Females in North Sultan?
There are 58.49 Males per 100 Females in North Sultan.
What is the Ratio of Females per 100 Males in North Sultan?
There are 170.97 Females per 100 Males in North Sultan.
What is the Median Population Age in North Sultan?
Median Population Age in North Sultan is 31.8 Years.
What is the Average Family Size in North Sultan
Average Family Size in North Sultan is 3.5 People.
What is the Average Household Size in North Sultan
Average Household Size in North Sultan is 3.5 People.
How Large is the Labor Force in North Sultan?
There are 168 People in the Labor Forcein in North Sultan.
What is the Percentage of People in the Labor Force in North Sultan?
68.3% of People are in the Labor Force in North Sultan.