High Bridge, WA Map & Demographics
High Bridge Map
High Bridge Overview
$66,736
PER CAPITA INCOME
$164,881
AVG FAMILY INCOME
$162,560
AVG HOUSEHOLD INCOME
50.1%
WAGE / INCOME GAP [ % ]
49.9¢/ $1
WAGE / INCOME GAP [ $ ]
0.36
INEQUALITY / GINI INDEX
2,871
TOTAL POPULATION
1,403
MALE POPULATION
1,468
FEMALE POPULATION
95.57
MALES / 100 FEMALES
104.63
FEMALES / 100 MALES
50.6
MEDIAN AGE
3.0
AVG FAMILY SIZE
2.9
AVG HOUSEHOLD SIZE
1,502
LABOR FORCE [ PEOPLE ]
65.6%
PERCENT IN LABOR FORCE
3.3%
UNEMPLOYMENT RATE
Income in High Bridge
Income Overview in High Bridge
Per Capita Income in High Bridge is $66,736, while median incomes of families and households are $164,881 and $162,560 respectively.
| Characteristic | Number | Measure |
| Per Capita Income | 2,871 | $66,736 |
| Median Family Income | 880 | $164,881 |
| Mean Family Income | 880 | $199,020 |
| Median Household Income | 997 | $162,560 |
| Mean Household Income | 997 | $189,102 |
| Income Deficit | 880 | $0 |
| Wage / Income Gap (%) | 2,871 | 50.11% |
| Wage / Income Gap ($) | 2,871 | 49.89¢ per $1 |
| Gini / Inequality Index | 2,871 | 0.36 |
Earnings by Sex in High Bridge
Average Earnings in High Bridge are $63,900, $93,533 for men and $46,659 for women, a difference of 50.1%.
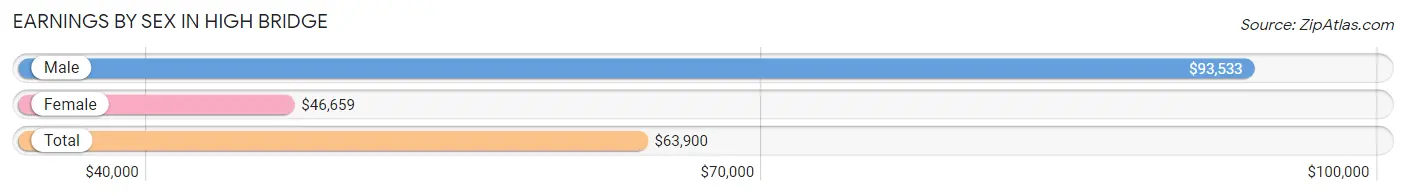
| Sex | Number | Average Earnings |
| Male | 823 (52.8%) | $93,533 |
| Female | 737 (47.2%) | $46,659 |
| Total | 1,560 (100.0%) | $63,900 |
Earnings by Sex by Income Bracket in High Bridge
The most common earnings brackets in High Bridge are $100,000+ for men (389 | 47.3%) and $100,000+ for women (168 | 22.8%).
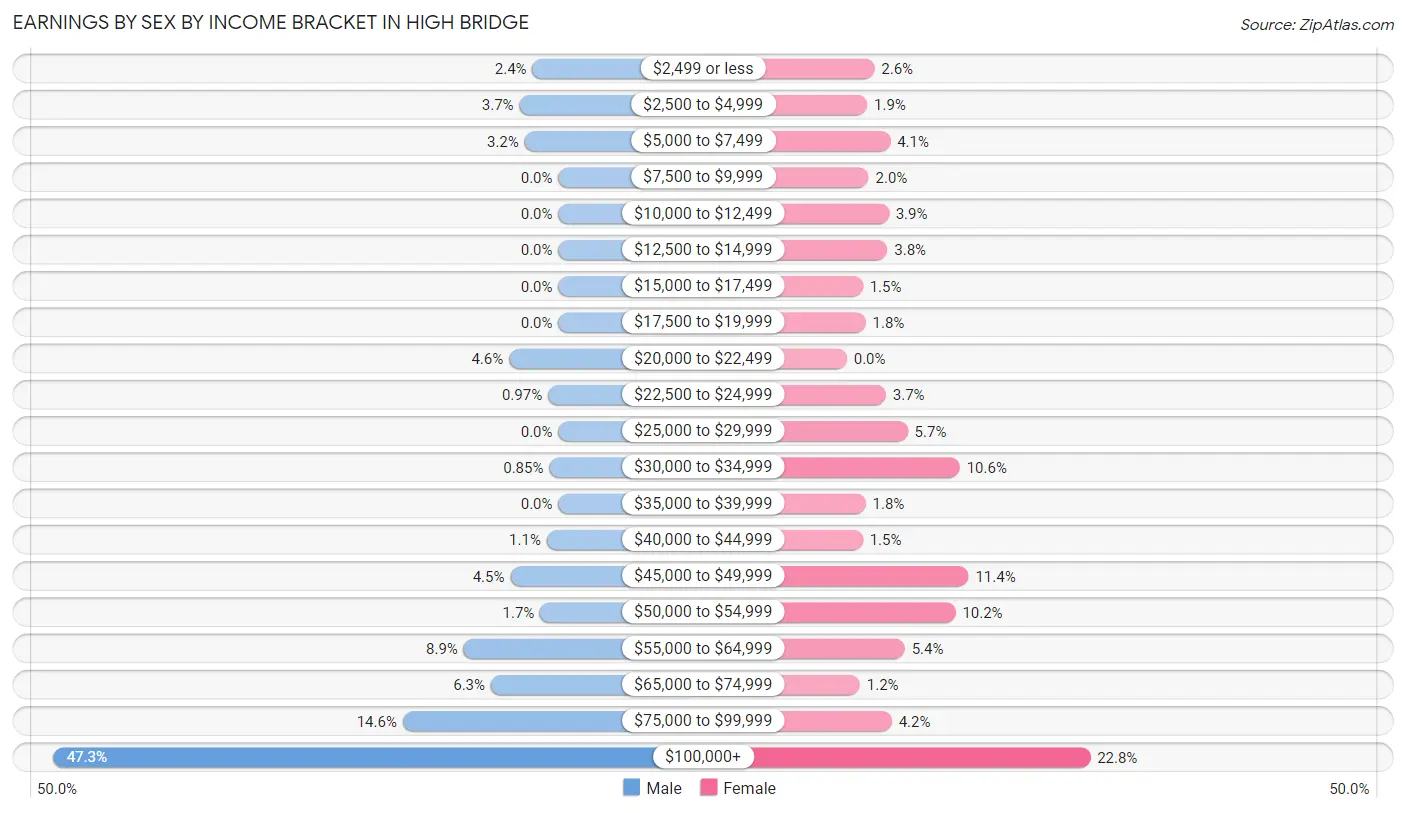
| Income | Male | Female |
| $2,499 or less | 20 (2.4%) | 19 (2.6%) |
| $2,500 to $4,999 | 30 (3.6%) | 14 (1.9%) |
| $5,000 to $7,499 | 26 (3.2%) | 30 (4.1%) |
| $7,500 to $9,999 | 0 (0.0%) | 15 (2.0%) |
| $10,000 to $12,499 | 0 (0.0%) | 29 (3.9%) |
| $12,500 to $14,999 | 0 (0.0%) | 28 (3.8%) |
| $15,000 to $17,499 | 0 (0.0%) | 11 (1.5%) |
| $17,500 to $19,999 | 0 (0.0%) | 13 (1.8%) |
| $20,000 to $22,499 | 38 (4.6%) | 0 (0.0%) |
| $22,500 to $24,999 | 8 (1.0%) | 27 (3.7%) |
| $25,000 to $29,999 | 0 (0.0%) | 42 (5.7%) |
| $30,000 to $34,999 | 7 (0.9%) | 78 (10.6%) |
| $35,000 to $39,999 | 0 (0.0%) | 13 (1.8%) |
| $40,000 to $44,999 | 9 (1.1%) | 11 (1.5%) |
| $45,000 to $49,999 | 37 (4.5%) | 84 (11.4%) |
| $50,000 to $54,999 | 14 (1.7%) | 75 (10.2%) |
| $55,000 to $64,999 | 73 (8.9%) | 40 (5.4%) |
| $65,000 to $74,999 | 52 (6.3%) | 9 (1.2%) |
| $75,000 to $99,999 | 120 (14.6%) | 31 (4.2%) |
| $100,000+ | 389 (47.3%) | 168 (22.8%) |
| Total | 823 (100.0%) | 737 (100.0%) |
Earnings by Sex by Educational Attainment in High Bridge
Average earnings in High Bridge are $106,176 for men and $50,000 for women, a difference of 52.9%. Men with an educational attainment of graduate degree enjoy the highest average annual earnings of $174,444, while those with college or associate's degree education earn the least with $73,295. Women with an educational attainment of bachelor's degree earn the most with the average annual earnings of $105,962, while those with college or associate's degree education have the smallest earnings of $46,296.
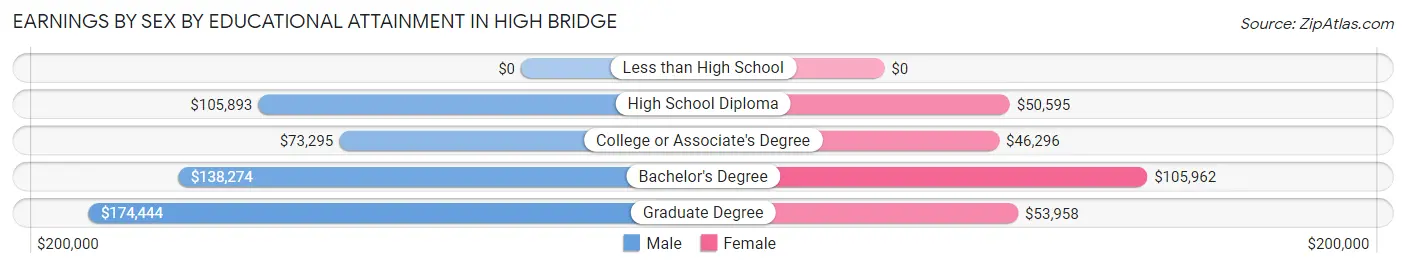
| Educational Attainment | Male Income | Female Income |
| Less than High School | - | - |
| High School Diploma | $105,893 | $50,595 |
| College or Associate's Degree | $73,295 | $46,296 |
| Bachelor's Degree | $138,274 | $105,962 |
| Graduate Degree | $174,444 | $53,958 |
| Total | $106,176 | $50,000 |
Family Income in High Bridge
Family Income Brackets in High Bridge
According to the High Bridge family income data, there are 351 families falling into the $200,000+ income range, which is the most common income bracket and makes up 39.9% of all families.
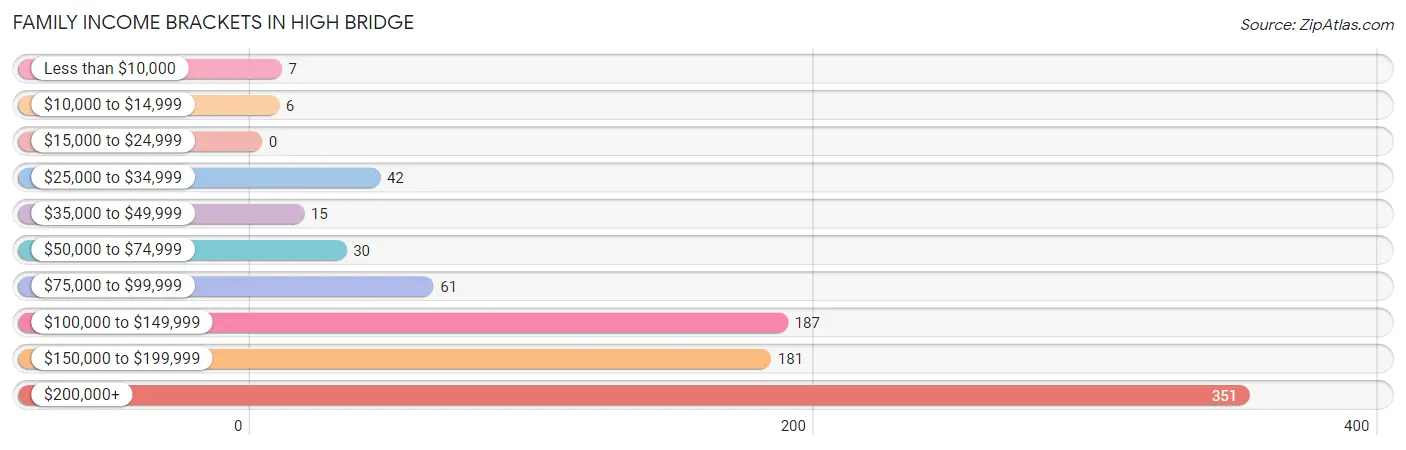
| Income Bracket | # Families | % Families |
| Less than $10,000 | 7 | 0.8% |
| $10,000 to $14,999 | 6 | 0.7% |
| $15,000 to $24,999 | 0 | 0.0% |
| $25,000 to $34,999 | 42 | 4.8% |
| $35,000 to $49,999 | 15 | 1.7% |
| $50,000 to $74,999 | 30 | 3.4% |
| $75,000 to $99,999 | 61 | 6.9% |
| $100,000 to $149,999 | 187 | 21.3% |
| $150,000 to $199,999 | 181 | 20.6% |
| $200,000+ | 351 | 39.9% |
Family Income by Famaliy Size in High Bridge
5-person families (51 | 5.8%) account for the highest median family income in High Bridge with $213,854 per family, while 2-person families (439 | 49.9%) have the highest median income of $78,688 per family member.
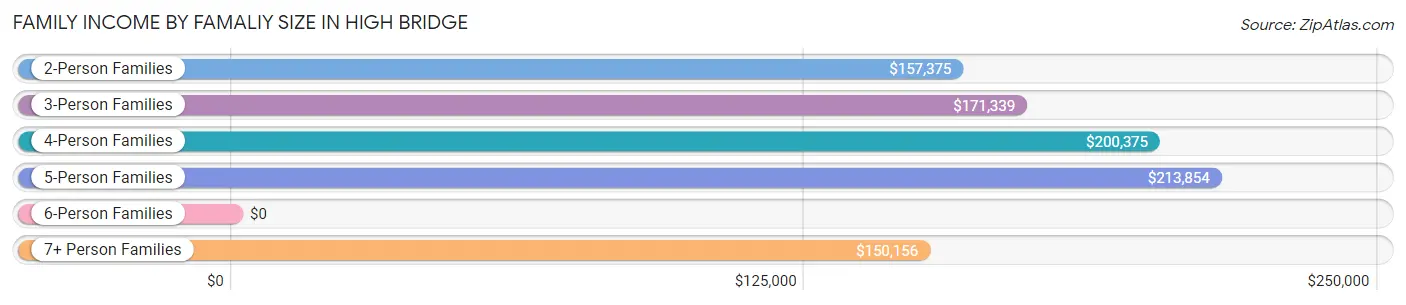
| Income Bracket | # Families | Median Income |
| 2-Person Families | 439 (49.9%) | $157,375 |
| 3-Person Families | 247 (28.1%) | $171,339 |
| 4-Person Families | 81 (9.2%) | $200,375 |
| 5-Person Families | 51 (5.8%) | $213,854 |
| 6-Person Families | 32 (3.6%) | $0 |
| 7+ Person Families | 30 (3.4%) | $150,156 |
| Total | 880 (100.0%) | $164,881 |
Family Income by Number of Earners in High Bridge
The median family income in High Bridge is $164,881, with families comprising 2 earners (436) having the highest median family income of $198,000, while families with 1 earner (211) have the lowest median family income of $120,250, accounting for 49.5% and 24.0% of families, respectively.
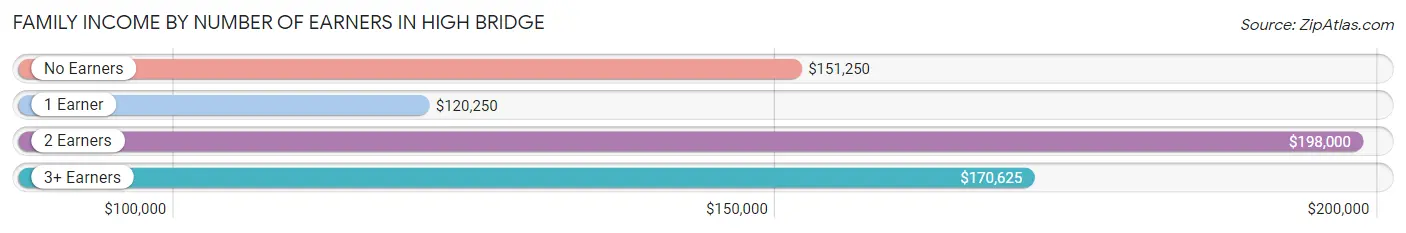
| Number of Earners | # Families | Median Income |
| No Earners | 136 (15.4%) | $151,250 |
| 1 Earner | 211 (24.0%) | $120,250 |
| 2 Earners | 436 (49.5%) | $198,000 |
| 3+ Earners | 97 (11.0%) | $170,625 |
| Total | 880 (100.0%) | $164,881 |
Household Income in High Bridge
Household Income Brackets in High Bridge
With 383 households falling in the category, the $200,000+ income range is the most frequent in High Bridge, accounting for 38.4% of all households. In contrast, only 6 households (0.6%) fall into the $10,000 to $14,999 income bracket, making it the least populous group.
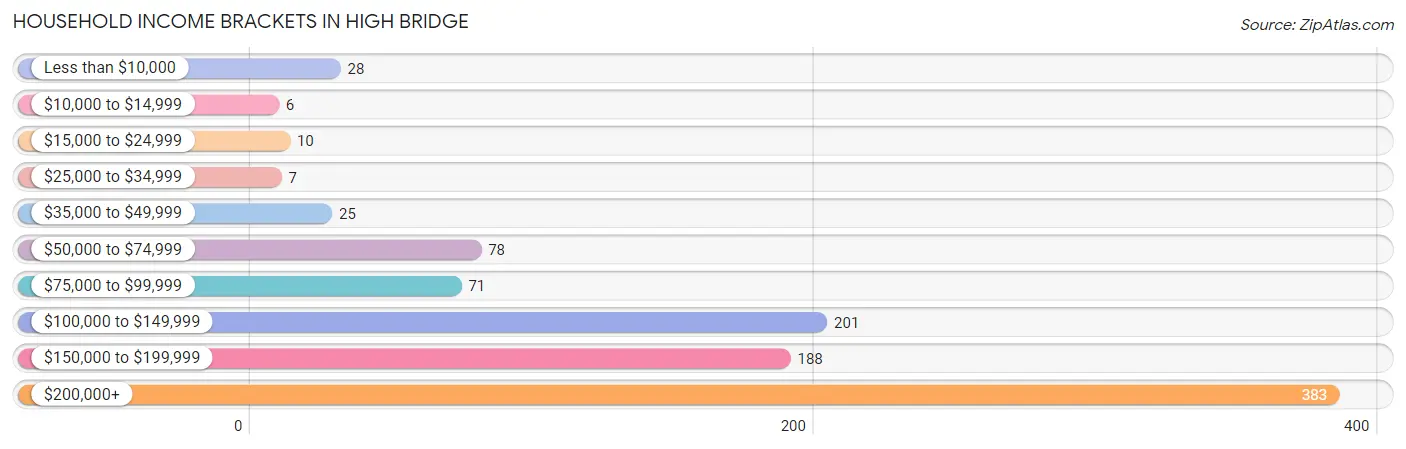
| Income Bracket | # Households | % Households |
| Less than $10,000 | 28 | 2.8% |
| $10,000 to $14,999 | 6 | 0.6% |
| $15,000 to $24,999 | 10 | 1.0% |
| $25,000 to $34,999 | 7 | 0.7% |
| $35,000 to $49,999 | 25 | 2.5% |
| $50,000 to $74,999 | 78 | 7.8% |
| $75,000 to $99,999 | 71 | 7.1% |
| $100,000 to $149,999 | 201 | 20.2% |
| $150,000 to $199,999 | 188 | 18.9% |
| $200,000+ | 383 | 38.4% |
Household Income by Householder Age in High Bridge
The median household income in High Bridge is $162,560, with the highest median household income of $207,813 found in the 25 to 44 years age bracket for the primary householder. A total of 183 households (18.4%) fall into this category.
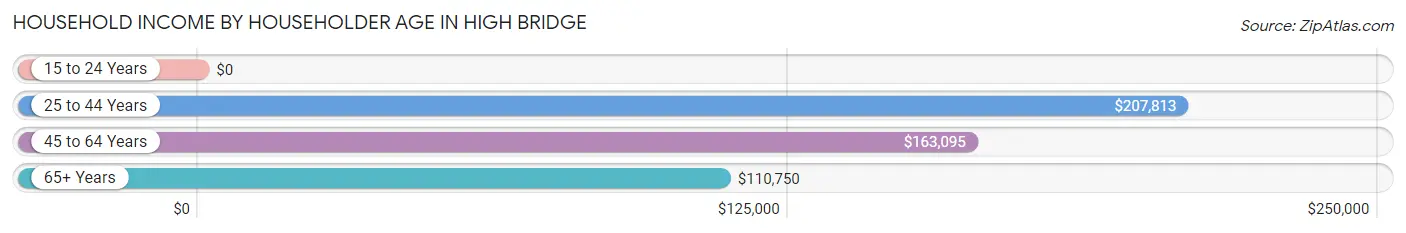
| Income Bracket | # Households | Median Income |
| 15 to 24 Years | 0 (0.0%) | $0 |
| 25 to 44 Years | 183 (18.4%) | $207,813 |
| 45 to 64 Years | 572 (57.4%) | $163,095 |
| 65+ Years | 242 (24.3%) | $110,750 |
| Total | 997 (100.0%) | $162,560 |
Poverty in High Bridge
Income Below Poverty by Sex and Age in High Bridge
With 3.5% poverty level for males and 1.7% for females among the residents of High Bridge, 75 year old and over males and 75 year old and over females are the most vulnerable to poverty, with 6 males (14.3%) and 11 females (20.7%) in their respective age groups living below the poverty level.
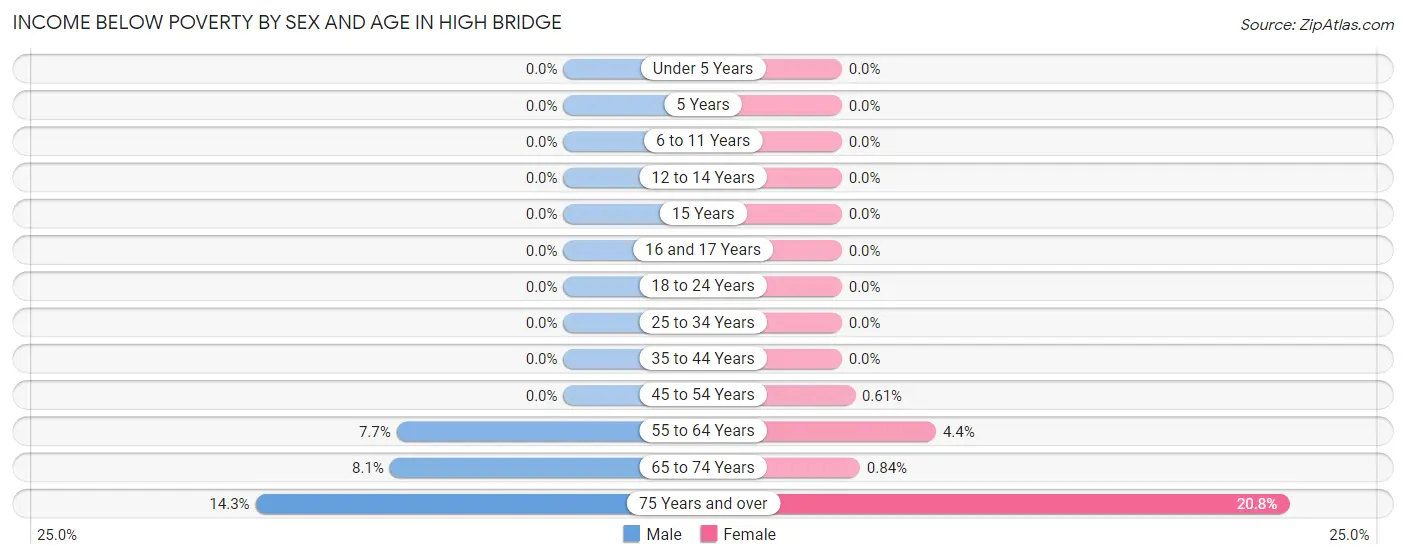
| Age Bracket | Male | Female |
| Under 5 Years | 0 (0.0%) | 0 (0.0%) |
| 5 Years | 0 (0.0%) | 0 (0.0%) |
| 6 to 11 Years | 0 (0.0%) | 0 (0.0%) |
| 12 to 14 Years | 0 (0.0%) | 0 (0.0%) |
| 15 Years | 0 (0.0%) | 0 (0.0%) |
| 16 and 17 Years | 0 (0.0%) | 0 (0.0%) |
| 18 to 24 Years | 0 (0.0%) | 0 (0.0%) |
| 25 to 34 Years | 0 (0.0%) | 0 (0.0%) |
| 35 to 44 Years | 0 (0.0%) | 0 (0.0%) |
| 45 to 54 Years | 0 (0.0%) | 2 (0.6%) |
| 55 to 64 Years | 25 (7.7%) | 10 (4.4%) |
| 65 to 74 Years | 17 (8.1%) | 2 (0.8%) |
| 75 Years and over | 6 (14.3%) | 11 (20.7%) |
| Total | 48 (3.5%) | 25 (1.7%) |
Income Above Poverty by Sex and Age in High Bridge
According to the poverty statistics in High Bridge, males aged under 5 years and females aged under 5 years are the age groups that are most secure financially, with 100.0% of males and 100.0% of females in these age groups living above the poverty line.
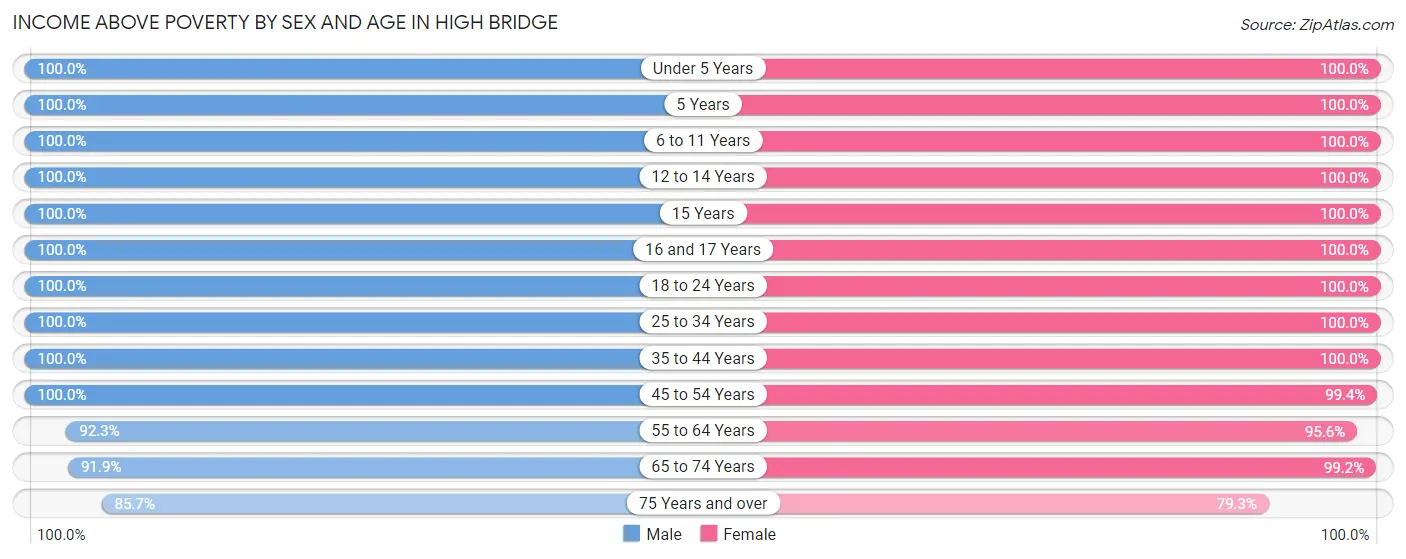
| Age Bracket | Male | Female |
| Under 5 Years | 42 (100.0%) | 73 (100.0%) |
| 5 Years | 6 (100.0%) | 17 (100.0%) |
| 6 to 11 Years | 131 (100.0%) | 83 (100.0%) |
| 12 to 14 Years | 61 (100.0%) | 34 (100.0%) |
| 15 Years | 37 (100.0%) | 49 (100.0%) |
| 16 and 17 Years | 32 (100.0%) | 34 (100.0%) |
| 18 to 24 Years | 50 (100.0%) | 86 (100.0%) |
| 25 to 34 Years | 69 (100.0%) | 111 (100.0%) |
| 35 to 44 Years | 172 (100.0%) | 107 (100.0%) |
| 45 to 54 Years | 208 (100.0%) | 324 (99.4%) |
| 55 to 64 Years | 298 (92.3%) | 219 (95.6%) |
| 65 to 74 Years | 194 (91.9%) | 235 (99.2%) |
| 75 Years and over | 36 (85.7%) | 42 (79.2%) |
| Total | 1,336 (96.5%) | 1,414 (98.3%) |
Income Below Poverty Among Married-Couple Families in High Bridge
The poverty statistics for married-couple families in High Bridge show that 1.6% or 13 of the total 817 families live below the poverty line. Families with no children have the highest poverty rate of 2.3%, comprising of 13 families. On the other hand, families with 1 or 2 children have the lowest poverty rate of 0.0%, which includes 0 families.
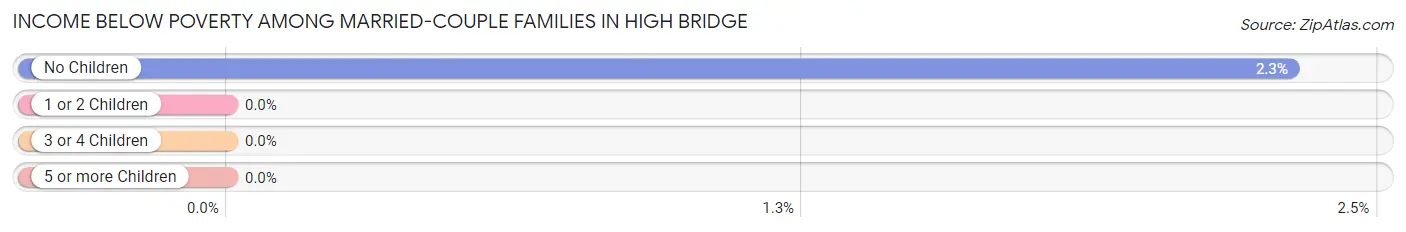
| Children | Above Poverty | Below Poverty |
| No Children | 549 (97.7%) | 13 (2.3%) |
| 1 or 2 Children | 193 (100.0%) | 0 (0.0%) |
| 3 or 4 Children | 41 (100.0%) | 0 (0.0%) |
| 5 or more Children | 21 (100.0%) | 0 (0.0%) |
| Total | 804 (98.4%) | 13 (1.6%) |
Income Below Poverty Among Single-Parent Households in High Bridge
| Children | Single Father | Single Mother |
| No Children | 0 (0.0%) | 0 (0.0%) |
| 1 or 2 Children | 0 (0.0%) | 0 (0.0%) |
| 3 or 4 Children | 0 (0.0%) | 0 (0.0%) |
| 5 or more Children | 0 (0.0%) | 0 (0.0%) |
| Total | 0 (0.0%) | 0 (0.0%) |
Income Below Poverty Among Married-Couple vs Single-Parent Households in High Bridge
| Children | Married-Couple Families | Single-Parent Households |
| No Children | 13 (2.3%) | 0 (0.0%) |
| 1 or 2 Children | 0 (0.0%) | 0 (0.0%) |
| 3 or 4 Children | 0 (0.0%) | 0 (0.0%) |
| 5 or more Children | 0 (0.0%) | 0 (0.0%) |
| Total | 13 (1.6%) | 0 (0.0%) |
Race in High Bridge
The most populous races in High Bridge are White / Caucasian (2,263 | 78.8%), Two or more Races (284 | 9.9%), and Some other Race (114 | 4.0%).
| Race | # Population | % Population |
| Asian | 72 | 2.5% |
| Black / African American | 79 | 2.8% |
| Hawaiian / Pacific | 11 | 0.4% |
| Hispanic or Latino | 100 | 3.5% |
| Native / Alaskan | 48 | 1.7% |
| White / Caucasian | 2,263 | 78.8% |
| Two or more Races | 284 | 9.9% |
| Some other Race | 114 | 4.0% |
| Total | 2,871 | 100.0% |
Ancestry in High Bridge
The most populous ancestries reported in High Bridge are German (571 | 19.9%), English (489 | 17.0%), Irish (444 | 15.5%), American (298 | 10.4%), and Korean (205 | 7.1%), together accounting for 69.9% of all High Bridge residents.
| Ancestry | # Population | % Population |
| African | 44 | 1.5% |
| American | 298 | 10.4% |
| Arab | 91 | 3.2% |
| British | 38 | 1.3% |
| Burmese | 13 | 0.4% |
| Central American | 11 | 0.4% |
| Cherokee | 5 | 0.2% |
| Croatian | 10 | 0.4% |
| Cuban | 48 | 1.7% |
| Danish | 119 | 4.1% |
| English | 489 | 17.0% |
| European | 44 | 1.5% |
| Finnish | 93 | 3.2% |
| French | 101 | 3.5% |
| French Canadian | 50 | 1.7% |
| German | 571 | 19.9% |
| Hungarian | 19 | 0.7% |
| Icelander | 12 | 0.4% |
| Indian (Asian) | 31 | 1.1% |
| Irish | 444 | 15.5% |
| Italian | 72 | 2.5% |
| Korean | 205 | 7.1% |
| Lebanese | 16 | 0.6% |
| Luxembourger | 2 | 0.1% |
| Mexican | 41 | 1.4% |
| Native Hawaiian | 11 | 0.4% |
| New Zealander | 16 | 0.6% |
| Nicaraguan | 11 | 0.4% |
| Northern European | 19 | 0.7% |
| Norwegian | 162 | 5.6% |
| Polish | 20 | 0.7% |
| Portuguese | 48 | 1.7% |
| Pueblo | 2 | 0.1% |
| Puget Sound Salish | 48 | 1.7% |
| Russian | 53 | 1.8% |
| Scandinavian | 94 | 3.3% |
| Scotch-Irish | 5 | 0.2% |
| Scottish | 58 | 2.0% |
| Soviet Union | 10 | 0.4% |
| Subsaharan African | 44 | 1.5% |
| Swedish | 184 | 6.4% |
| Syrian | 91 | 3.2% |
| Turkish | 11 | 0.4% |
| Ukrainian | 7 | 0.2% |
| Welsh | 18 | 0.6% | View All 45 Rows |
Immigrants in High Bridge
The most numerous immigrant groups reported in High Bridge came from Europe (93 | 3.2%), Asia (58 | 2.0%), Germany (49 | 1.7%), Western Europe (49 | 1.7%), and Eastern Europe (44 | 1.5%), together accounting for 10.2% of all High Bridge residents.
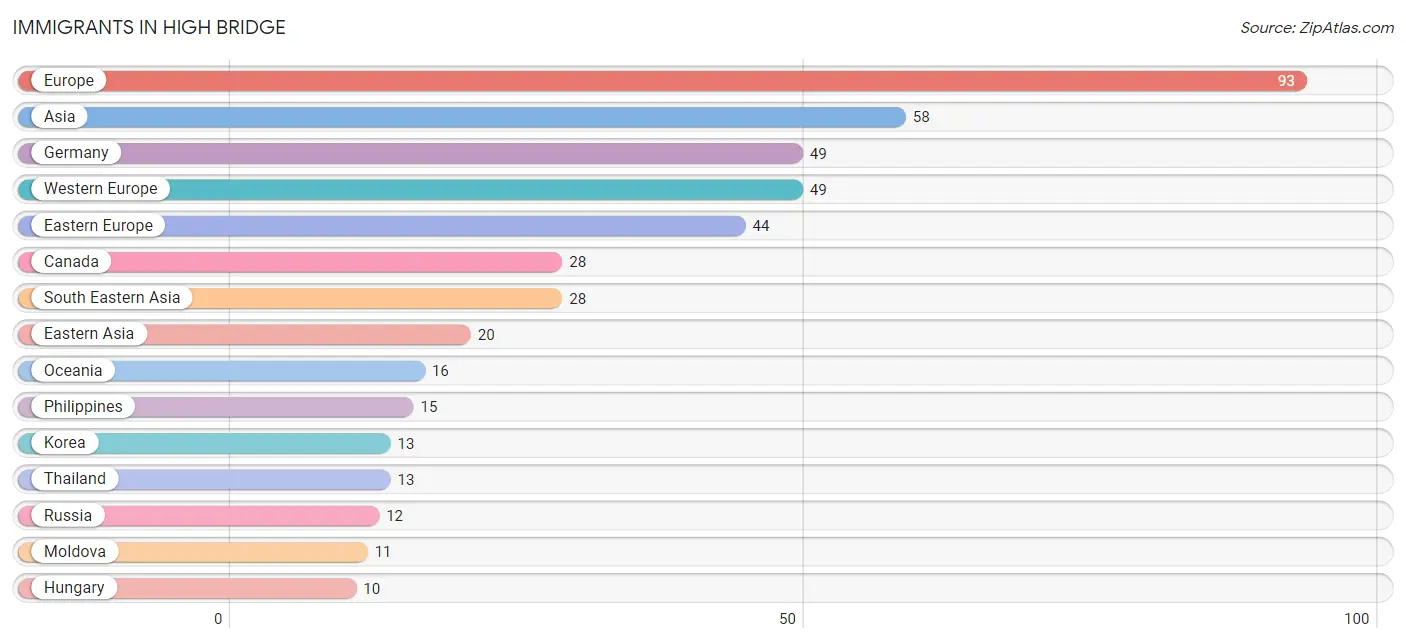
| Immigration Origin | # Population | % Population |
| Asia | 58 | 2.0% |
| Canada | 28 | 1.0% |
| China | 7 | 0.2% |
| Eastern Asia | 20 | 0.7% |
| Eastern Europe | 44 | 1.5% |
| Europe | 93 | 3.2% |
| Germany | 49 | 1.7% |
| Hong Kong | 7 | 0.2% |
| Hungary | 10 | 0.4% |
| Korea | 13 | 0.4% |
| Moldova | 11 | 0.4% |
| Oceania | 16 | 0.6% |
| Philippines | 15 | 0.5% |
| Russia | 12 | 0.4% |
| South Central Asia | 10 | 0.4% |
| South Eastern Asia | 28 | 1.0% |
| Thailand | 13 | 0.4% |
| Western Europe | 49 | 1.7% | View All 18 Rows |
Sex and Age in High Bridge
Sex and Age in High Bridge
The most populous age groups in High Bridge are 50 to 54 Years (185 | 13.2%) for men and 50 to 54 Years (182 | 12.4%) for women.
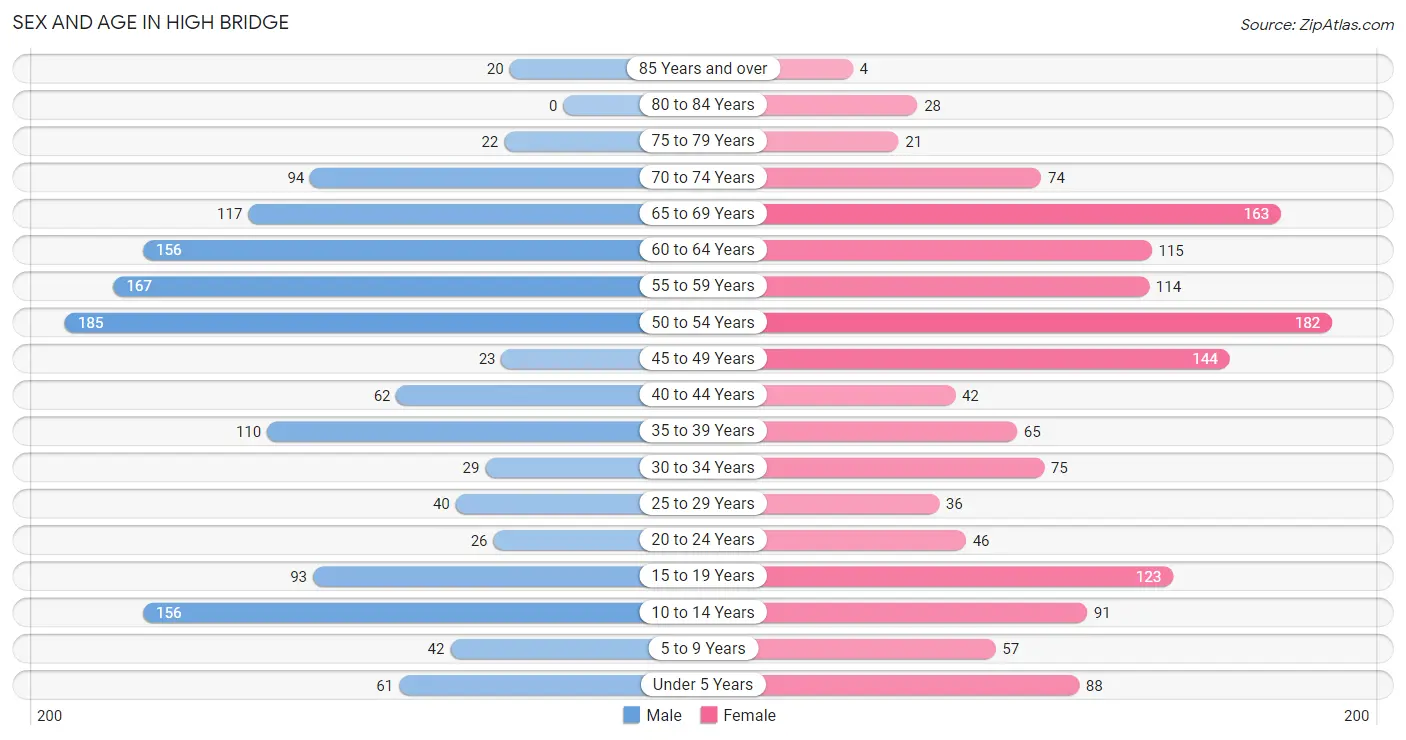
| Age Bracket | Male | Female |
| Under 5 Years | 61 (4.3%) | 88 (6.0%) |
| 5 to 9 Years | 42 (3.0%) | 57 (3.9%) |
| 10 to 14 Years | 156 (11.1%) | 91 (6.2%) |
| 15 to 19 Years | 93 (6.6%) | 123 (8.4%) |
| 20 to 24 Years | 26 (1.8%) | 46 (3.1%) |
| 25 to 29 Years | 40 (2.9%) | 36 (2.5%) |
| 30 to 34 Years | 29 (2.1%) | 75 (5.1%) |
| 35 to 39 Years | 110 (7.8%) | 65 (4.4%) |
| 40 to 44 Years | 62 (4.4%) | 42 (2.9%) |
| 45 to 49 Years | 23 (1.6%) | 144 (9.8%) |
| 50 to 54 Years | 185 (13.2%) | 182 (12.4%) |
| 55 to 59 Years | 167 (11.9%) | 114 (7.8%) |
| 60 to 64 Years | 156 (11.1%) | 115 (7.8%) |
| 65 to 69 Years | 117 (8.3%) | 163 (11.1%) |
| 70 to 74 Years | 94 (6.7%) | 74 (5.0%) |
| 75 to 79 Years | 22 (1.6%) | 21 (1.4%) |
| 80 to 84 Years | 0 (0.0%) | 28 (1.9%) |
| 85 Years and over | 20 (1.4%) | 4 (0.3%) |
| Total | 1,403 (100.0%) | 1,468 (100.0%) |
Families and Households in High Bridge
Median Family Size in High Bridge
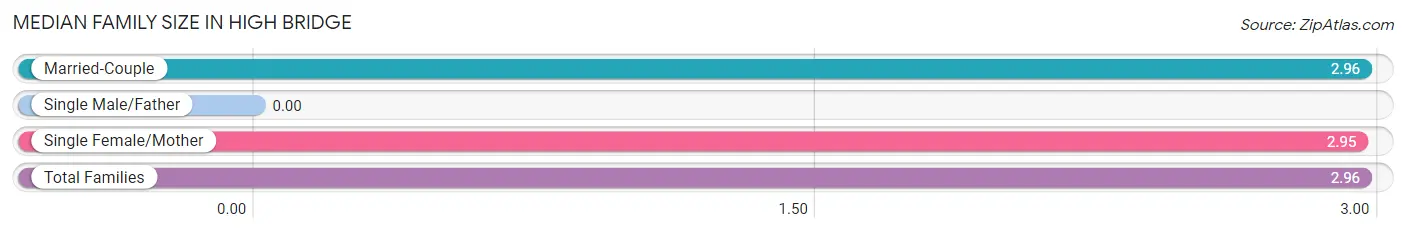
| Family Type | # Families | Family Size |
| Married-Couple | 817 (92.8%) | 2.96 |
| Single Male/Father | 0 (0.0%) | - |
| Single Female/Mother | 63 (7.2%) | 2.95 |
| Total Families | 880 (100.0%) | 2.96 |
Median Household Size in High Bridge
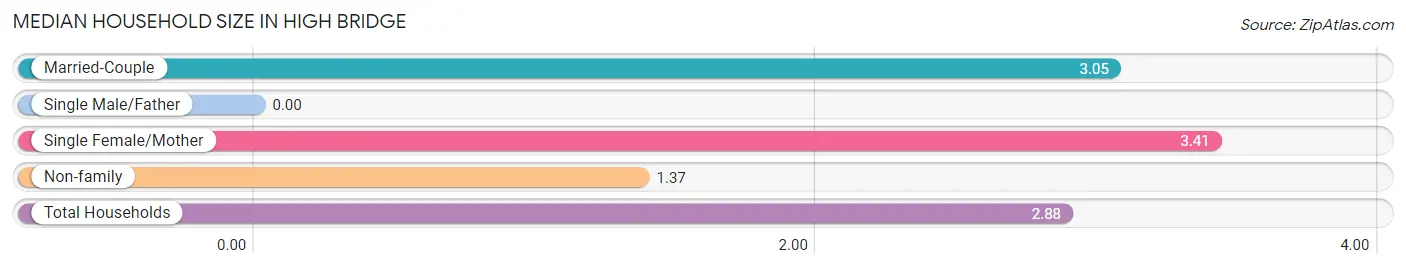
| Household Type | # Households | Household Size |
| Married-Couple | 817 (82.0%) | 3.05 |
| Single Male/Father | 0 (0.0%) | - |
| Single Female/Mother | 63 (6.3%) | 3.41 |
| Non-family | 117 (11.7%) | 1.37 |
| Total Households | 997 (100.0%) | 2.88 |
Household Size by Marriage Status in High Bridge
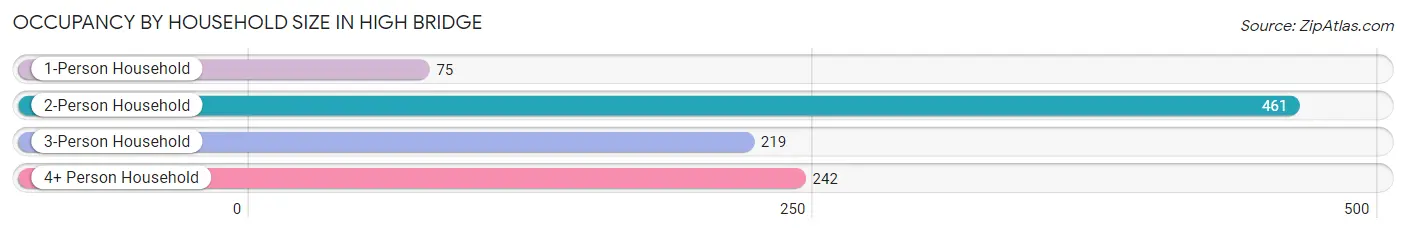
Out of a total of 997 households in High Bridge, 880 (88.3%) are family households, while 117 (11.7%) are nonfamily households. The most numerous type of family households are 2-person households, comprising 419, and the most common type of nonfamily households are 1-person households, comprising 75.
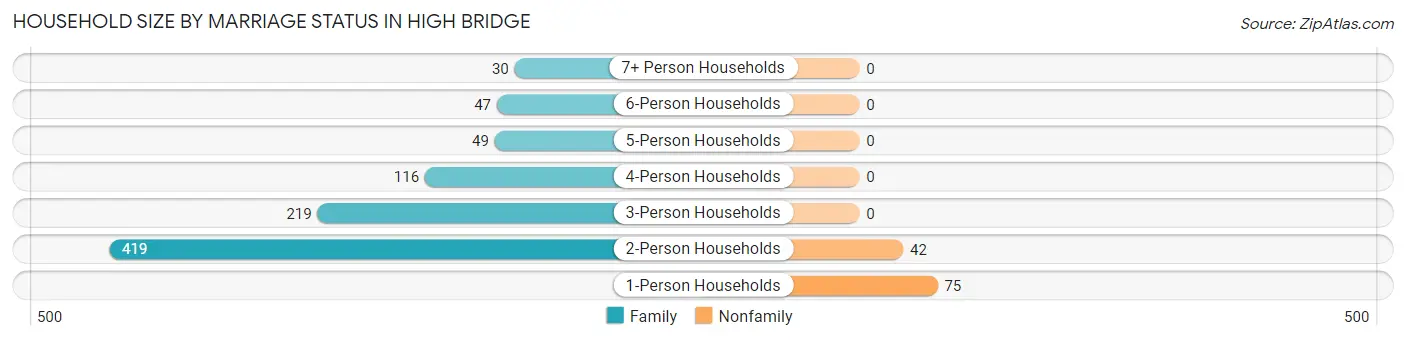
| Household Size | Family Households | Nonfamily Households |
| 1-Person Households | - | 75 (7.5%) |
| 2-Person Households | 419 (42.0%) | 42 (4.2%) |
| 3-Person Households | 219 (22.0%) | 0 (0.0%) |
| 4-Person Households | 116 (11.6%) | 0 (0.0%) |
| 5-Person Households | 49 (4.9%) | 0 (0.0%) |
| 6-Person Households | 47 (4.7%) | 0 (0.0%) |
| 7+ Person Households | 30 (3.0%) | 0 (0.0%) |
| Total | 880 (88.3%) | 117 (11.7%) |
Female Fertility in High Bridge
Fertility by Age in High Bridge
Average fertility rate in High Bridge is 73.0 births per 1,000 women. Women in the age bracket of 20 to 34 years have the highest fertility rate with 159.0 births per 1,000 women. Women in the age bracket of 20 to 34 years acount for 64.1% of all women with births.
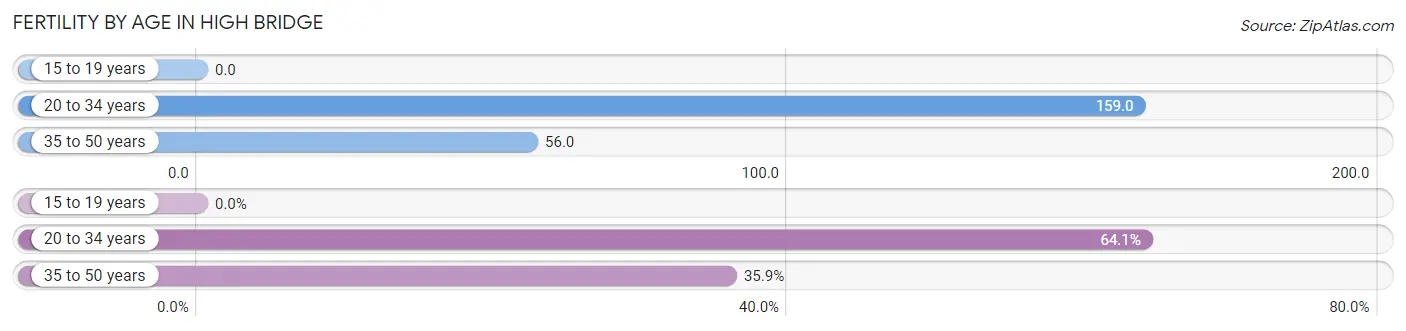
| Age Bracket | Women with Births | Births / 1,000 Women |
| 15 to 19 years | 0 (0.0%) | 0.0 |
| 20 to 34 years | 25 (64.1%) | 159.0 |
| 35 to 50 years | 14 (35.9%) | 56.0 |
| Total | 39 (100.0%) | 73.0 |
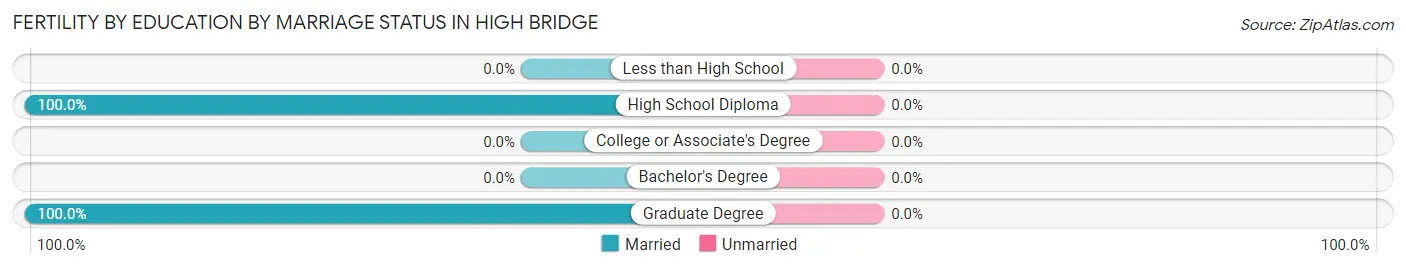
Fertility by Age by Marriage Status in High Bridge
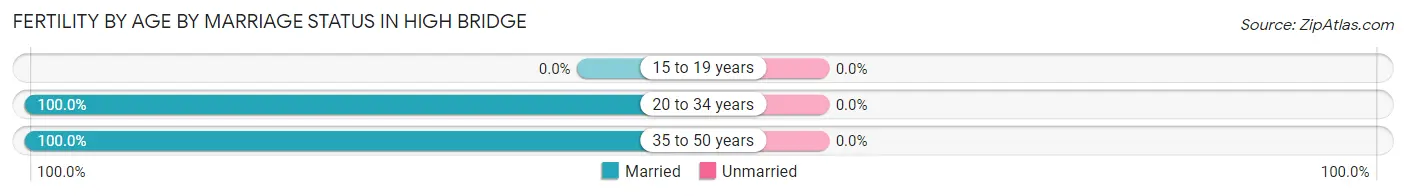
| Age Bracket | Married | Unmarried |
| 15 to 19 years | 0 (0.0%) | 0 (0.0%) |
| 20 to 34 years | 25 (100.0%) | 0 (0.0%) |
| 35 to 50 years | 14 (100.0%) | 0 (0.0%) |
| Total | 39 (100.0%) | 0 (0.0%) |
Fertility by Education in High Bridge
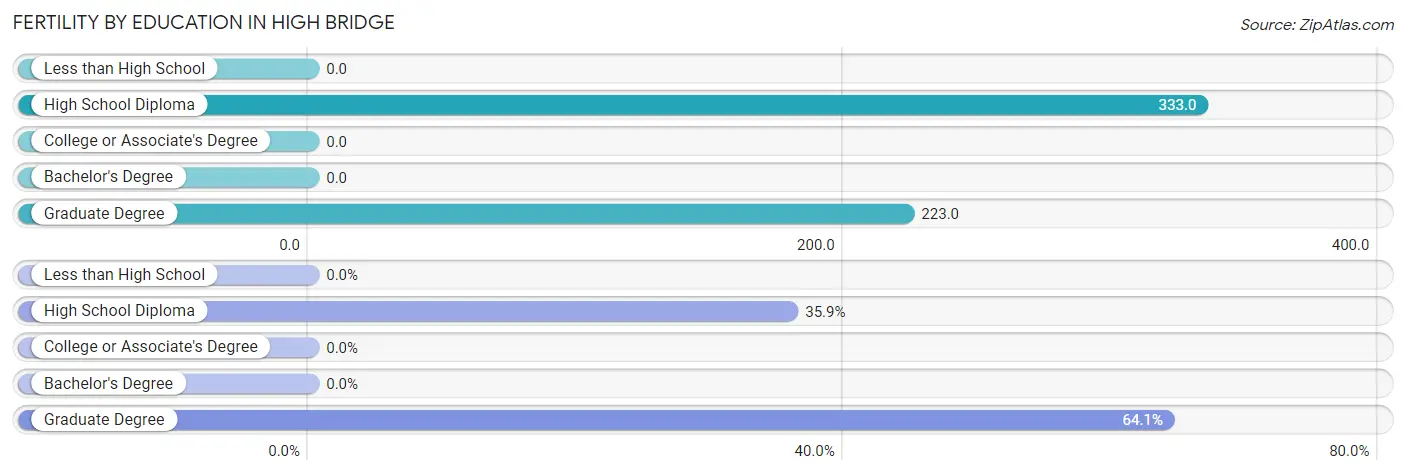
| Educational Attainment | Women with Births | Births / 1,000 Women |
| Less than High School | 0 (0.0%) | 0.0 |
| High School Diploma | 14 (35.9%) | 333.0 |
| College or Associate's Degree | 0 (0.0%) | 0.0 |
| Bachelor's Degree | 0 (0.0%) | 0.0 |
| Graduate Degree | 25 (64.1%) | 223.0 |
| Total | 39 (100.0%) | 73.0 |
Fertility by Education by Marriage Status in High Bridge
| Educational Attainment | Married | Unmarried |
| Less than High School | 0 (0.0%) | 0 (0.0%) |
| High School Diploma | 14 (100.0%) | 0 (0.0%) |
| College or Associate's Degree | 0 (0.0%) | 0 (0.0%) |
| Bachelor's Degree | 0 (0.0%) | 0 (0.0%) |
| Graduate Degree | 25 (100.0%) | 0 (0.0%) |
| Total | 39 (100.0%) | 0 (0.0%) |
Employment Characteristics in High Bridge
Employment by Class of Employer in High Bridge
Among the 1,414 employed individuals in High Bridge, private company employees (955 | 67.5%), local government employees (96 | 6.8%), and self-employed (not incorporated) (94 | 6.7%) make up the most common classes of employment.
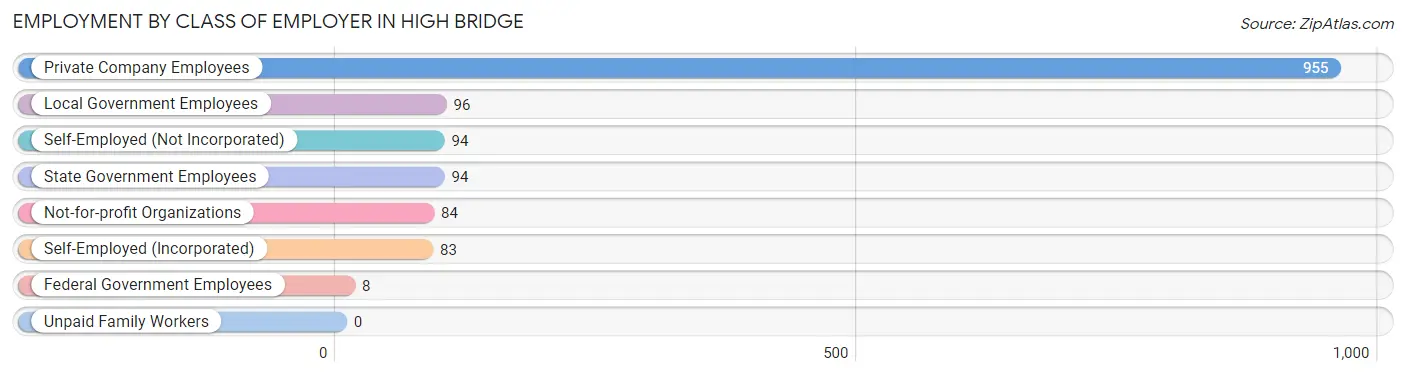
| Employer Class | # Employees | % Employees |
| Private Company Employees | 955 | 67.5% |
| Self-Employed (Incorporated) | 83 | 5.9% |
| Self-Employed (Not Incorporated) | 94 | 6.7% |
| Not-for-profit Organizations | 84 | 5.9% |
| Local Government Employees | 96 | 6.8% |
| State Government Employees | 94 | 6.7% |
| Federal Government Employees | 8 | 0.6% |
| Unpaid Family Workers | 0 | 0.0% |
| Total | 1,414 | 100.0% |
Employment Status by Age in High Bridge
According to the labor force statistics for High Bridge, out of the total population over 16 years of age (2,290), 65.6% or 1,502 individuals are in the labor force, with 3.3% or 50 of them unemployed. The age group with the highest labor force participation rate is 35 to 44 years, with 89.6% or 250 individuals in the labor force. Within the labor force, the 45 to 54 years age range has the highest percentage of unemployed individuals, with 8.1% or 35 of them being unemployed.
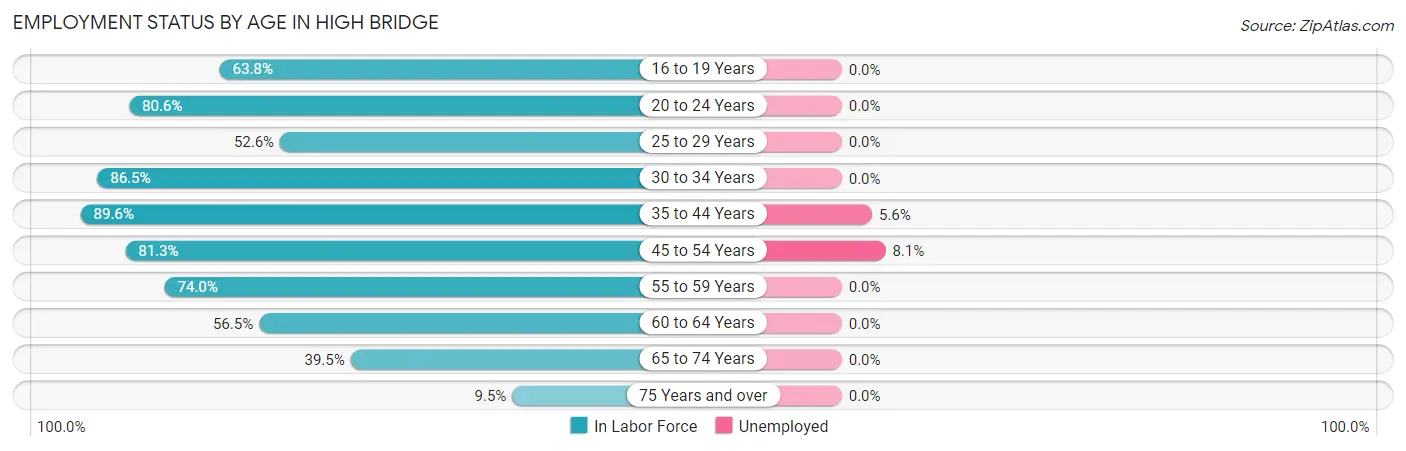
| Age Bracket | In Labor Force | Unemployed |
| 16 to 19 Years | 83 (63.8%) | 0 (0.0%) |
| 20 to 24 Years | 58 (80.6%) | 0 (0.0%) |
| 25 to 29 Years | 40 (52.6%) | 0 (0.0%) |
| 30 to 34 Years | 90 (86.5%) | 0 (0.0%) |
| 35 to 44 Years | 250 (89.6%) | 14 (5.6%) |
| 45 to 54 Years | 434 (81.3%) | 35 (8.1%) |
| 55 to 59 Years | 208 (74.0%) | 0 (0.0%) |
| 60 to 64 Years | 153 (56.5%) | 0 (0.0%) |
| 65 to 74 Years | 177 (39.5%) | 0 (0.0%) |
| 75 Years and over | 9 (9.5%) | 0 (0.0%) |
| Total | 1,502 (65.6%) | 50 (3.3%) |
Employment Status by Educational Attainment in High Bridge
According to labor force statistics for High Bridge, 76.1% of individuals (1,176) out of the total population between 25 and 64 years of age (1,545) are in the labor force, with 4.2% or 49 of them being unemployed. The group with the highest labor force participation rate are those with the educational attainment of college / associate degree, with 78.5% or 471 individuals in the labor force. Within the labor force, individuals with bachelor's degree or higher education have the highest percentage of unemployment, with 4.7% or 29 of them being unemployed.
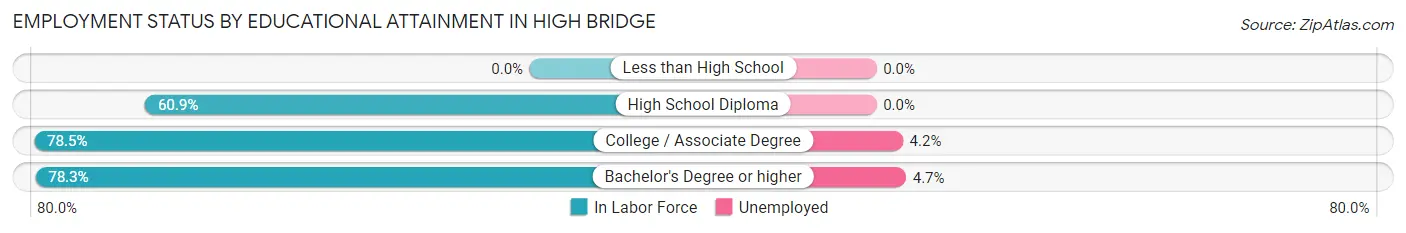
| Educational Attainment | In Labor Force | Unemployed |
| Less than High School | 0 (0.0%) | 0 (0.0%) |
| High School Diploma | 92 (60.9%) | 0 (0.0%) |
| College / Associate Degree | 471 (78.5%) | 25 (4.2%) |
| Bachelor's Degree or higher | 612 (78.3%) | 37 (4.7%) |
| Total | 1,176 (76.1%) | 65 (4.2%) |
Employment Occupations by Sex in High Bridge
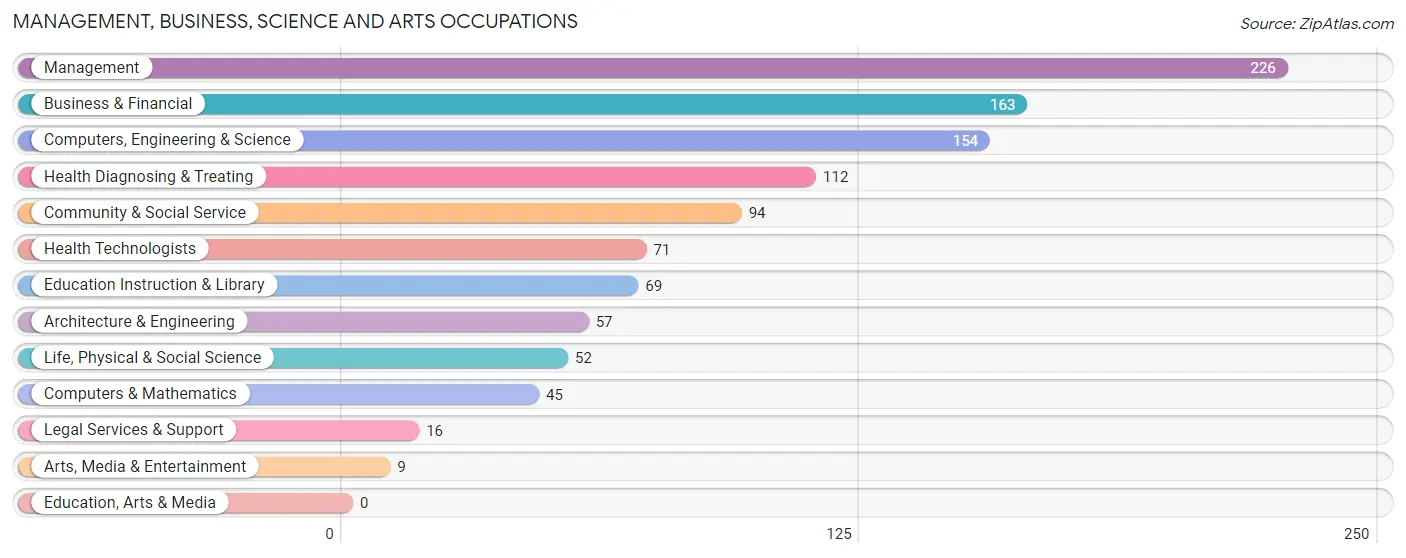
Management, Business, Science and Arts Occupations
The most common Management, Business, Science and Arts occupations in High Bridge are Management (226 | 15.5%), Business & Financial (163 | 11.2%), Computers, Engineering & Science (154 | 10.6%), Health Diagnosing & Treating (112 | 7.7%), and Community & Social Service (94 | 6.5%).
Management, Business, Science and Arts Occupations by Sex
Within the Management, Business, Science and Arts occupations in High Bridge, the most male-oriented occupations are Life, Physical & Social Science (75.0%), Business & Financial (72.4%), and Computers & Mathematics (68.9%), while the most female-oriented occupations are Community & Social Service (100.0%), Legal Services & Support (100.0%), and Education Instruction & Library (100.0%).
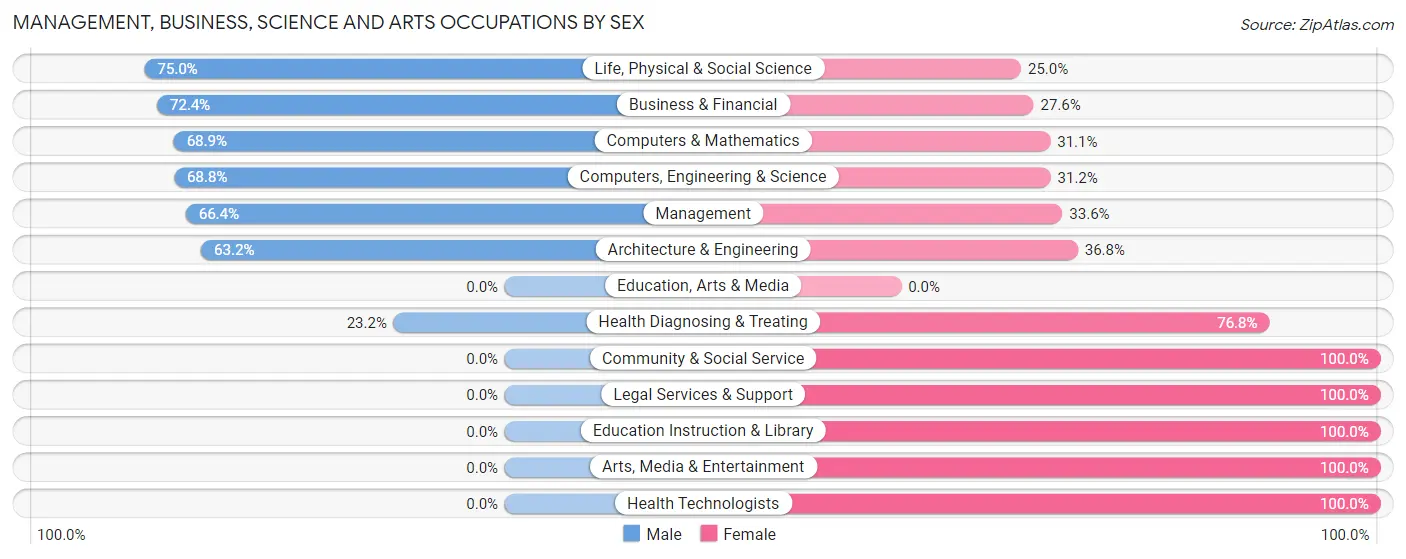
| Occupation | Male | Female |
| Management | 150 (66.4%) | 76 (33.6%) |
| Business & Financial | 118 (72.4%) | 45 (27.6%) |
| Computers, Engineering & Science | 106 (68.8%) | 48 (31.2%) |
| Computers & Mathematics | 31 (68.9%) | 14 (31.1%) |
| Architecture & Engineering | 36 (63.2%) | 21 (36.8%) |
| Life, Physical & Social Science | 39 (75.0%) | 13 (25.0%) |
| Community & Social Service | 0 (0.0%) | 94 (100.0%) |
| Education, Arts & Media | 0 (0.0%) | 0 (0.0%) |
| Legal Services & Support | 0 (0.0%) | 16 (100.0%) |
| Education Instruction & Library | 0 (0.0%) | 69 (100.0%) |
| Arts, Media & Entertainment | 0 (0.0%) | 9 (100.0%) |
| Health Diagnosing & Treating | 26 (23.2%) | 86 (76.8%) |
| Health Technologists | 0 (0.0%) | 71 (100.0%) |
| Total (Category) | 400 (53.4%) | 349 (46.6%) |
| Total (Overall) | 764 (52.6%) | 689 (47.4%) |
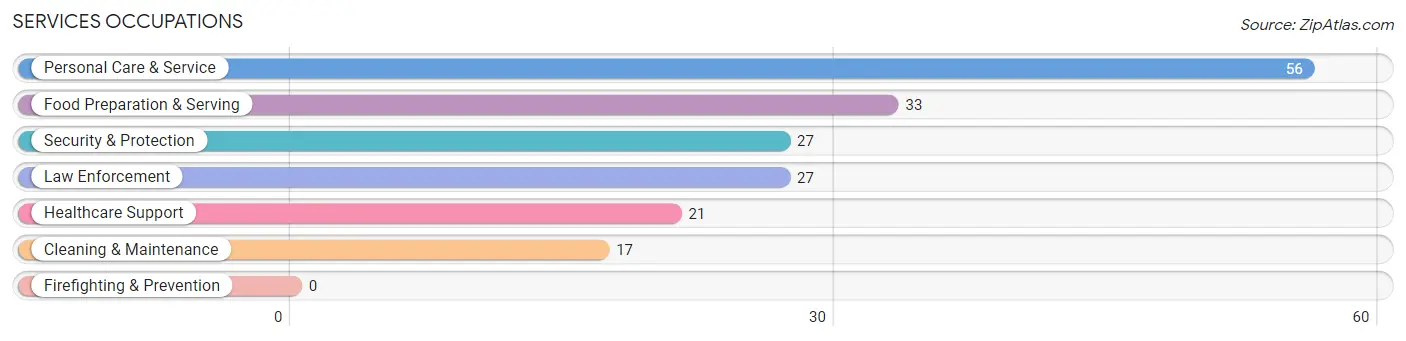
Services Occupations
The most common Services occupations in High Bridge are Personal Care & Service (56 | 3.8%), Food Preparation & Serving (33 | 2.3%), Security & Protection (27 | 1.9%), Law Enforcement (27 | 1.9%), and Healthcare Support (21 | 1.5%).
Services Occupations by Sex
Within the Services occupations in High Bridge, the most male-oriented occupations are Security & Protection (100.0%), Law Enforcement (100.0%), and Cleaning & Maintenance (100.0%), while the most female-oriented occupations are Food Preparation & Serving (100.0%), Personal Care & Service (100.0%), and Healthcare Support (52.4%).
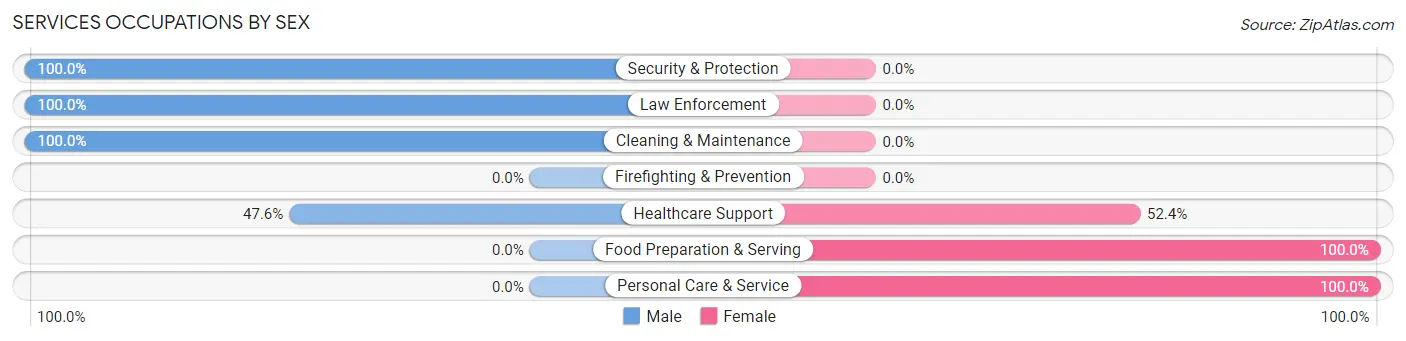
| Occupation | Male | Female |
| Healthcare Support | 10 (47.6%) | 11 (52.4%) |
| Security & Protection | 27 (100.0%) | 0 (0.0%) |
| Firefighting & Prevention | 0 (0.0%) | 0 (0.0%) |
| Law Enforcement | 27 (100.0%) | 0 (0.0%) |
| Food Preparation & Serving | 0 (0.0%) | 33 (100.0%) |
| Cleaning & Maintenance | 17 (100.0%) | 0 (0.0%) |
| Personal Care & Service | 0 (0.0%) | 56 (100.0%) |
| Total (Category) | 54 (35.1%) | 100 (64.9%) |
| Total (Overall) | 764 (52.6%) | 689 (47.4%) |
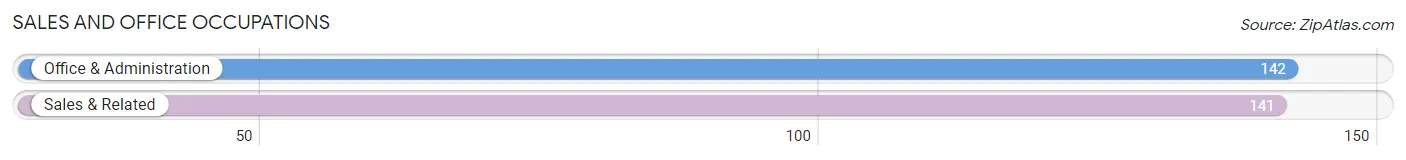
Sales and Office Occupations
The most common Sales and Office occupations in High Bridge are Office & Administration (142 | 9.8%), and Sales & Related (141 | 9.7%).
Sales and Office Occupations by Sex
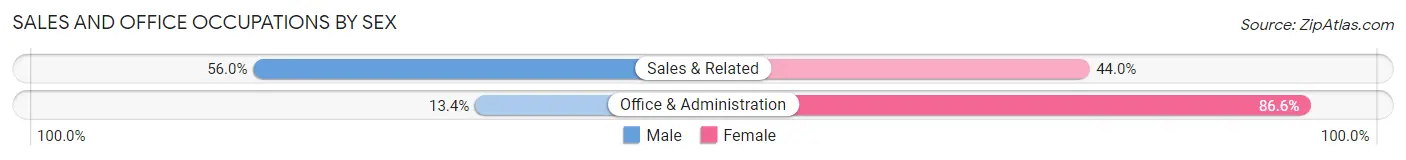
| Occupation | Male | Female |
| Sales & Related | 79 (56.0%) | 62 (44.0%) |
| Office & Administration | 19 (13.4%) | 123 (86.6%) |
| Total (Category) | 98 (34.6%) | 185 (65.4%) |
| Total (Overall) | 764 (52.6%) | 689 (47.4%) |
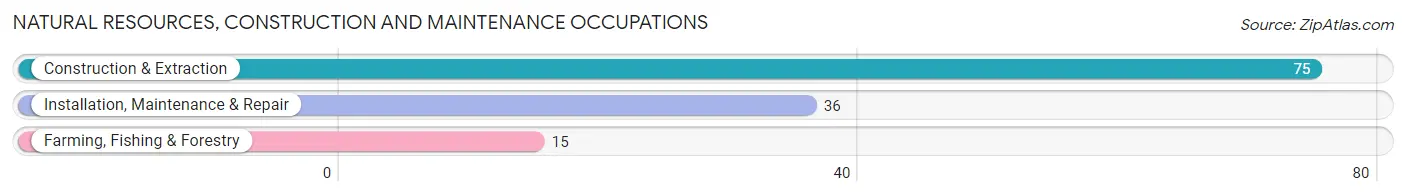
Natural Resources, Construction and Maintenance Occupations
The most common Natural Resources, Construction and Maintenance occupations in High Bridge are Construction & Extraction (75 | 5.2%), Installation, Maintenance & Repair (36 | 2.5%), and Farming, Fishing & Forestry (15 | 1.0%).
Natural Resources, Construction and Maintenance Occupations by Sex
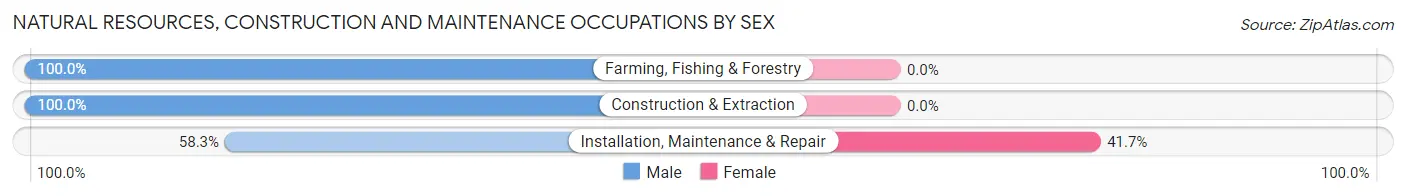
| Occupation | Male | Female |
| Farming, Fishing & Forestry | 15 (100.0%) | 0 (0.0%) |
| Construction & Extraction | 75 (100.0%) | 0 (0.0%) |
| Installation, Maintenance & Repair | 21 (58.3%) | 15 (41.7%) |
| Total (Category) | 111 (88.1%) | 15 (11.9%) |
| Total (Overall) | 764 (52.6%) | 689 (47.4%) |
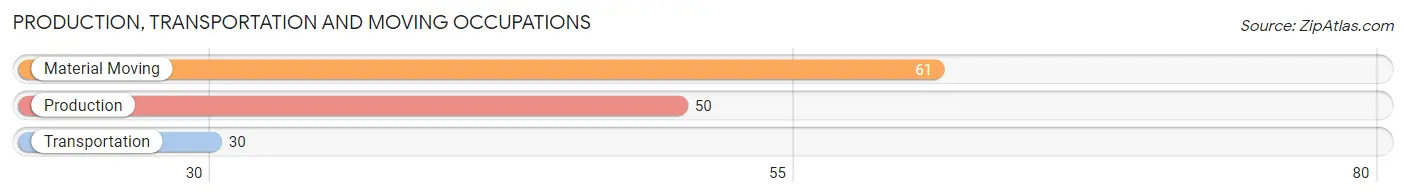
Production, Transportation and Moving Occupations
The most common Production, Transportation and Moving occupations in High Bridge are Material Moving (61 | 4.2%), Production (50 | 3.4%), and Transportation (30 | 2.1%).
Production, Transportation and Moving Occupations by Sex
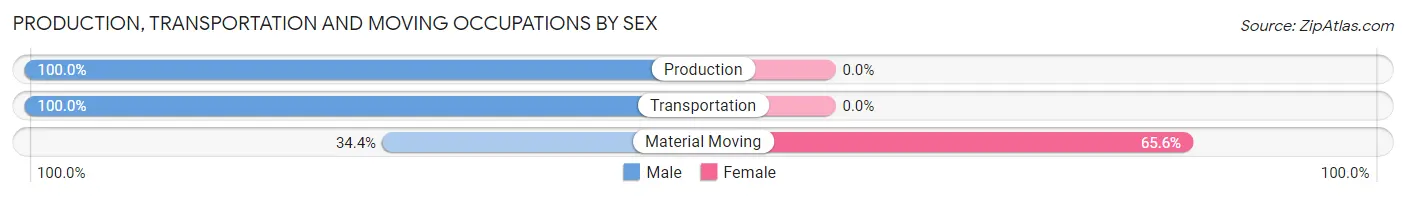
| Occupation | Male | Female |
| Production | 50 (100.0%) | 0 (0.0%) |
| Transportation | 30 (100.0%) | 0 (0.0%) |
| Material Moving | 21 (34.4%) | 40 (65.6%) |
| Total (Category) | 101 (71.6%) | 40 (28.4%) |
| Total (Overall) | 764 (52.6%) | 689 (47.4%) |
Employment Industries by Sex in High Bridge
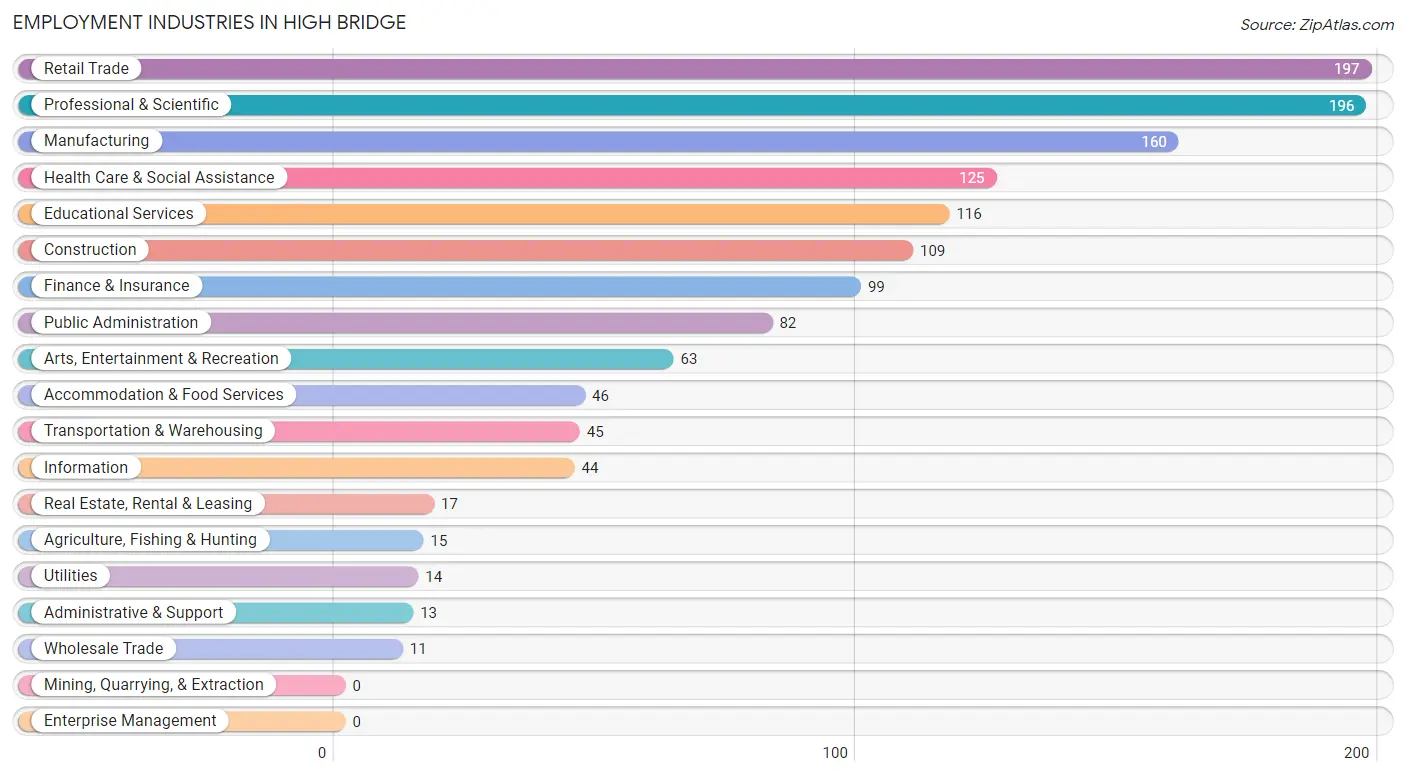
Employment Industries in High Bridge
The major employment industries in High Bridge include Retail Trade (197 | 13.6%), Professional & Scientific (196 | 13.5%), Manufacturing (160 | 11.0%), Health Care & Social Assistance (125 | 8.6%), and Educational Services (116 | 8.0%).
Employment Industries by Sex in High Bridge
The High Bridge industries that see more men than women are Agriculture, Fishing & Hunting (100.0%), Wholesale Trade (100.0%), and Utilities (100.0%), whereas the industries that tend to have a higher number of women are Real Estate, Rental & Leasing (100.0%), Administrative & Support (100.0%), and Arts, Entertainment & Recreation (100.0%).
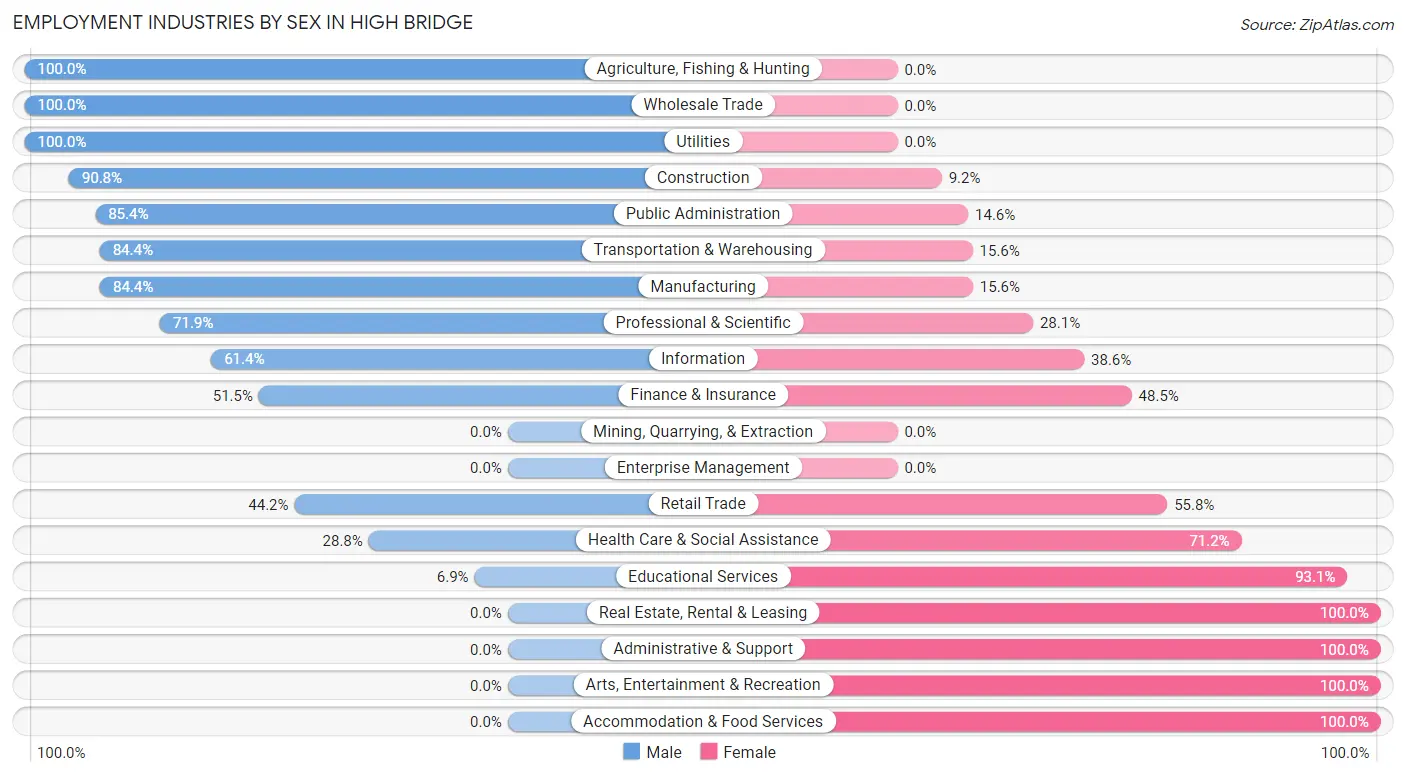
| Industry | Male | Female |
| Agriculture, Fishing & Hunting | 15 (100.0%) | 0 (0.0%) |
| Mining, Quarrying, & Extraction | 0 (0.0%) | 0 (0.0%) |
| Construction | 99 (90.8%) | 10 (9.2%) |
| Manufacturing | 135 (84.4%) | 25 (15.6%) |
| Wholesale Trade | 11 (100.0%) | 0 (0.0%) |
| Retail Trade | 87 (44.2%) | 110 (55.8%) |
| Transportation & Warehousing | 38 (84.4%) | 7 (15.6%) |
| Utilities | 14 (100.0%) | 0 (0.0%) |
| Information | 27 (61.4%) | 17 (38.6%) |
| Finance & Insurance | 51 (51.5%) | 48 (48.5%) |
| Real Estate, Rental & Leasing | 0 (0.0%) | 17 (100.0%) |
| Professional & Scientific | 141 (71.9%) | 55 (28.1%) |
| Enterprise Management | 0 (0.0%) | 0 (0.0%) |
| Administrative & Support | 0 (0.0%) | 13 (100.0%) |
| Educational Services | 8 (6.9%) | 108 (93.1%) |
| Health Care & Social Assistance | 36 (28.8%) | 89 (71.2%) |
| Arts, Entertainment & Recreation | 0 (0.0%) | 63 (100.0%) |
| Accommodation & Food Services | 0 (0.0%) | 46 (100.0%) |
| Public Administration | 70 (85.4%) | 12 (14.6%) |
| Total | 764 (52.6%) | 689 (47.4%) |
Education in High Bridge
School Enrollment in High Bridge
The most common levels of schooling among the 613 students in High Bridge are high school (214 | 34.9%), elementary school (157 | 25.6%), and middle school (137 | 22.4%).
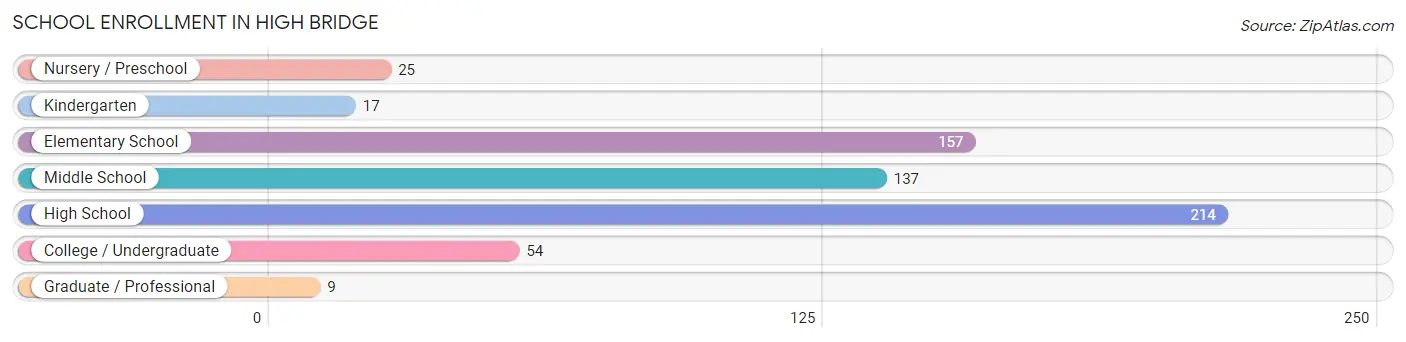
| School Level | # Students | % Students |
| Nursery / Preschool | 25 | 4.1% |
| Kindergarten | 17 | 2.8% |
| Elementary School | 157 | 25.6% |
| Middle School | 137 | 22.4% |
| High School | 214 | 34.9% |
| College / Undergraduate | 54 | 8.8% |
| Graduate / Professional | 9 | 1.5% |
| Total | 613 | 100.0% |
School Enrollment by Age by Funding Source in High Bridge
Out of a total of 613 students who are enrolled in schools in High Bridge, 132 (21.5%) attend a private institution, while the remaining 481 (78.5%) are enrolled in public schools. The age group of 3 to 4 year olds has the highest likelihood of being enrolled in private schools, with 25 (100.0% in the age bracket) enrolled. Conversely, the age group of 18 to 19 year olds has the lowest likelihood of being enrolled in a private school, with 49 (100.0% in the age bracket) attending a public institution.
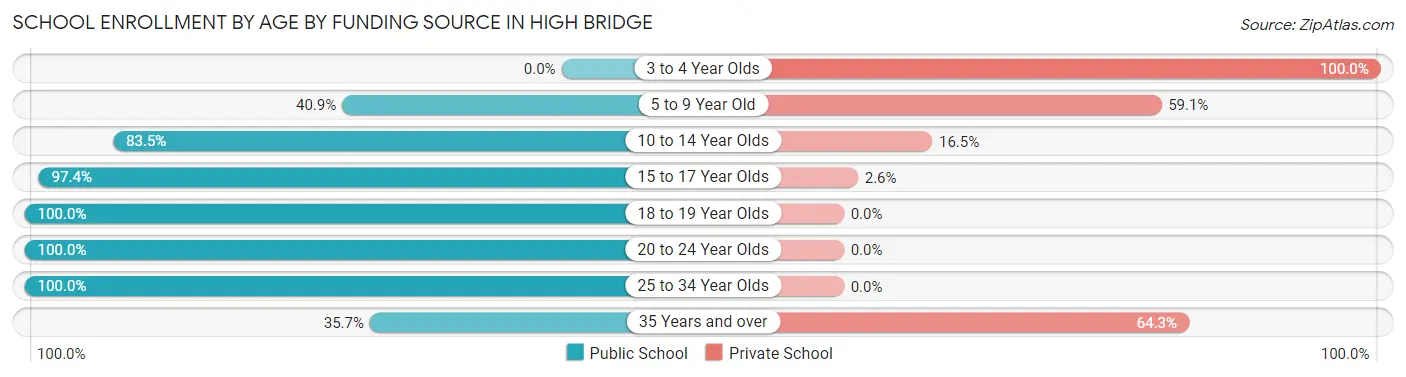
| Age Bracket | Public School | Private School |
| 3 to 4 Year Olds | 0 (0.0%) | 25 (100.0%) |
| 5 to 9 Year Old | 38 (40.9%) | 55 (59.1%) |
| 10 to 14 Year Olds | 198 (83.5%) | 39 (16.5%) |
| 15 to 17 Year Olds | 148 (97.4%) | 4 (2.6%) |
| 18 to 19 Year Olds | 49 (100.0%) | 0 (0.0%) |
| 20 to 24 Year Olds | 26 (100.0%) | 0 (0.0%) |
| 25 to 34 Year Olds | 17 (100.0%) | 0 (0.0%) |
| 35 Years and over | 5 (35.7%) | 9 (64.3%) |
| Total | 481 (78.5%) | 132 (21.5%) |
Educational Attainment by Field of Study in High Bridge
Business (200 | 17.8%), engineering (115 | 10.2%), bio, nature & agricultural (113 | 10.1%), science & technology (96 | 8.6%), and education (92 | 8.2%) are the most common fields of study among 1,123 individuals in High Bridge who have obtained a bachelor's degree or higher.
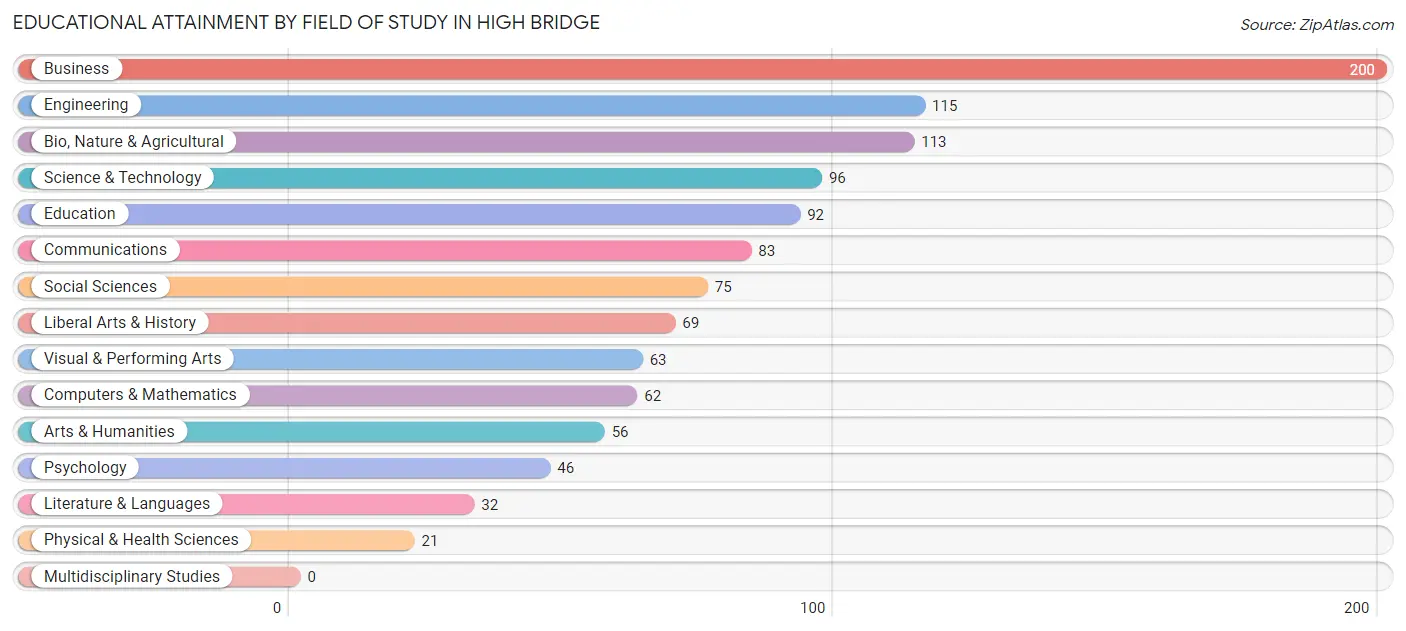
| Field of Study | # Graduates | % Graduates |
| Computers & Mathematics | 62 | 5.5% |
| Bio, Nature & Agricultural | 113 | 10.1% |
| Physical & Health Sciences | 21 | 1.9% |
| Psychology | 46 | 4.1% |
| Social Sciences | 75 | 6.7% |
| Engineering | 115 | 10.2% |
| Multidisciplinary Studies | 0 | 0.0% |
| Science & Technology | 96 | 8.6% |
| Business | 200 | 17.8% |
| Education | 92 | 8.2% |
| Literature & Languages | 32 | 2.9% |
| Liberal Arts & History | 69 | 6.1% |
| Visual & Performing Arts | 63 | 5.6% |
| Communications | 83 | 7.4% |
| Arts & Humanities | 56 | 5.0% |
| Total | 1,123 | 100.0% |
Transportation & Commute in High Bridge
Vehicle Availability by Sex in High Bridge
The most prevalent vehicle ownership categories in High Bridge are males with 3 vehicles (298, accounting for 41.0%) and females with 3 vehicles (297, making up 43.4%).
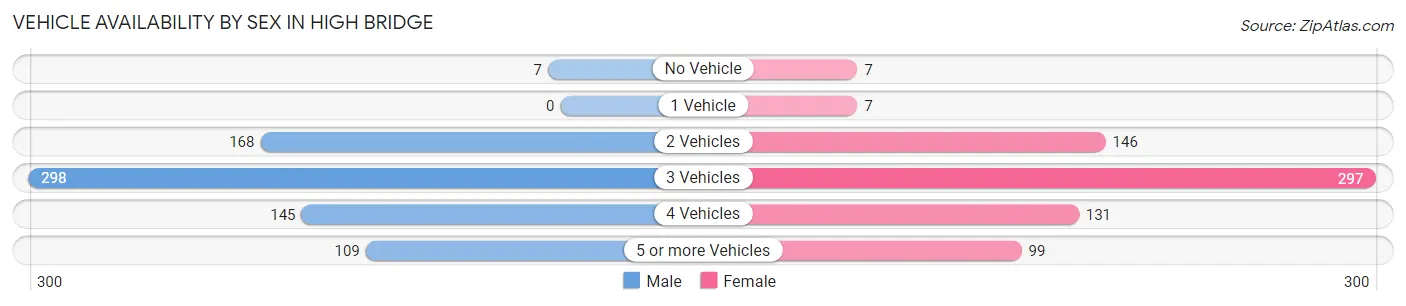
| Vehicles Available | Male | Female |
| No Vehicle | 7 (1.0%) | 7 (1.0%) |
| 1 Vehicle | 0 (0.0%) | 7 (1.0%) |
| 2 Vehicles | 168 (23.1%) | 146 (21.2%) |
| 3 Vehicles | 298 (41.0%) | 297 (43.2%) |
| 4 Vehicles | 145 (19.9%) | 131 (19.1%) |
| 5 or more Vehicles | 109 (15.0%) | 99 (14.4%) |
| Total | 727 (100.0%) | 687 (100.0%) |
Commute Time in High Bridge
The most frequently occuring commute durations in High Bridge are 40 to 44 minutes (198 commuters, 16.8%), 35 to 39 minutes (161 commuters, 13.6%), and 20 to 24 minutes (154 commuters, 13.1%).
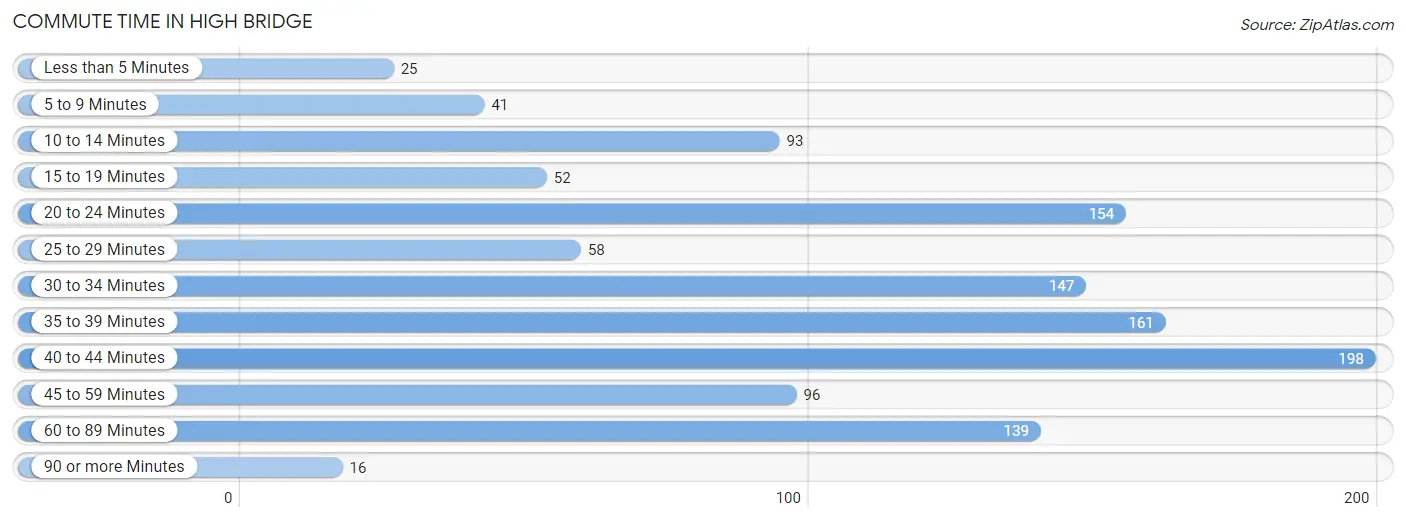
| Commute Time | # Commuters | % Commuters |
| Less than 5 Minutes | 25 | 2.1% |
| 5 to 9 Minutes | 41 | 3.5% |
| 10 to 14 Minutes | 93 | 7.9% |
| 15 to 19 Minutes | 52 | 4.4% |
| 20 to 24 Minutes | 154 | 13.1% |
| 25 to 29 Minutes | 58 | 4.9% |
| 30 to 34 Minutes | 147 | 12.5% |
| 35 to 39 Minutes | 161 | 13.6% |
| 40 to 44 Minutes | 198 | 16.8% |
| 45 to 59 Minutes | 96 | 8.1% |
| 60 to 89 Minutes | 139 | 11.8% |
| 90 or more Minutes | 16 | 1.4% |
Commute Time by Sex in High Bridge
The most common commute times in High Bridge are 60 to 89 minutes (111 commuters, 18.5%) for males and 20 to 24 minutes (119 commuters, 20.5%) for females.
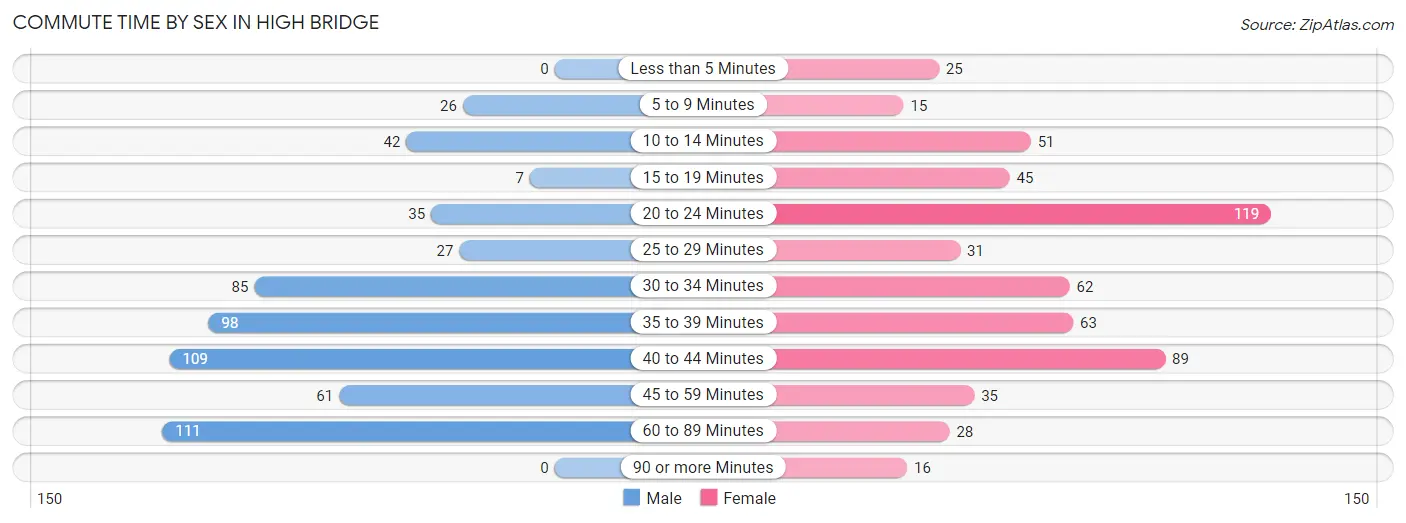
| Commute Time | Male | Female |
| Less than 5 Minutes | 0 (0.0%) | 25 (4.3%) |
| 5 to 9 Minutes | 26 (4.3%) | 15 (2.6%) |
| 10 to 14 Minutes | 42 (7.0%) | 51 (8.8%) |
| 15 to 19 Minutes | 7 (1.2%) | 45 (7.8%) |
| 20 to 24 Minutes | 35 (5.8%) | 119 (20.5%) |
| 25 to 29 Minutes | 27 (4.5%) | 31 (5.3%) |
| 30 to 34 Minutes | 85 (14.1%) | 62 (10.7%) |
| 35 to 39 Minutes | 98 (16.3%) | 63 (10.9%) |
| 40 to 44 Minutes | 109 (18.1%) | 89 (15.4%) |
| 45 to 59 Minutes | 61 (10.2%) | 35 (6.0%) |
| 60 to 89 Minutes | 111 (18.5%) | 28 (4.8%) |
| 90 or more Minutes | 0 (0.0%) | 16 (2.8%) |
Time of Departure to Work by Sex in High Bridge
The most frequent times of departure to work in High Bridge are 7:00 AM to 7:29 AM (110, 18.3%) for males and 7:30 AM to 7:59 AM (124, 21.4%) for females.
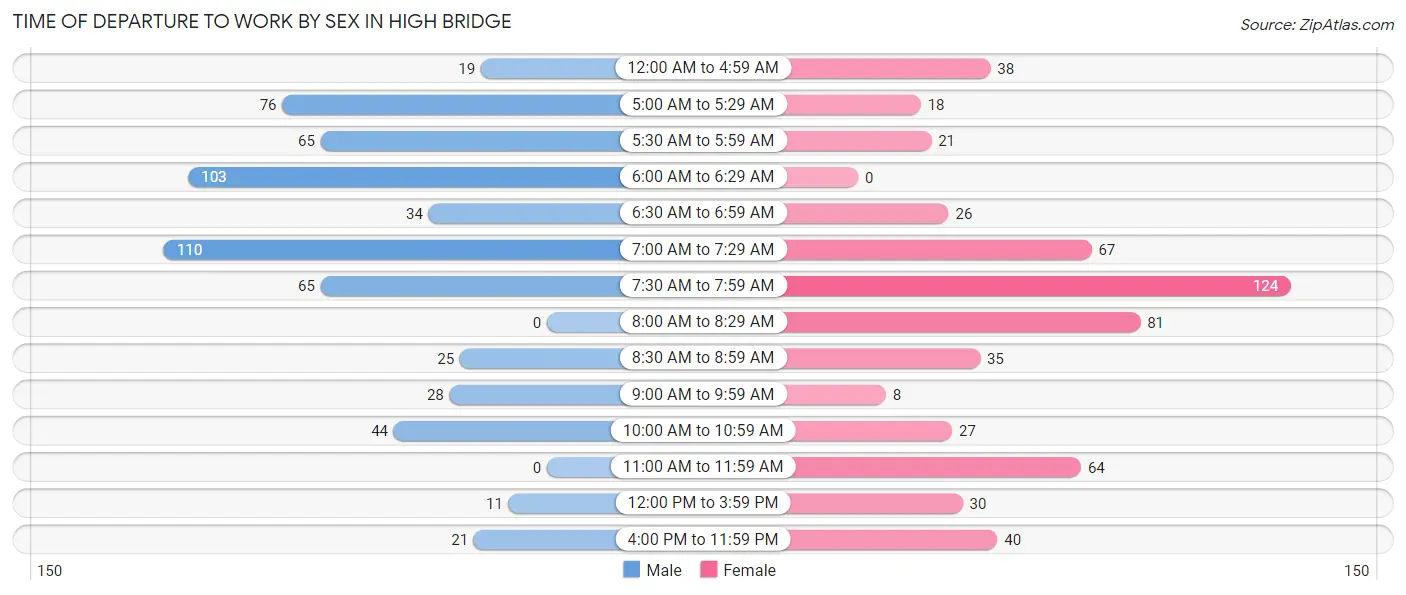
| Time of Departure | Male | Female |
| 12:00 AM to 4:59 AM | 19 (3.2%) | 38 (6.6%) |
| 5:00 AM to 5:29 AM | 76 (12.7%) | 18 (3.1%) |
| 5:30 AM to 5:59 AM | 65 (10.8%) | 21 (3.6%) |
| 6:00 AM to 6:29 AM | 103 (17.1%) | 0 (0.0%) |
| 6:30 AM to 6:59 AM | 34 (5.7%) | 26 (4.5%) |
| 7:00 AM to 7:29 AM | 110 (18.3%) | 67 (11.6%) |
| 7:30 AM to 7:59 AM | 65 (10.8%) | 124 (21.4%) |
| 8:00 AM to 8:29 AM | 0 (0.0%) | 81 (14.0%) |
| 8:30 AM to 8:59 AM | 25 (4.2%) | 35 (6.0%) |
| 9:00 AM to 9:59 AM | 28 (4.7%) | 8 (1.4%) |
| 10:00 AM to 10:59 AM | 44 (7.3%) | 27 (4.7%) |
| 11:00 AM to 11:59 AM | 0 (0.0%) | 64 (11.1%) |
| 12:00 PM to 3:59 PM | 11 (1.8%) | 30 (5.2%) |
| 4:00 PM to 11:59 PM | 21 (3.5%) | 40 (6.9%) |
| Total | 601 (100.0%) | 579 (100.0%) |
Housing Occupancy in High Bridge
Occupancy by Ownership in High Bridge
Of the total 997 dwellings in High Bridge, owner-occupied units account for 959 (96.2%), while renter-occupied units make up 38 (3.8%).
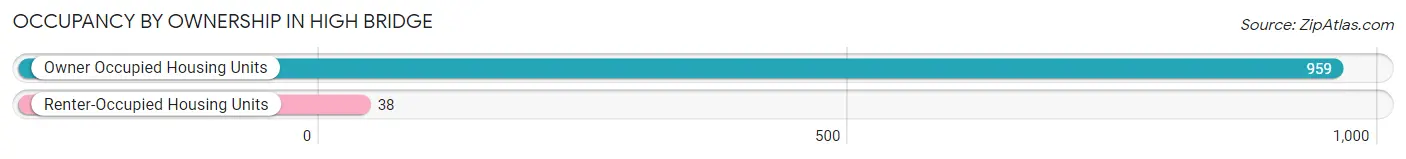
| Occupancy | # Housing Units | % Housing Units |
| Owner Occupied Housing Units | 959 | 96.2% |
| Renter-Occupied Housing Units | 38 | 3.8% |
| Total Occupied Housing Units | 997 | 100.0% |
Occupancy by Household Size in High Bridge
| Household Size | # Housing Units | % Housing Units |
| 1-Person Household | 75 | 7.5% |
| 2-Person Household | 461 | 46.2% |
| 3-Person Household | 219 | 22.0% |
| 4+ Person Household | 242 | 24.3% |
| Total Housing Units | 997 | 100.0% |
Occupancy by Ownership by Household Size in High Bridge
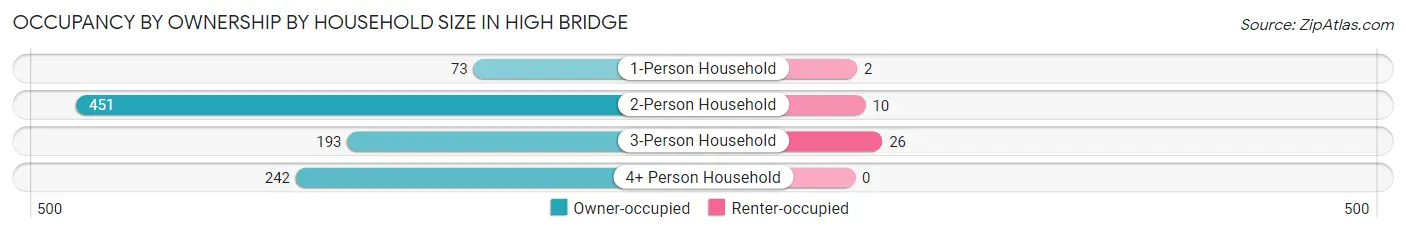
| Household Size | Owner-occupied | Renter-occupied |
| 1-Person Household | 73 (97.3%) | 2 (2.7%) |
| 2-Person Household | 451 (97.8%) | 10 (2.2%) |
| 3-Person Household | 193 (88.1%) | 26 (11.9%) |
| 4+ Person Household | 242 (100.0%) | 0 (0.0%) |
| Total Housing Units | 959 (96.2%) | 38 (3.8%) |
Occupancy by Educational Attainment in High Bridge
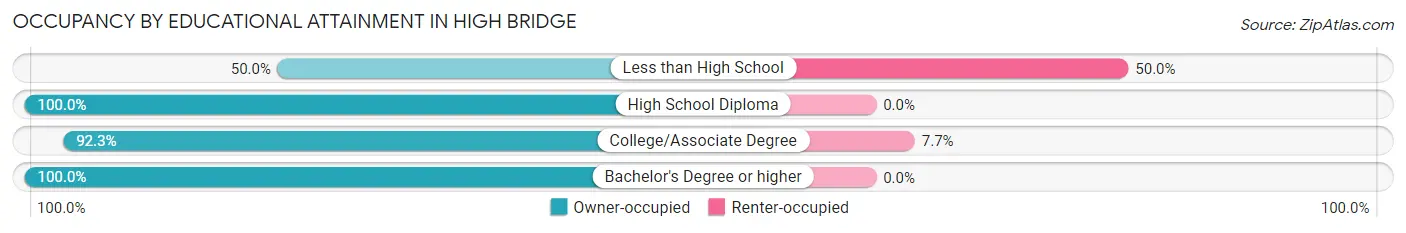
| Household Size | Owner-occupied | Renter-occupied |
| Less than High School | 10 (50.0%) | 10 (50.0%) |
| High School Diploma | 77 (100.0%) | 0 (0.0%) |
| College/Associate Degree | 337 (92.3%) | 28 (7.7%) |
| Bachelor's Degree or higher | 535 (100.0%) | 0 (0.0%) |
Occupancy by Age of Householder in High Bridge
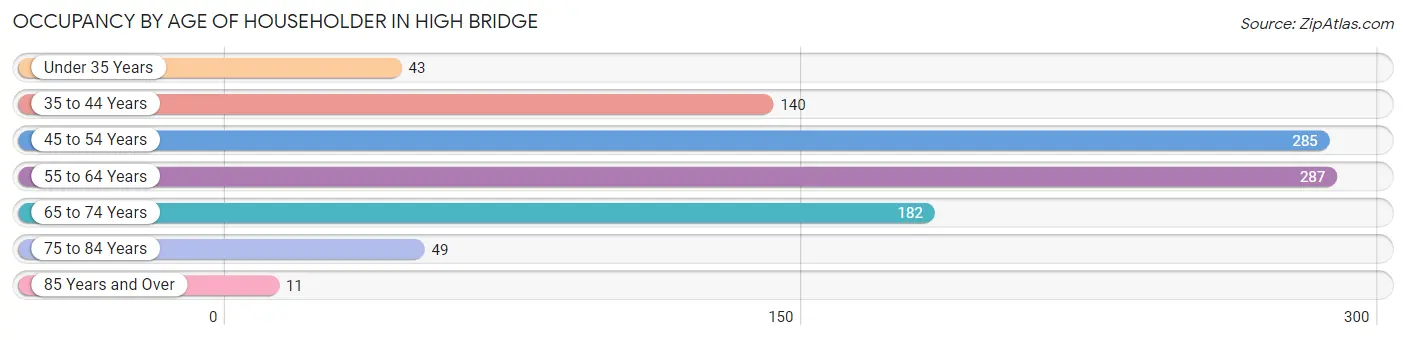
| Age Bracket | # Households | % Households |
| Under 35 Years | 43 | 4.3% |
| 35 to 44 Years | 140 | 14.0% |
| 45 to 54 Years | 285 | 28.6% |
| 55 to 64 Years | 287 | 28.8% |
| 65 to 74 Years | 182 | 18.2% |
| 75 to 84 Years | 49 | 4.9% |
| 85 Years and Over | 11 | 1.1% |
| Total | 997 | 100.0% |
Housing Finances in High Bridge
Median Income by Occupancy in High Bridge
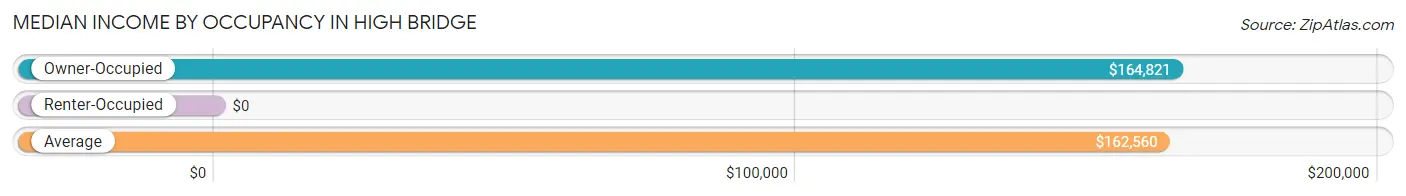
| Occupancy Type | # Households | Median Income |
| Owner-Occupied | 959 (96.2%) | $164,821 |
| Renter-Occupied | 38 (3.8%) | $0 |
| Average | 997 (100.0%) | $162,560 |
Occupancy by Householder Income Bracket in High Bridge
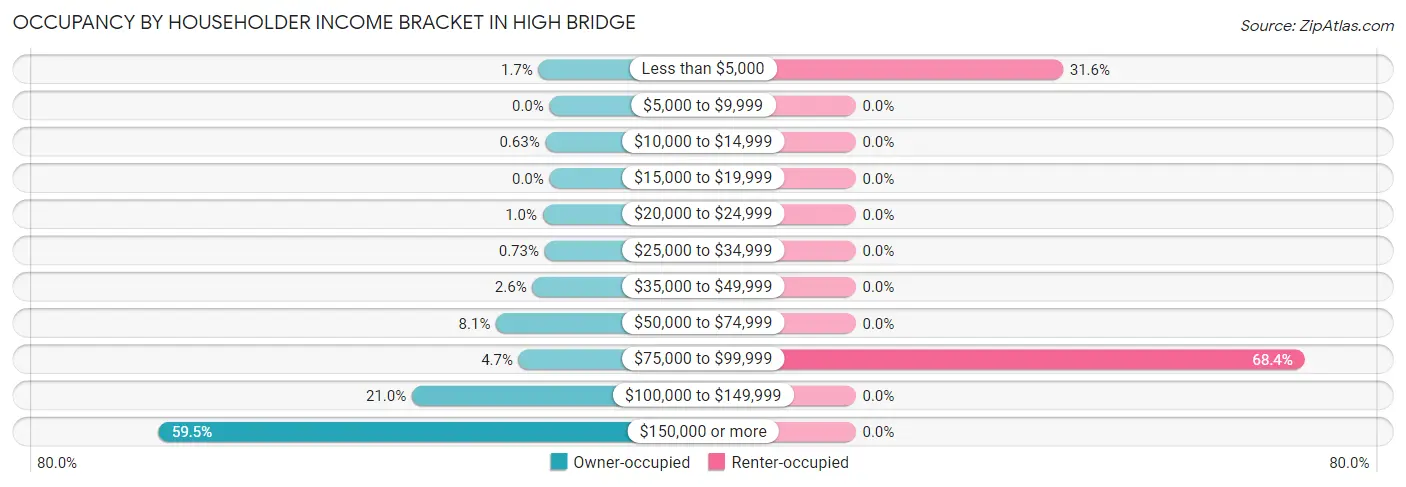
| Income Bracket | Owner-occupied | Renter-occupied |
| Less than $5,000 | 16 (1.7%) | 12 (31.6%) |
| $5,000 to $9,999 | 0 (0.0%) | 0 (0.0%) |
| $10,000 to $14,999 | 6 (0.6%) | 0 (0.0%) |
| $15,000 to $19,999 | 0 (0.0%) | 0 (0.0%) |
| $20,000 to $24,999 | 10 (1.0%) | 0 (0.0%) |
| $25,000 to $34,999 | 7 (0.7%) | 0 (0.0%) |
| $35,000 to $49,999 | 25 (2.6%) | 0 (0.0%) |
| $50,000 to $74,999 | 78 (8.1%) | 0 (0.0%) |
| $75,000 to $99,999 | 45 (4.7%) | 26 (68.4%) |
| $100,000 to $149,999 | 201 (21.0%) | 0 (0.0%) |
| $150,000 or more | 571 (59.5%) | 0 (0.0%) |
| Total | 959 (100.0%) | 38 (100.0%) |
Monthly Housing Cost Tiers in High Bridge
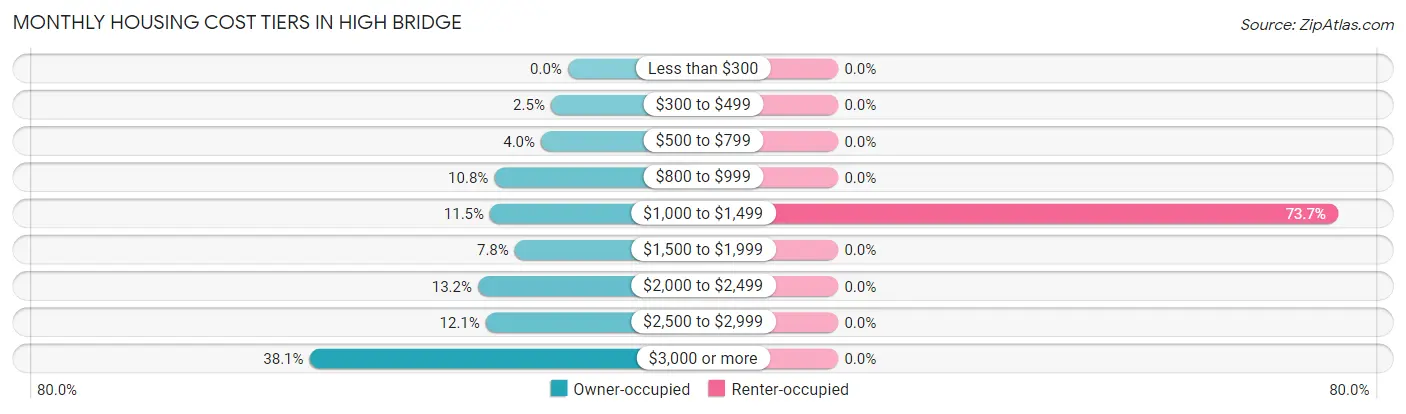
| Monthly Cost | Owner-occupied | Renter-occupied |
| Less than $300 | 0 (0.0%) | 0 (0.0%) |
| $300 to $499 | 24 (2.5%) | 0 (0.0%) |
| $500 to $799 | 38 (4.0%) | 0 (0.0%) |
| $800 to $999 | 104 (10.8%) | 0 (0.0%) |
| $1,000 to $1,499 | 110 (11.5%) | 28 (73.7%) |
| $1,500 to $1,999 | 75 (7.8%) | 0 (0.0%) |
| $2,000 to $2,499 | 127 (13.2%) | 0 (0.0%) |
| $2,500 to $2,999 | 116 (12.1%) | 0 (0.0%) |
| $3,000 or more | 365 (38.1%) | 0 (0.0%) |
| Total | 959 (100.0%) | 38 (100.0%) |
Physical Housing Characteristics in High Bridge
Housing Structures in High Bridge
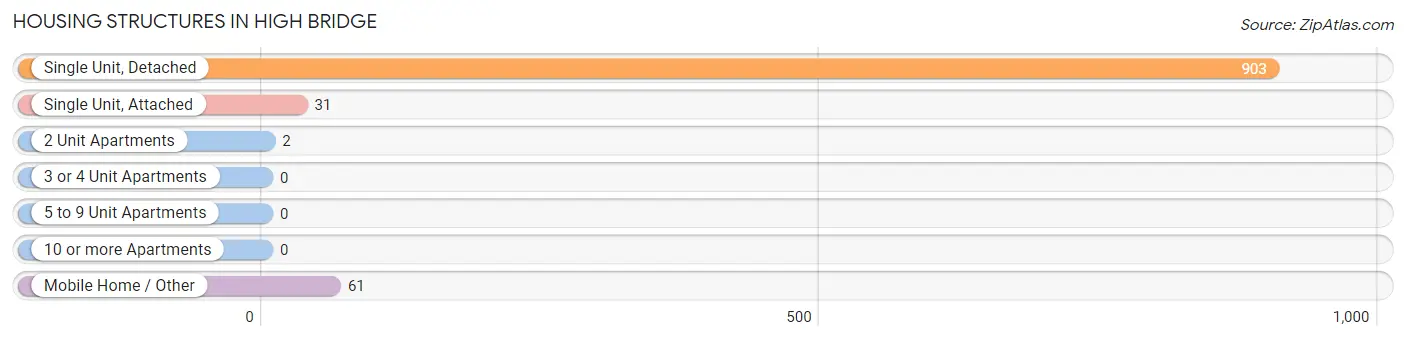
| Structure Type | # Housing Units | % Housing Units |
| Single Unit, Detached | 903 | 90.6% |
| Single Unit, Attached | 31 | 3.1% |
| 2 Unit Apartments | 2 | 0.2% |
| 3 or 4 Unit Apartments | 0 | 0.0% |
| 5 to 9 Unit Apartments | 0 | 0.0% |
| 10 or more Apartments | 0 | 0.0% |
| Mobile Home / Other | 61 | 6.1% |
| Total | 997 | 100.0% |
Housing Structures by Occupancy in High Bridge
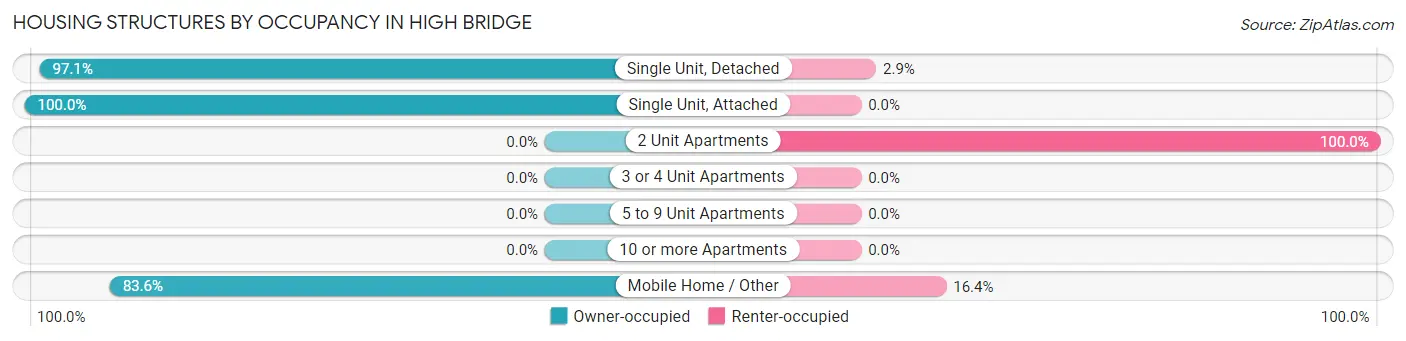
| Structure Type | Owner-occupied | Renter-occupied |
| Single Unit, Detached | 877 (97.1%) | 26 (2.9%) |
| Single Unit, Attached | 31 (100.0%) | 0 (0.0%) |
| 2 Unit Apartments | 0 (0.0%) | 2 (100.0%) |
| 3 or 4 Unit Apartments | 0 (0.0%) | 0 (0.0%) |
| 5 to 9 Unit Apartments | 0 (0.0%) | 0 (0.0%) |
| 10 or more Apartments | 0 (0.0%) | 0 (0.0%) |
| Mobile Home / Other | 51 (83.6%) | 10 (16.4%) |
| Total | 959 (96.2%) | 38 (3.8%) |
Housing Structures by Number of Rooms in High Bridge
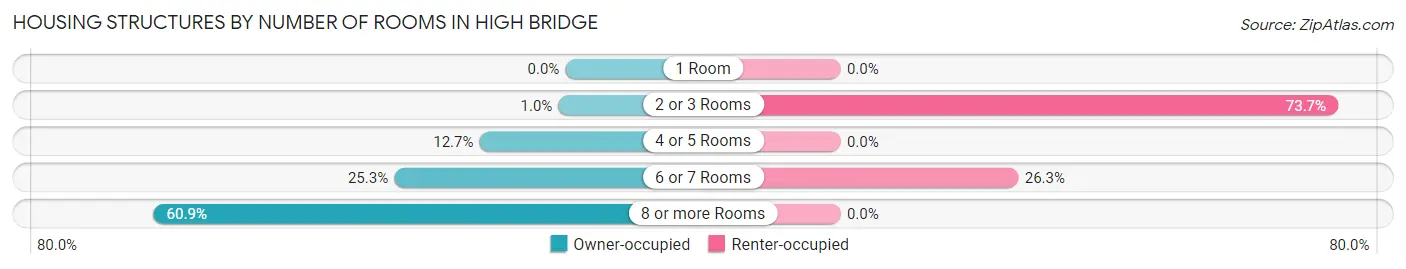
| Number of Rooms | Owner-occupied | Renter-occupied |
| 1 Room | 0 (0.0%) | 0 (0.0%) |
| 2 or 3 Rooms | 10 (1.0%) | 28 (73.7%) |
| 4 or 5 Rooms | 122 (12.7%) | 0 (0.0%) |
| 6 or 7 Rooms | 243 (25.3%) | 10 (26.3%) |
| 8 or more Rooms | 584 (60.9%) | 0 (0.0%) |
| Total | 959 (100.0%) | 38 (100.0%) |
Housing Structure by Heating Type in High Bridge
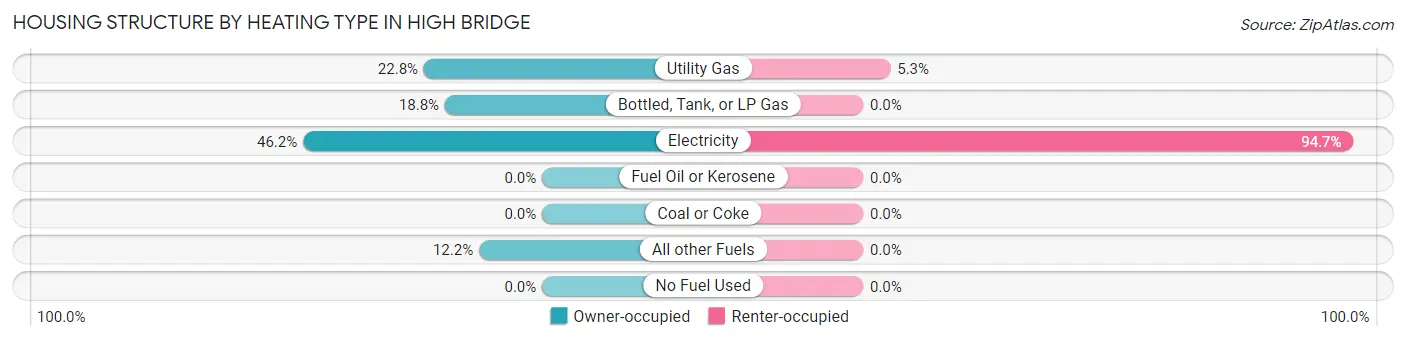
| Heating Type | Owner-occupied | Renter-occupied |
| Utility Gas | 219 (22.8%) | 2 (5.3%) |
| Bottled, Tank, or LP Gas | 180 (18.8%) | 0 (0.0%) |
| Electricity | 443 (46.2%) | 36 (94.7%) |
| Fuel Oil or Kerosene | 0 (0.0%) | 0 (0.0%) |
| Coal or Coke | 0 (0.0%) | 0 (0.0%) |
| All other Fuels | 117 (12.2%) | 0 (0.0%) |
| No Fuel Used | 0 (0.0%) | 0 (0.0%) |
| Total | 959 (100.0%) | 38 (100.0%) |
Household Vehicle Usage in High Bridge
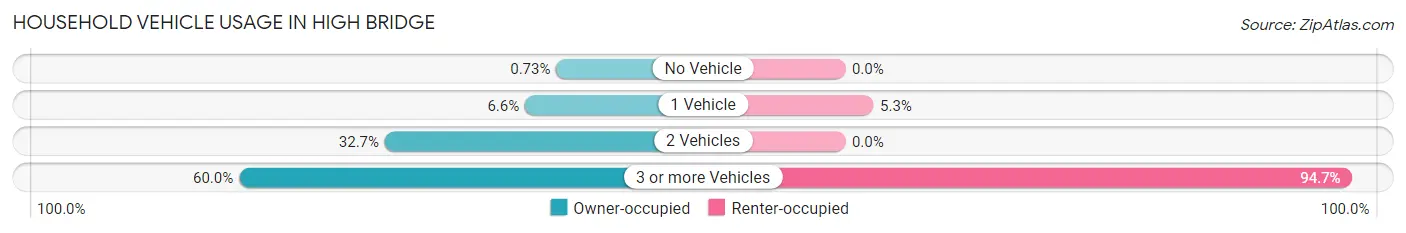
| Vehicles per Household | Owner-occupied | Renter-occupied |
| No Vehicle | 7 (0.7%) | 0 (0.0%) |
| 1 Vehicle | 63 (6.6%) | 2 (5.3%) |
| 2 Vehicles | 314 (32.7%) | 0 (0.0%) |
| 3 or more Vehicles | 575 (60.0%) | 36 (94.7%) |
| Total | 959 (100.0%) | 38 (100.0%) |
Real Estate & Mortgages in High Bridge
Real Estate and Mortgage Overview in High Bridge
| Characteristic | Without Mortgage | With Mortgage |
| Housing Units | 224 | 735 |
| Median Property Value | $844,800 | $850,300 |
| Median Household Income | $164,286 | $437 |
| Monthly Housing Costs | $939 | $365 |
| Real Estate Taxes | $7,037 | $0 |
Property Value by Mortgage Status in High Bridge
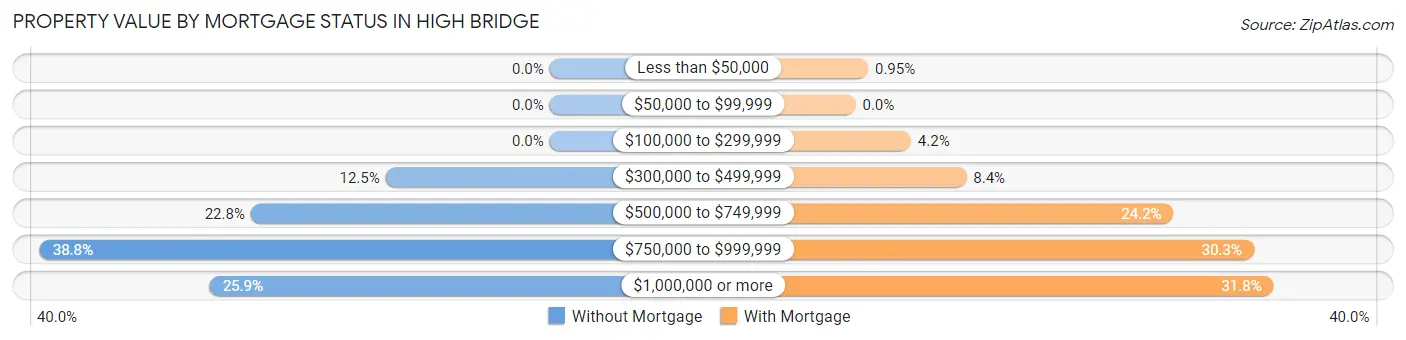
| Property Value | Without Mortgage | With Mortgage |
| Less than $50,000 | 0 (0.0%) | 7 (0.9%) |
| $50,000 to $99,999 | 0 (0.0%) | 0 (0.0%) |
| $100,000 to $299,999 | 0 (0.0%) | 31 (4.2%) |
| $300,000 to $499,999 | 28 (12.5%) | 62 (8.4%) |
| $500,000 to $749,999 | 51 (22.8%) | 178 (24.2%) |
| $750,000 to $999,999 | 87 (38.8%) | 223 (30.3%) |
| $1,000,000 or more | 58 (25.9%) | 234 (31.8%) |
| Total | 224 (100.0%) | 735 (100.0%) |
Household Income by Mortgage Status in High Bridge
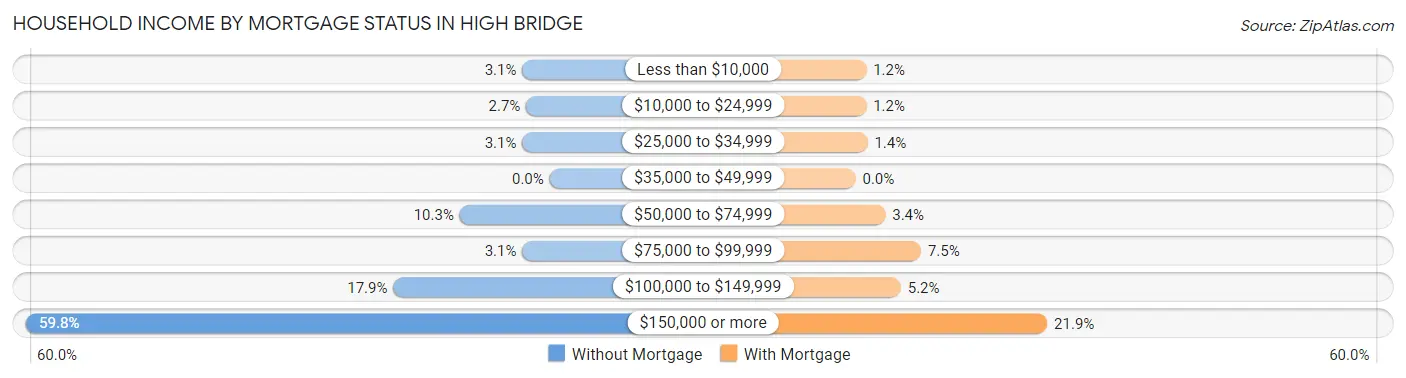
| Household Income | Without Mortgage | With Mortgage |
| Less than $10,000 | 7 (3.1%) | 9 (1.2%) |
| $10,000 to $24,999 | 6 (2.7%) | 9 (1.2%) |
| $25,000 to $34,999 | 7 (3.1%) | 10 (1.4%) |
| $35,000 to $49,999 | 0 (0.0%) | 0 (0.0%) |
| $50,000 to $74,999 | 23 (10.3%) | 25 (3.4%) |
| $75,000 to $99,999 | 7 (3.1%) | 55 (7.5%) |
| $100,000 to $149,999 | 40 (17.9%) | 38 (5.2%) |
| $150,000 or more | 134 (59.8%) | 161 (21.9%) |
| Total | 224 (100.0%) | 735 (100.0%) |
Property Value to Household Income Ratio in High Bridge
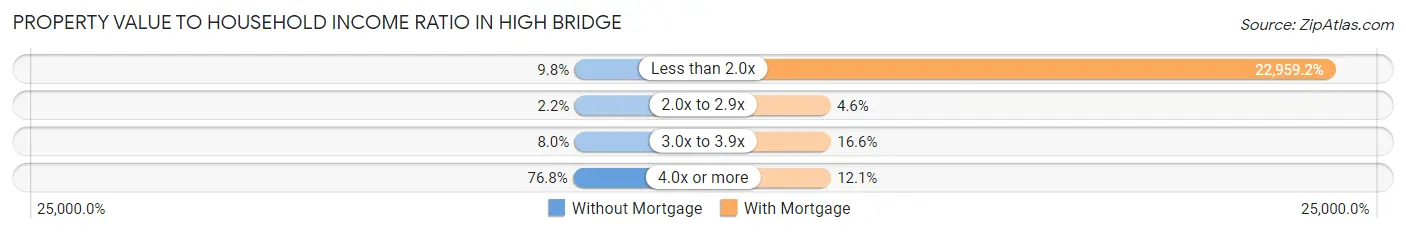
| Value-to-Income Ratio | Without Mortgage | With Mortgage |
| Less than 2.0x | 22 (9.8%) | 168,750 (22,959.2%) |
| 2.0x to 2.9x | 5 (2.2%) | 34 (4.6%) |
| 3.0x to 3.9x | 18 (8.0%) | 122 (16.6%) |
| 4.0x or more | 172 (76.8%) | 89 (12.1%) |
| Total | 224 (100.0%) | 735 (100.0%) |
Real Estate Taxes by Mortgage Status in High Bridge
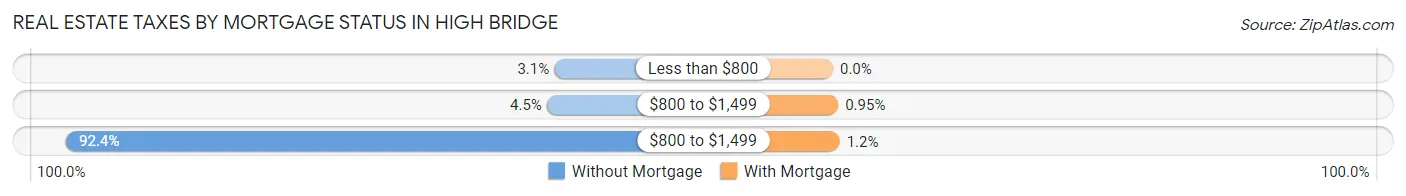
| Property Taxes | Without Mortgage | With Mortgage |
| Less than $800 | 7 (3.1%) | 0 (0.0%) |
| $800 to $1,499 | 10 (4.5%) | 7 (0.9%) |
| $800 to $1,499 | 207 (92.4%) | 9 (1.2%) |
| Total | 224 (100.0%) | 735 (100.0%) |
Health & Disability in High Bridge
Health Insurance Coverage by Age in High Bridge
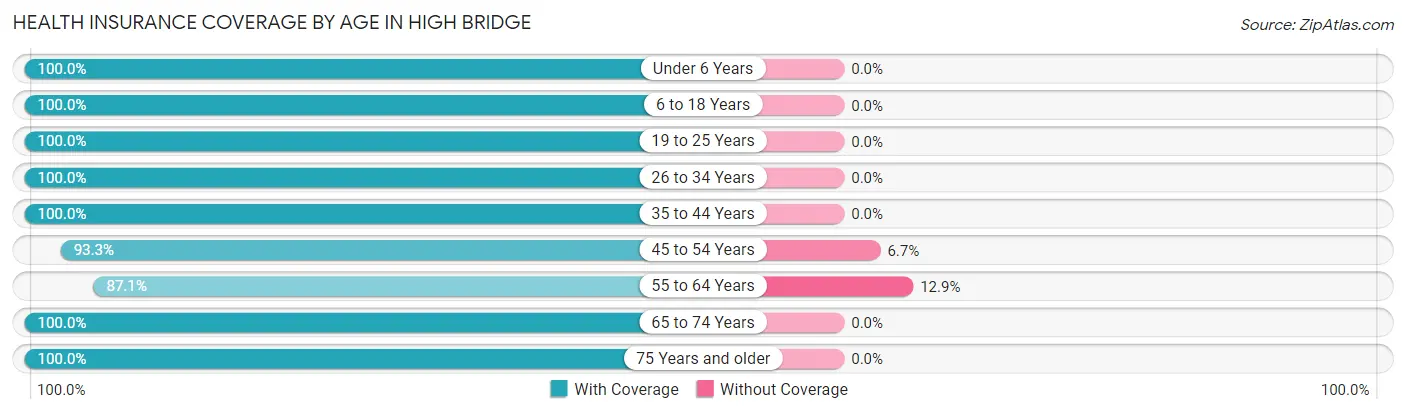
| Age Bracket | With Coverage | Without Coverage |
| Under 6 Years | 172 (100.0%) | 0 (0.0%) |
| 6 to 18 Years | 515 (100.0%) | 0 (0.0%) |
| 19 to 25 Years | 96 (100.0%) | 0 (0.0%) |
| 26 to 34 Years | 180 (100.0%) | 0 (0.0%) |
| 35 to 44 Years | 279 (100.0%) | 0 (0.0%) |
| 45 to 54 Years | 498 (93.3%) | 36 (6.7%) |
| 55 to 64 Years | 481 (87.1%) | 71 (12.9%) |
| 65 to 74 Years | 448 (100.0%) | 0 (0.0%) |
| 75 Years and older | 95 (100.0%) | 0 (0.0%) |
| Total | 2,764 (96.3%) | 107 (3.7%) |
Health Insurance Coverage by Citizenship Status in High Bridge
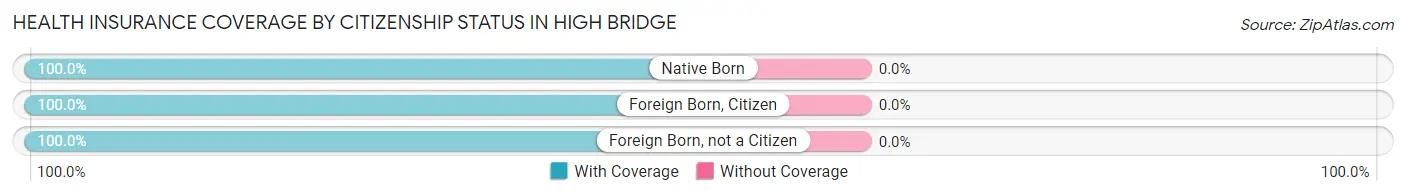
| Citizenship Status | With Coverage | Without Coverage |
| Native Born | 172 (100.0%) | 0 (0.0%) |
| Foreign Born, Citizen | 515 (100.0%) | 0 (0.0%) |
| Foreign Born, not a Citizen | 96 (100.0%) | 0 (0.0%) |
Health Insurance Coverage by Household Income in High Bridge
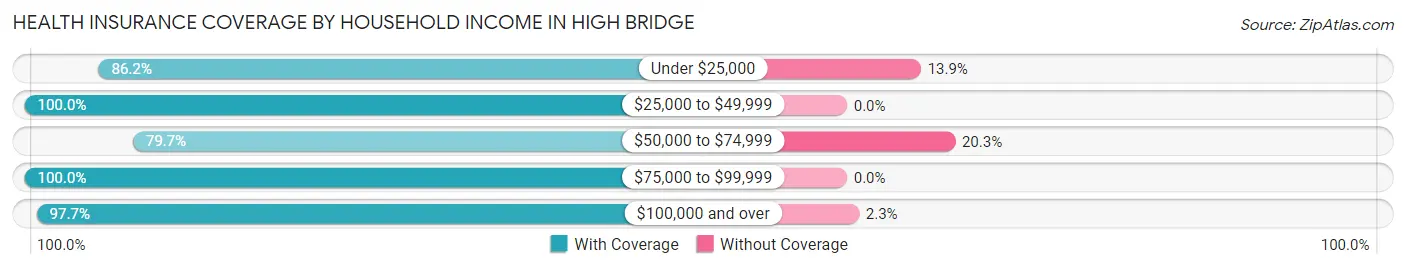
| Household Income | With Coverage | Without Coverage |
| Under $25,000 | 56 (86.2%) | 9 (13.9%) |
| $25,000 to $49,999 | 52 (100.0%) | 0 (0.0%) |
| $50,000 to $74,999 | 177 (79.7%) | 45 (20.3%) |
| $75,000 to $99,999 | 188 (100.0%) | 0 (0.0%) |
| $100,000 and over | 2,287 (97.7%) | 53 (2.3%) |
Public vs Private Health Insurance Coverage by Age in High Bridge
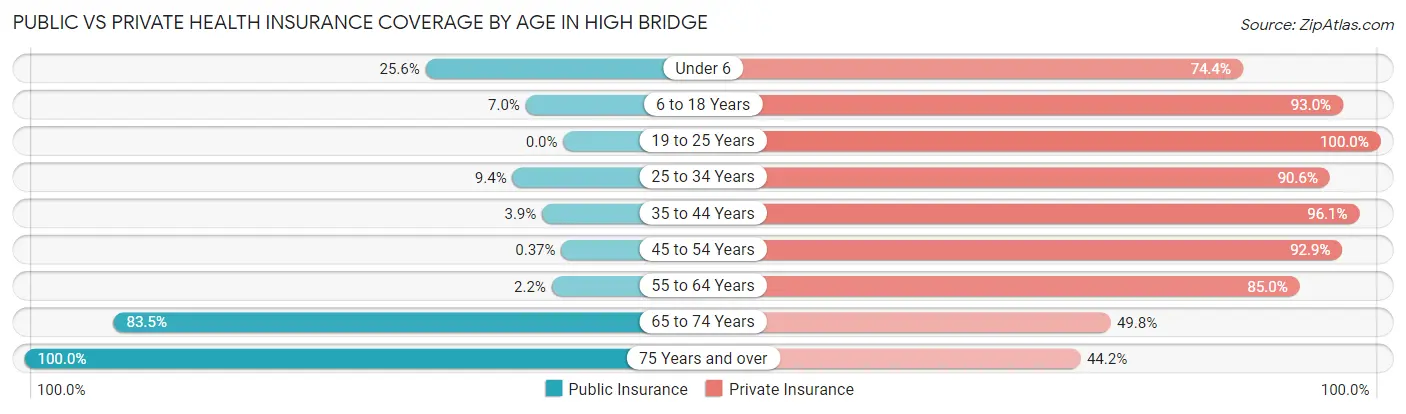
| Age Bracket | Public Insurance | Private Insurance |
| Under 6 | 44 (25.6%) | 128 (74.4%) |
| 6 to 18 Years | 36 (7.0%) | 479 (93.0%) |
| 19 to 25 Years | 0 (0.0%) | 96 (100.0%) |
| 25 to 34 Years | 17 (9.4%) | 163 (90.6%) |
| 35 to 44 Years | 11 (3.9%) | 268 (96.1%) |
| 45 to 54 Years | 2 (0.4%) | 496 (92.9%) |
| 55 to 64 Years | 12 (2.2%) | 469 (85.0%) |
| 65 to 74 Years | 374 (83.5%) | 223 (49.8%) |
| 75 Years and over | 95 (100.0%) | 42 (44.2%) |
| Total | 591 (20.6%) | 2,364 (82.3%) |
Disability Status by Sex by Age in High Bridge
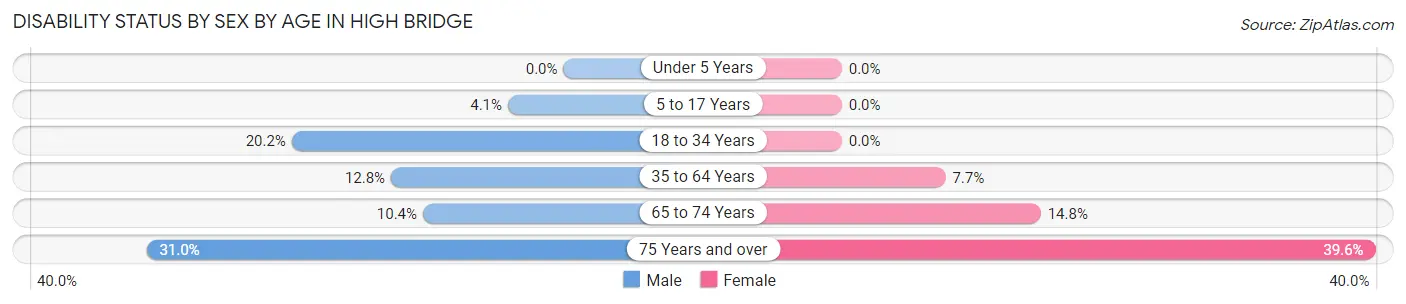
| Age Bracket | Male | Female |
| Under 5 Years | 0 (0.0%) | 0 (0.0%) |
| 5 to 17 Years | 11 (4.1%) | 0 (0.0%) |
| 18 to 34 Years | 24 (20.2%) | 0 (0.0%) |
| 35 to 64 Years | 90 (12.8%) | 51 (7.7%) |
| 65 to 74 Years | 22 (10.4%) | 35 (14.8%) |
| 75 Years and over | 13 (30.9%) | 21 (39.6%) |
Disability Class by Sex by Age in High Bridge
Disability Class: Hearing Difficulty
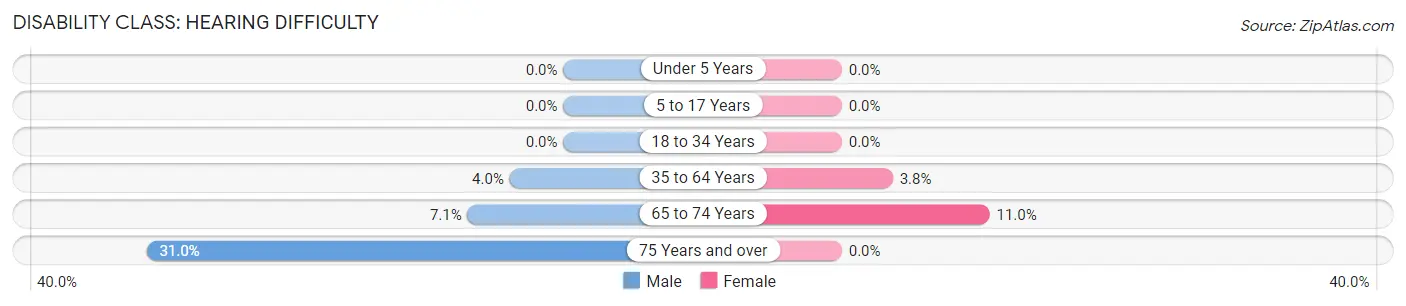
| Age Bracket | Male | Female |
| Under 5 Years | 0 (0.0%) | 0 (0.0%) |
| 5 to 17 Years | 0 (0.0%) | 0 (0.0%) |
| 18 to 34 Years | 0 (0.0%) | 0 (0.0%) |
| 35 to 64 Years | 28 (4.0%) | 25 (3.8%) |
| 65 to 74 Years | 15 (7.1%) | 26 (11.0%) |
| 75 Years and over | 13 (30.9%) | 0 (0.0%) |
Disability Class: Vision Difficulty
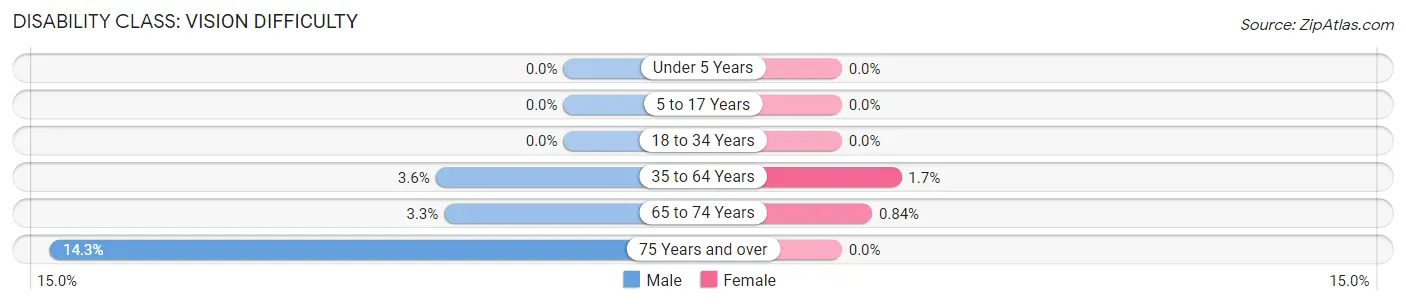
| Age Bracket | Male | Female |
| Under 5 Years | 0 (0.0%) | 0 (0.0%) |
| 5 to 17 Years | 0 (0.0%) | 0 (0.0%) |
| 18 to 34 Years | 0 (0.0%) | 0 (0.0%) |
| 35 to 64 Years | 25 (3.6%) | 11 (1.7%) |
| 65 to 74 Years | 7 (3.3%) | 2 (0.8%) |
| 75 Years and over | 6 (14.3%) | 0 (0.0%) |
Disability Class: Cognitive Difficulty
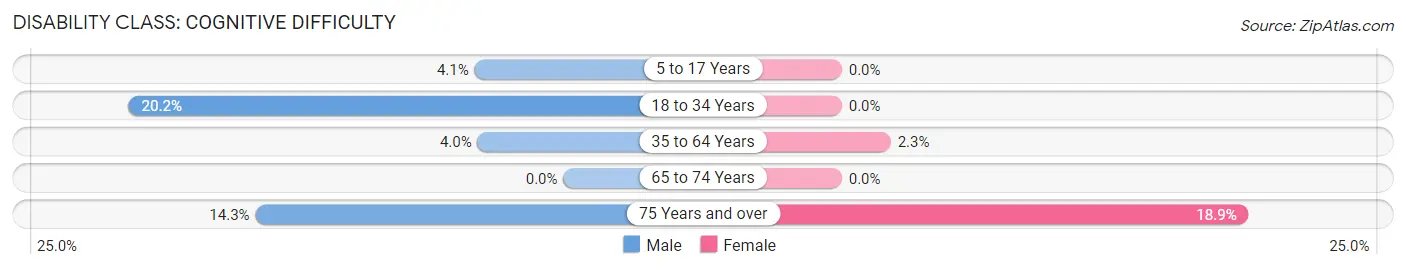
| Age Bracket | Male | Female |
| 5 to 17 Years | 11 (4.1%) | 0 (0.0%) |
| 18 to 34 Years | 24 (20.2%) | 0 (0.0%) |
| 35 to 64 Years | 28 (4.0%) | 15 (2.3%) |
| 65 to 74 Years | 0 (0.0%) | 0 (0.0%) |
| 75 Years and over | 6 (14.3%) | 10 (18.9%) |
Disability Class: Ambulatory Difficulty
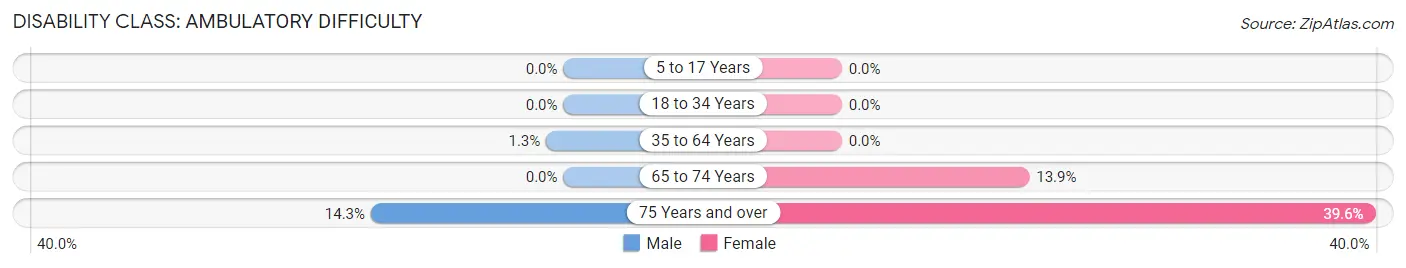
| Age Bracket | Male | Female |
| 5 to 17 Years | 0 (0.0%) | 0 (0.0%) |
| 18 to 34 Years | 0 (0.0%) | 0 (0.0%) |
| 35 to 64 Years | 9 (1.3%) | 0 (0.0%) |
| 65 to 74 Years | 0 (0.0%) | 33 (13.9%) |
| 75 Years and over | 6 (14.3%) | 21 (39.6%) |
Disability Class: Self-Care Difficulty
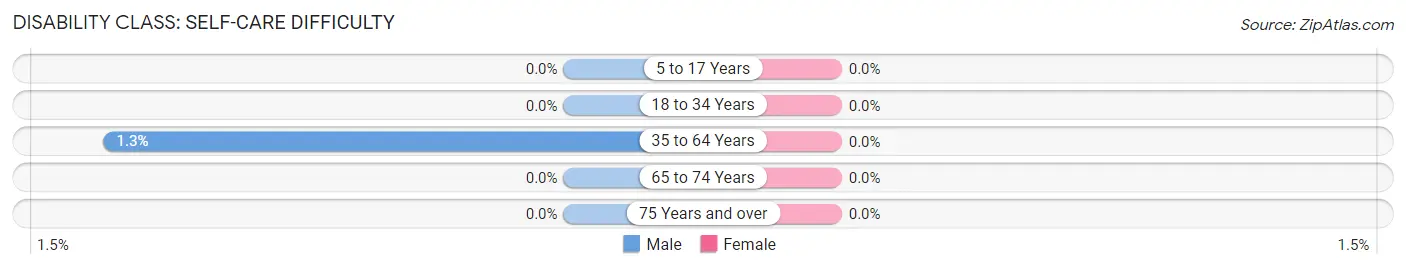
| Age Bracket | Male | Female |
| 5 to 17 Years | 0 (0.0%) | 0 (0.0%) |
| 18 to 34 Years | 0 (0.0%) | 0 (0.0%) |
| 35 to 64 Years | 9 (1.3%) | 0 (0.0%) |
| 65 to 74 Years | 0 (0.0%) | 0 (0.0%) |
| 75 Years and over | 0 (0.0%) | 0 (0.0%) |
Technology Access in High Bridge
Computing Device Access in High Bridge
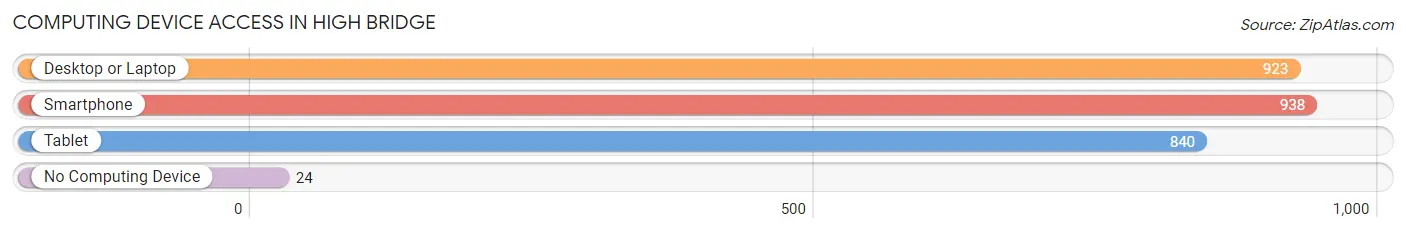
| Device Type | # Households | % Households |
| Desktop or Laptop | 923 | 92.6% |
| Smartphone | 938 | 94.1% |
| Tablet | 840 | 84.3% |
| No Computing Device | 24 | 2.4% |
| Total | 997 | 100.0% |
Internet Access in High Bridge
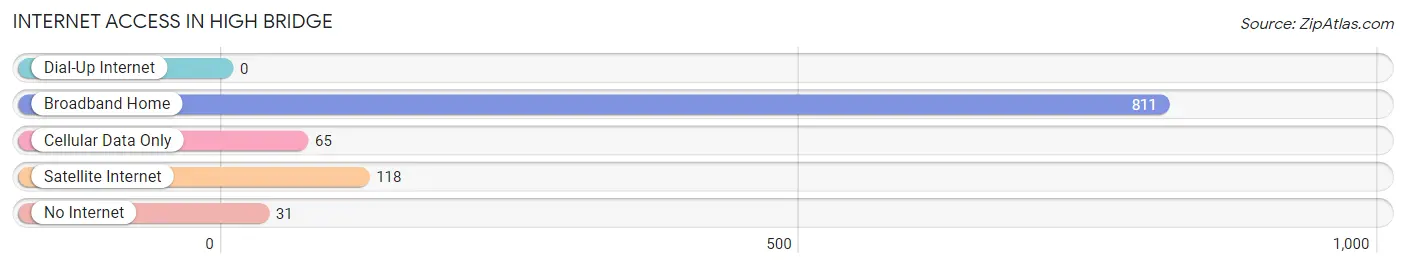
| Internet Type | # Households | % Households |
| Dial-Up Internet | 0 | 0.0% |
| Broadband Home | 811 | 81.3% |
| Cellular Data Only | 65 | 6.5% |
| Satellite Internet | 118 | 11.8% |
| No Internet | 31 | 3.1% |
| Total | 997 | 100.0% |
High Bridge Summary
High Bridge is a small unincorporated community located in King County, Washington, United States. It is situated on the south bank of the Snoqualmie River, approximately 25 miles east of Seattle. The community is named for the bridge that crosses the river at the site.
History
High Bridge was first settled in the late 1800s by homesteaders who were attracted to the area by its abundant natural resources. The first bridge across the Snoqualmie River was built in 1891, and the community was officially established in 1895. The bridge was replaced in the early 1900s, and the current bridge was built in the 1950s.
The community was originally a logging and farming community, and the local economy was largely based on these industries. In the early 1900s, the area was also home to a number of small businesses, including a general store, a blacksmith shop, and a sawmill.
Geography
High Bridge is located in the foothills of the Cascade Mountains, approximately 25 miles east of Seattle. The community is situated on the south bank of the Snoqualmie River, and is surrounded by forests and rolling hills. The area is known for its scenic beauty, and is a popular destination for outdoor recreation.
The climate in High Bridge is mild and temperate, with warm summers and cool winters. The average annual temperature is around 50 degrees Fahrenheit, and the average annual precipitation is around 40 inches.
Economy
The economy of High Bridge is largely based on tourism and outdoor recreation. The area is home to a number of popular outdoor attractions, including hiking trails, fishing spots, and camping sites. The community is also home to a number of small businesses, including restaurants, shops, and lodging.
Demographics
As of the 2010 census, the population of High Bridge was 1,093. The racial makeup of the community was 94.3% White, 0.7% African American, 0.3% Native American, 0.7% Asian, 0.1% Pacific Islander, and 3.0% from other races. The median household income was $50,000, and the median age was 44.
High Bridge is a small, close-knit community with a strong sense of community and pride. The area is known for its friendly atmosphere and welcoming attitude, and is a popular destination for outdoor recreation and relaxation.
Common Questions
What is Per Capita Income in High Bridge?
Per Capita income in High Bridge is $66,736.
What is the Median Family Income in High Bridge?
Median Family Income in High Bridge is $164,881.
What is the Median Household income in High Bridge?
Median Household Income in High Bridge is $162,560.
What is Income or Wage Gap in High Bridge?
Income or Wage Gap in High Bridge is 50.1%.
Women in High Bridge earn 49.9 cents for every dollar earned by a man.
What is Inequality or Gini Index in High Bridge?
Inequality or Gini Index in High Bridge is 0.36.
What is the Total Population of High Bridge?
Total Population of High Bridge is 2,871.
What is the Total Male Population of High Bridge?
Total Male Population of High Bridge is 1,403.
What is the Total Female Population of High Bridge?
Total Female Population of High Bridge is 1,468.
What is the Ratio of Males per 100 Females in High Bridge?
There are 95.57 Males per 100 Females in High Bridge.
What is the Ratio of Females per 100 Males in High Bridge?
There are 104.63 Females per 100 Males in High Bridge.
What is the Median Population Age in High Bridge?
Median Population Age in High Bridge is 50.6 Years.
What is the Average Family Size in High Bridge
Average Family Size in High Bridge is 3.0 People.
What is the Average Household Size in High Bridge
Average Household Size in High Bridge is 2.9 People.
How Large is the Labor Force in High Bridge?
There are 1,502 People in the Labor Forcein in High Bridge.
What is the Percentage of People in the Labor Force in High Bridge?
65.6% of People are in the Labor Force in High Bridge.
What is the Unemployment Rate in High Bridge?
Unemployment Rate in High Bridge is 3.3%.