Startup, WA Map & Demographics
Startup Map
Startup Overview
$64,038
PER CAPITA INCOME
$63,728
AVG FAMILY INCOME
$96,492
AVG HOUSEHOLD INCOME
0.39
INEQUALITY / GINI INDEX
651
TOTAL POPULATION
275
MALE POPULATION
376
FEMALE POPULATION
73.14
MALES / 100 FEMALES
136.73
FEMALES / 100 MALES
59.3
MEDIAN AGE
2.1
AVG FAMILY SIZE
1.9
AVG HOUSEHOLD SIZE
389
LABOR FORCE [ PEOPLE ]
66.0%
PERCENT IN LABOR FORCE
Income in Startup
Income Overview in Startup
Per Capita Income in Startup is $64,038, while median incomes of families and households are $63,728 and $96,492 respectively.
| Characteristic | Number | Measure |
| Per Capita Income | 651 | $64,038 |
| Median Family Income | 242 | $63,728 |
| Mean Family Income | 242 | $118,978 |
| Median Household Income | 333 | $96,492 |
| Mean Household Income | 333 | $122,963 |
| Income Deficit | 242 | $0 |
| Wage / Income Gap (%) | 651 | 0.00% |
| Wage / Income Gap ($) | 651 | 100.00¢ per $1 |
| Gini / Inequality Index | 651 | 0.39 |
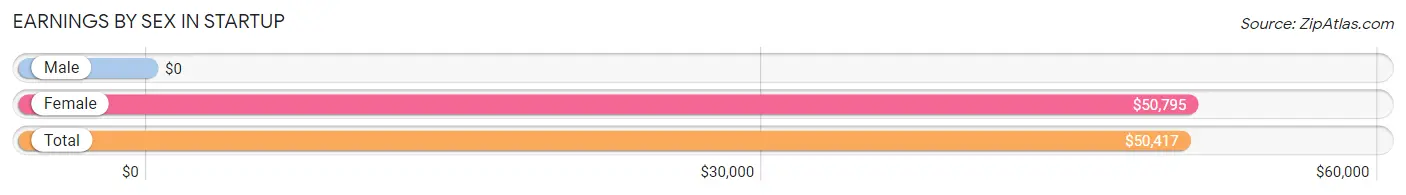
Earnings by Sex in Startup
| Sex | Number | Average Earnings |
| Male | 226 (58.1%) | $0 |
| Female | 163 (41.9%) | $50,795 |
| Total | 389 (100.0%) | $50,417 |
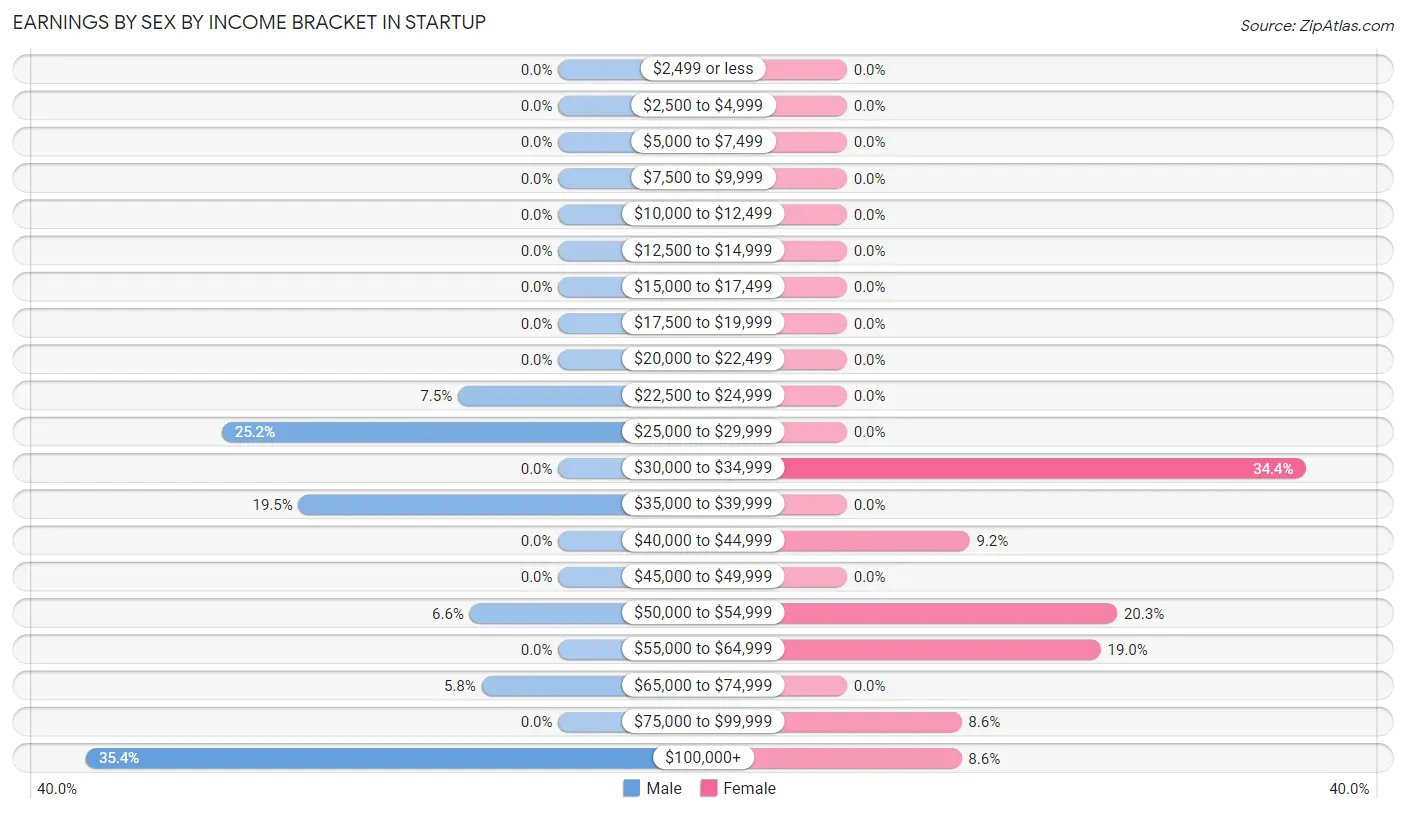
Earnings by Sex by Income Bracket in Startup
The most common earnings brackets in Startup are $100,000+ for men (80 | 35.4%) and $30,000 to $34,999 for women (56 | 34.4%).
| Income | Male | Female |
| $2,499 or less | 0 (0.0%) | 0 (0.0%) |
| $2,500 to $4,999 | 0 (0.0%) | 0 (0.0%) |
| $5,000 to $7,499 | 0 (0.0%) | 0 (0.0%) |
| $7,500 to $9,999 | 0 (0.0%) | 0 (0.0%) |
| $10,000 to $12,499 | 0 (0.0%) | 0 (0.0%) |
| $12,500 to $14,999 | 0 (0.0%) | 0 (0.0%) |
| $15,000 to $17,499 | 0 (0.0%) | 0 (0.0%) |
| $17,500 to $19,999 | 0 (0.0%) | 0 (0.0%) |
| $20,000 to $22,499 | 0 (0.0%) | 0 (0.0%) |
| $22,500 to $24,999 | 17 (7.5%) | 0 (0.0%) |
| $25,000 to $29,999 | 57 (25.2%) | 0 (0.0%) |
| $30,000 to $34,999 | 0 (0.0%) | 56 (34.4%) |
| $35,000 to $39,999 | 44 (19.5%) | 0 (0.0%) |
| $40,000 to $44,999 | 0 (0.0%) | 15 (9.2%) |
| $45,000 to $49,999 | 0 (0.0%) | 0 (0.0%) |
| $50,000 to $54,999 | 15 (6.6%) | 33 (20.3%) |
| $55,000 to $64,999 | 0 (0.0%) | 31 (19.0%) |
| $65,000 to $74,999 | 13 (5.8%) | 0 (0.0%) |
| $75,000 to $99,999 | 0 (0.0%) | 14 (8.6%) |
| $100,000+ | 80 (35.4%) | 14 (8.6%) |
| Total | 226 (100.0%) | 163 (100.0%) |
Earnings by Sex by Educational Attainment in Startup
| Educational Attainment | Male Income | Female Income |
| Less than High School | - | - |
| High School Diploma | - | - |
| College or Associate's Degree | - | - |
| Bachelor's Degree | - | - |
| Graduate Degree | - | - |
| Total | - | - |
Family Income in Startup
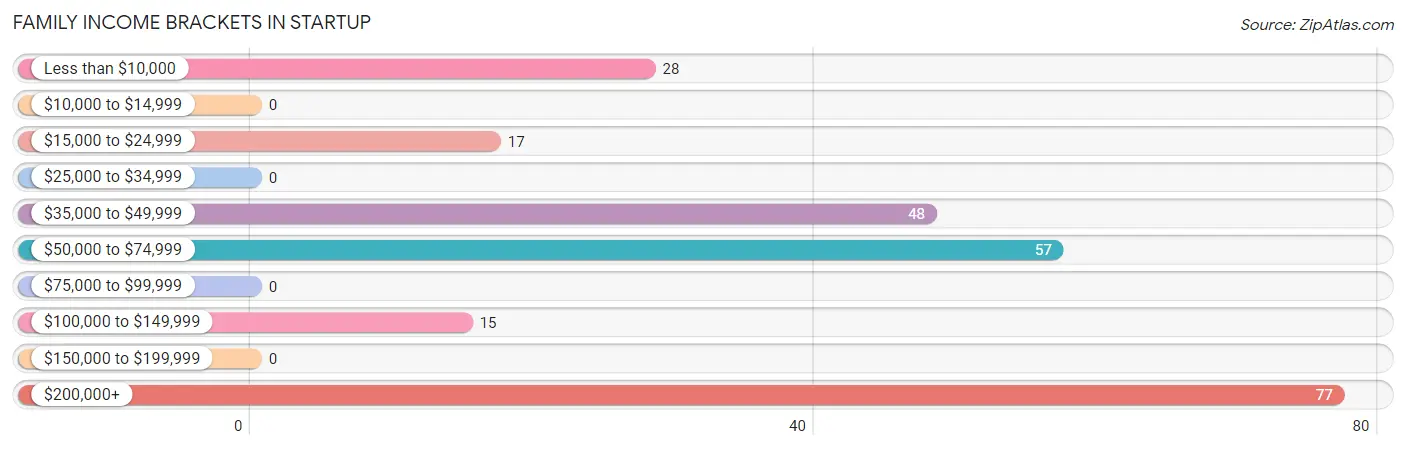
Family Income Brackets in Startup
According to the Startup family income data, there are 77 families falling into the $200,000+ income range, which is the most common income bracket and makes up 31.8% of all families.
| Income Bracket | # Families | % Families |
| Less than $10,000 | 28 | 11.6% |
| $10,000 to $14,999 | 0 | 0.0% |
| $15,000 to $24,999 | 17 | 7.0% |
| $25,000 to $34,999 | 0 | 0.0% |
| $35,000 to $49,999 | 48 | 19.8% |
| $50,000 to $74,999 | 57 | 23.6% |
| $75,000 to $99,999 | 0 | 0.0% |
| $100,000 to $149,999 | 15 | 6.2% |
| $150,000 to $199,999 | 0 | 0.0% |
| $200,000+ | 77 | 31.8% |
Family Income by Famaliy Size in Startup
| Income Bracket | # Families | Median Income |
| 2-Person Families | 225 (93.0%) | $0 |
| 3-Person Families | 17 (7.0%) | $0 |
| 4-Person Families | 0 (0.0%) | $0 |
| 5-Person Families | 0 (0.0%) | $0 |
| 6-Person Families | 0 (0.0%) | $0 |
| 7+ Person Families | 0 (0.0%) | $0 |
| Total | 242 (100.0%) | $63,728 |
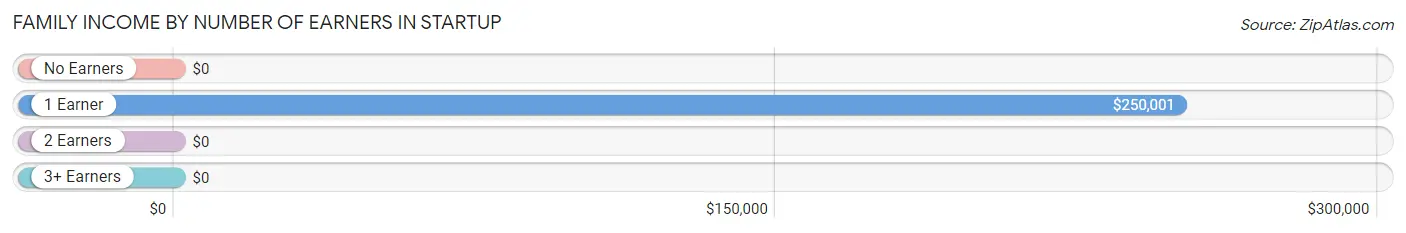
Family Income by Number of Earners in Startup
| Number of Earners | # Families | Median Income |
| No Earners | 61 (25.2%) | $0 |
| 1 Earner | 109 (45.0%) | $250,001 |
| 2 Earners | 72 (29.7%) | $0 |
| 3+ Earners | 0 (0.0%) | $0 |
| Total | 242 (100.0%) | $63,728 |
Household Income in Startup
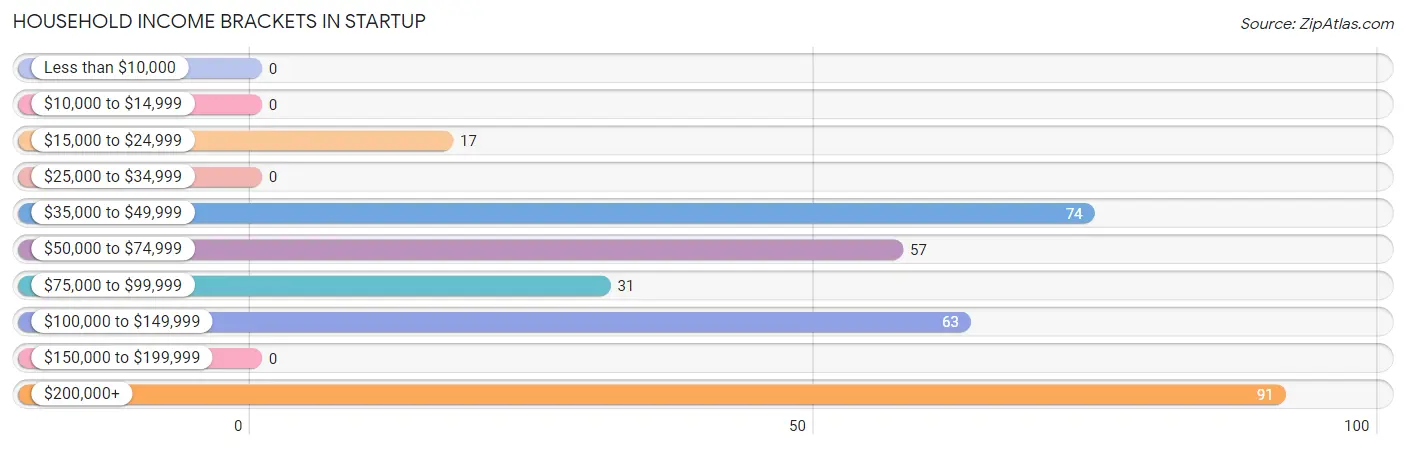
Household Income Brackets in Startup
With 91 households falling in the category, the $200,000+ income range is the most frequent in Startup, accounting for 27.3% of all households.
| Income Bracket | # Households | % Households |
| Less than $10,000 | 0 | 0.0% |
| $10,000 to $14,999 | 0 | 0.0% |
| $15,000 to $24,999 | 17 | 5.1% |
| $25,000 to $34,999 | 0 | 0.0% |
| $35,000 to $49,999 | 74 | 22.2% |
| $50,000 to $74,999 | 57 | 17.1% |
| $75,000 to $99,999 | 31 | 9.3% |
| $100,000 to $149,999 | 63 | 18.9% |
| $150,000 to $199,999 | 0 | 0.0% |
| $200,000+ | 91 | 27.3% |
Household Income by Householder Age in Startup
The median household income in Startup is $96,492, with the highest median household income of $250,001 found in the 45 to 64 years age bracket for the primary householder. A total of 152 households (45.7%) fall into this category.
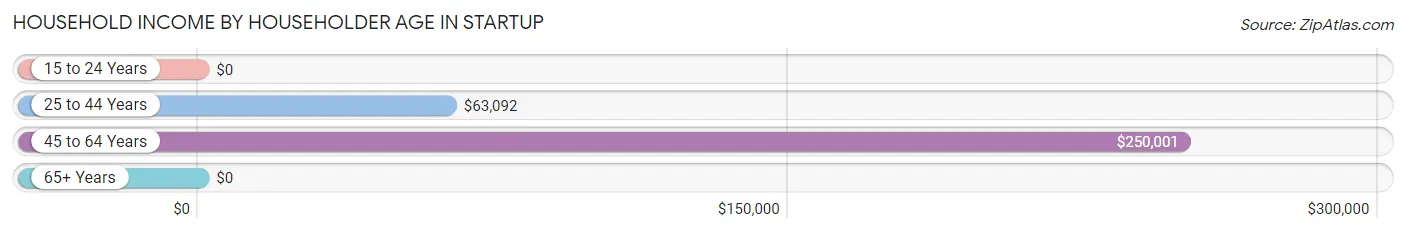
| Income Bracket | # Households | Median Income |
| 15 to 24 Years | 0 (0.0%) | $0 |
| 25 to 44 Years | 117 (35.1%) | $63,092 |
| 45 to 64 Years | 152 (45.7%) | $250,001 |
| 65+ Years | 64 (19.2%) | $0 |
| Total | 333 (100.0%) | $96,492 |
Poverty in Startup
Income Below Poverty by Sex and Age in Startup
With 6.2% poverty level for males and 27.4% for females among the residents of Startup, 25 to 34 year old males and under 5 year old females are the most vulnerable to poverty, with 17 males (23.0%) and 15 females (100.0%) in their respective age groups living below the poverty level.
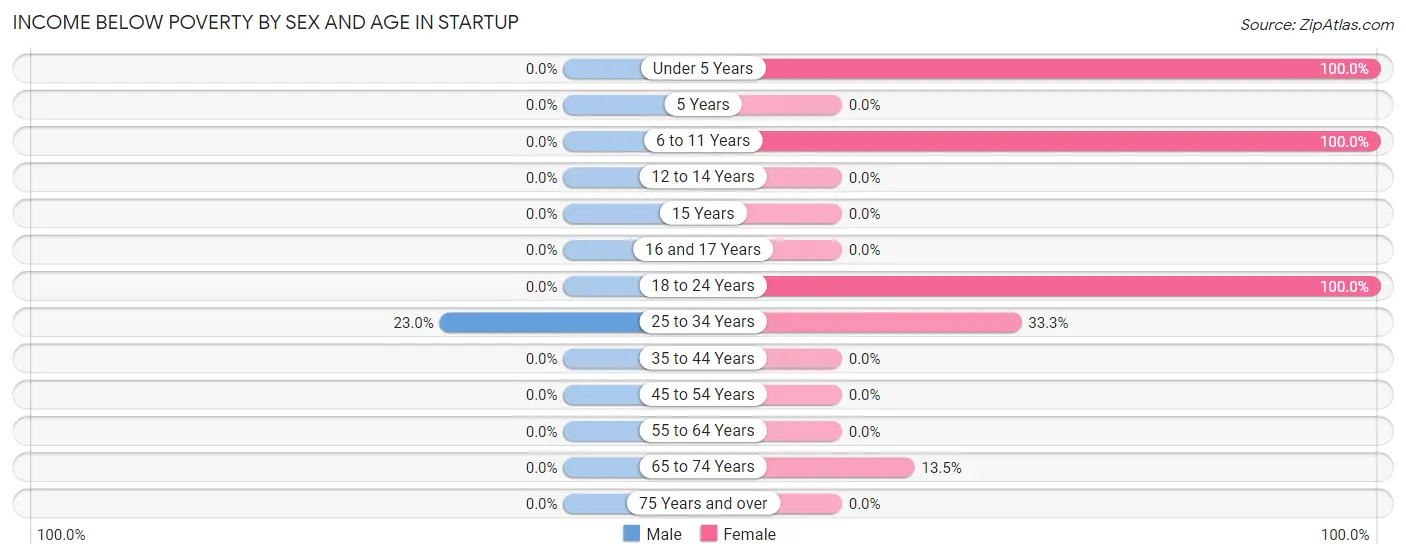
| Age Bracket | Male | Female |
| Under 5 Years | 0 (0.0%) | 15 (100.0%) |
| 5 Years | 0 (0.0%) | 0 (0.0%) |
| 6 to 11 Years | 0 (0.0%) | 33 (100.0%) |
| 12 to 14 Years | 0 (0.0%) | 0 (0.0%) |
| 15 Years | 0 (0.0%) | 0 (0.0%) |
| 16 and 17 Years | 0 (0.0%) | 0 (0.0%) |
| 18 to 24 Years | 0 (0.0%) | 17 (100.0%) |
| 25 to 34 Years | 17 (23.0%) | 28 (33.3%) |
| 35 to 44 Years | 0 (0.0%) | 0 (0.0%) |
| 45 to 54 Years | 0 (0.0%) | 0 (0.0%) |
| 55 to 64 Years | 0 (0.0%) | 0 (0.0%) |
| 65 to 74 Years | 0 (0.0%) | 10 (13.5%) |
| 75 Years and over | 0 (0.0%) | 0 (0.0%) |
| Total | 17 (6.2%) | 103 (27.4%) |
Income Above Poverty by Sex and Age in Startup
According to the poverty statistics in Startup, males aged 12 to 14 years and females aged 35 to 44 years are the age groups that are most secure financially, with 100.0% of males and 100.0% of females in these age groups living above the poverty line.
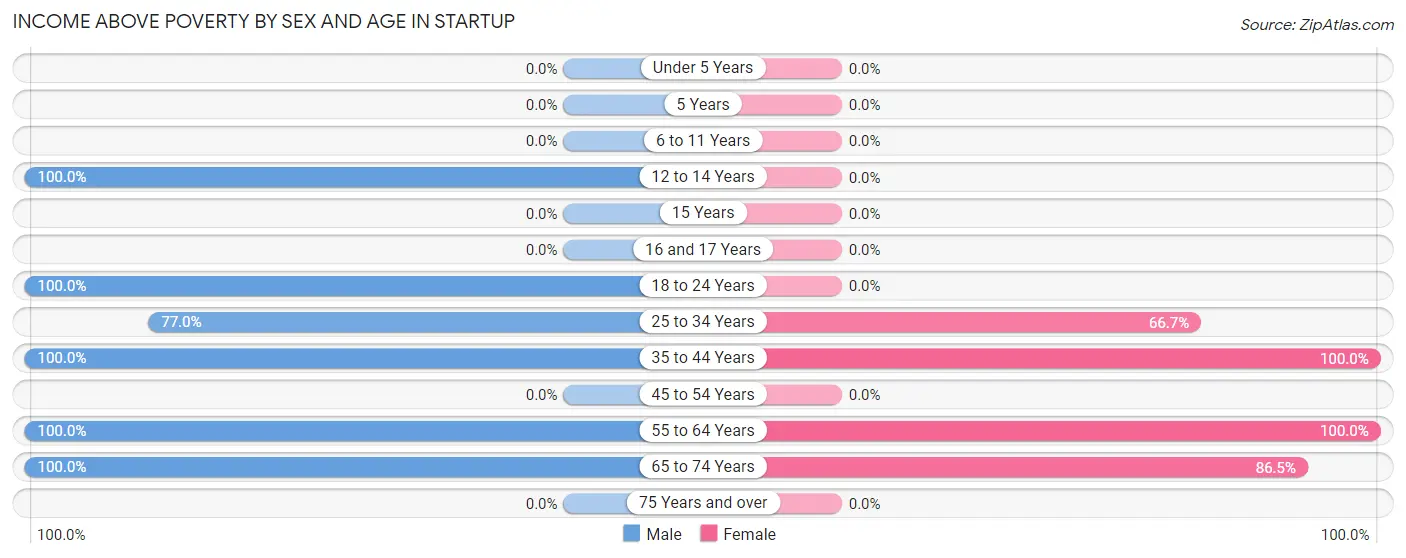
| Age Bracket | Male | Female |
| Under 5 Years | 0 (0.0%) | 0 (0.0%) |
| 5 Years | 0 (0.0%) | 0 (0.0%) |
| 6 to 11 Years | 0 (0.0%) | 0 (0.0%) |
| 12 to 14 Years | 14 (100.0%) | 0 (0.0%) |
| 15 Years | 0 (0.0%) | 0 (0.0%) |
| 16 and 17 Years | 0 (0.0%) | 0 (0.0%) |
| 18 to 24 Years | 31 (100.0%) | 0 (0.0%) |
| 25 to 34 Years | 57 (77.0%) | 56 (66.7%) |
| 35 to 44 Years | 13 (100.0%) | 15 (100.0%) |
| 45 to 54 Years | 0 (0.0%) | 0 (0.0%) |
| 55 to 64 Years | 108 (100.0%) | 138 (100.0%) |
| 65 to 74 Years | 35 (100.0%) | 64 (86.5%) |
| 75 Years and over | 0 (0.0%) | 0 (0.0%) |
| Total | 258 (93.8%) | 273 (72.6%) |
Income Below Poverty Among Married-Couple Families in Startup
The poverty statistics for married-couple families in Startup show that 8.5% or 17 of the total 199 families live below the poverty line. Families with 1 or 2 children have the highest poverty rate of 100.0%, comprising of 17 families. On the other hand, families with no children have the lowest poverty rate of 0.0%, which includes 0 families.
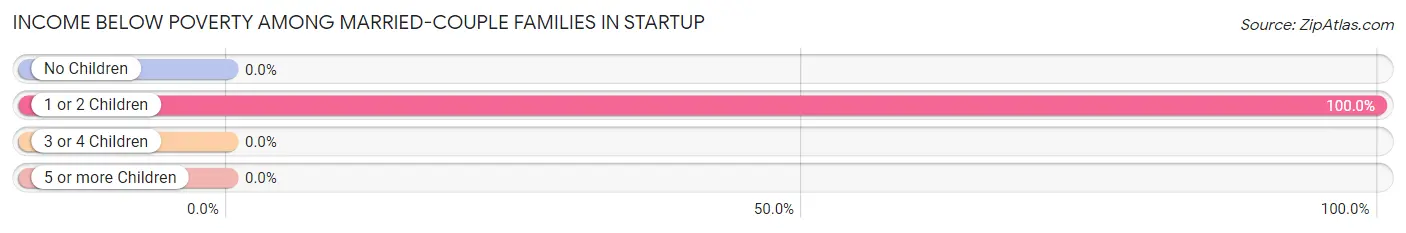
| Children | Above Poverty | Below Poverty |
| No Children | 182 (100.0%) | 0 (0.0%) |
| 1 or 2 Children | 0 (0.0%) | 17 (100.0%) |
| 3 or 4 Children | 0 (0.0%) | 0 (0.0%) |
| 5 or more Children | 0 (0.0%) | 0 (0.0%) |
| Total | 182 (91.5%) | 17 (8.5%) |
Income Below Poverty Among Single-Parent Households in Startup
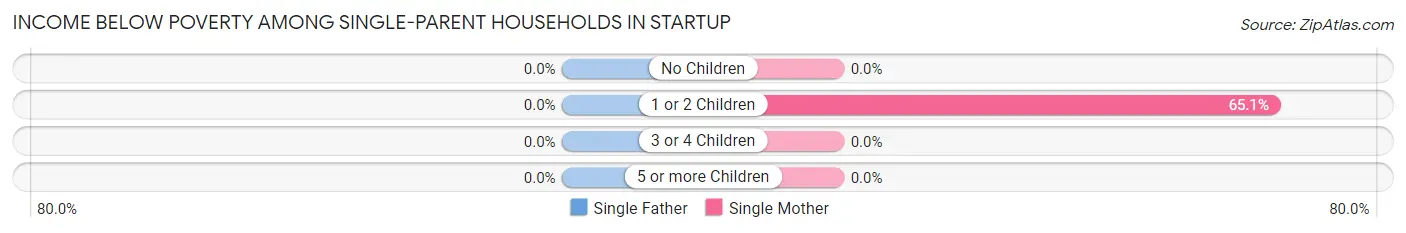
| Children | Single Father | Single Mother |
| No Children | 0 (0.0%) | 0 (0.0%) |
| 1 or 2 Children | 0 (0.0%) | 28 (65.1%) |
| 3 or 4 Children | 0 (0.0%) | 0 (0.0%) |
| 5 or more Children | 0 (0.0%) | 0 (0.0%) |
| Total | 0 (0.0%) | 28 (65.1%) |
Income Below Poverty Among Married-Couple vs Single-Parent Households in Startup
The poverty data for Startup shows that 17 of the married-couple family households (8.5%) and 28 of the single-parent households (65.1%) are living below the poverty level. Within the married-couple family households, those with 1 or 2 children have the highest poverty rate, with 17 households (100.0%) falling below the poverty line. Among the single-parent households, those with 1 or 2 children have the highest poverty rate, with 28 household (65.1%) living below poverty.
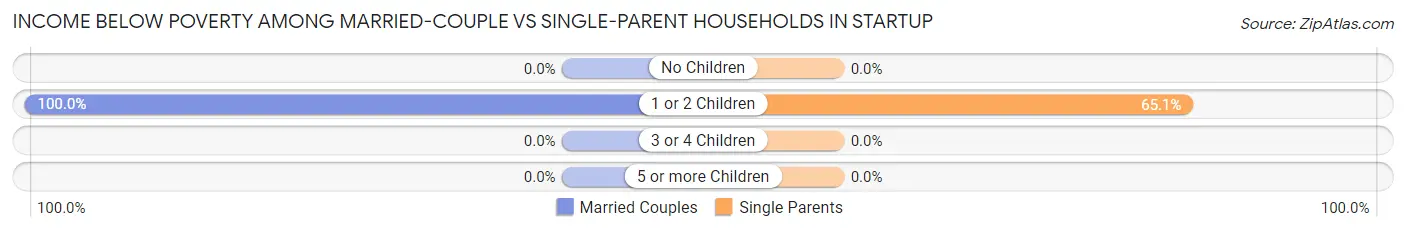
| Children | Married-Couple Families | Single-Parent Households |
| No Children | 0 (0.0%) | 0 (0.0%) |
| 1 or 2 Children | 17 (100.0%) | 28 (65.1%) |
| 3 or 4 Children | 0 (0.0%) | 0 (0.0%) |
| 5 or more Children | 0 (0.0%) | 0 (0.0%) |
| Total | 17 (8.5%) | 28 (65.1%) |
Race in Startup
The most populous races in Startup are White / Caucasian (489 | 75.1%), Hispanic or Latino (149 | 22.9%), and Two or more Races (103 | 15.8%).
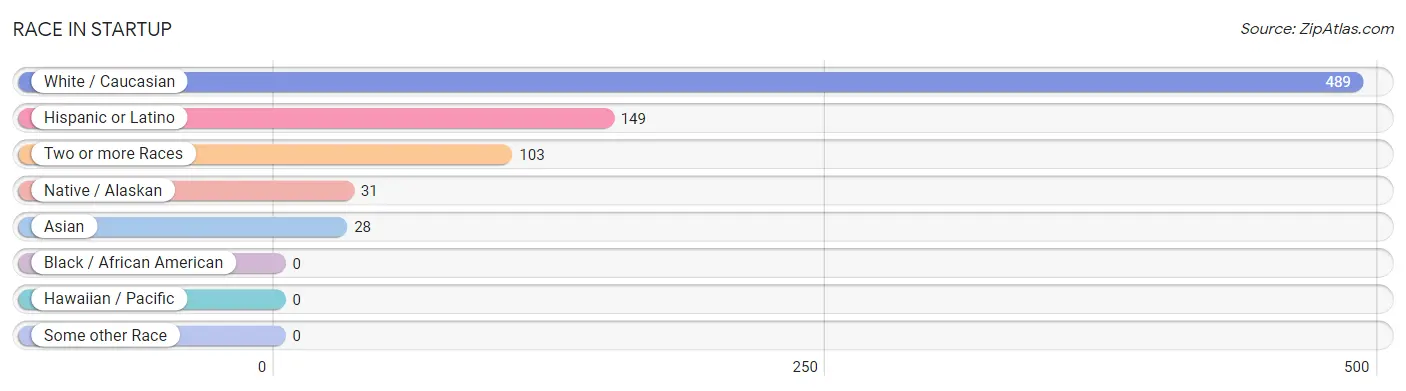
| Race | # Population | % Population |
| Asian | 28 | 4.3% |
| Black / African American | 0 | 0.0% |
| Hawaiian / Pacific | 0 | 0.0% |
| Hispanic or Latino | 149 | 22.9% |
| Native / Alaskan | 31 | 4.8% |
| White / Caucasian | 489 | 75.1% |
| Two or more Races | 103 | 15.8% |
| Some other Race | 0 | 0.0% |
| Total | 651 | 100.0% |
Ancestry in Startup
The most populous ancestries reported in Startup are European (162 | 24.9%), Mexican (149 | 22.9%), Norwegian (145 | 22.3%), Swedish (122 | 18.7%), and American (117 | 18.0%), together accounting for 106.8% of all Startup residents.
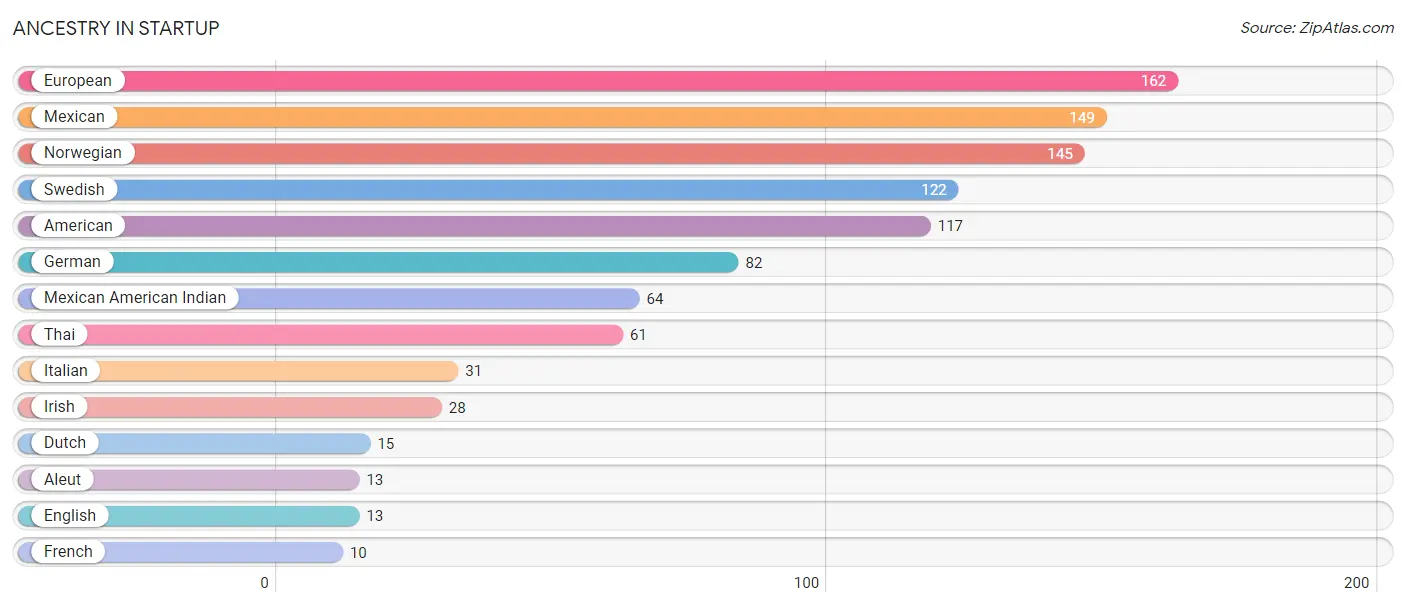
| Ancestry | # Population | % Population |
| Aleut | 13 | 2.0% |
| American | 117 | 18.0% |
| Dutch | 15 | 2.3% |
| English | 13 | 2.0% |
| European | 162 | 24.9% |
| French | 10 | 1.5% |
| German | 82 | 12.6% |
| Irish | 28 | 4.3% |
| Italian | 31 | 4.8% |
| Mexican | 149 | 22.9% |
| Mexican American Indian | 64 | 9.8% |
| Norwegian | 145 | 22.3% |
| Swedish | 122 | 18.7% |
| Thai | 61 | 9.4% | View All 14 Rows |
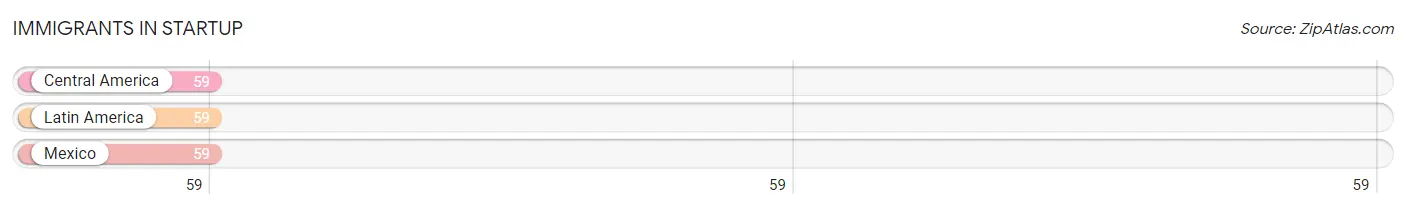
Immigrants in Startup
The most numerous immigrant groups reported in Startup came from Central America (59 | 9.1%), Latin America (59 | 9.1%), and Mexico (59 | 9.1%), together accounting for 27.2% of all Startup residents.
| Immigration Origin | # Population | % Population |
| Central America | 59 | 9.1% |
| Latin America | 59 | 9.1% |
| Mexico | 59 | 9.1% | View All 3 Rows |
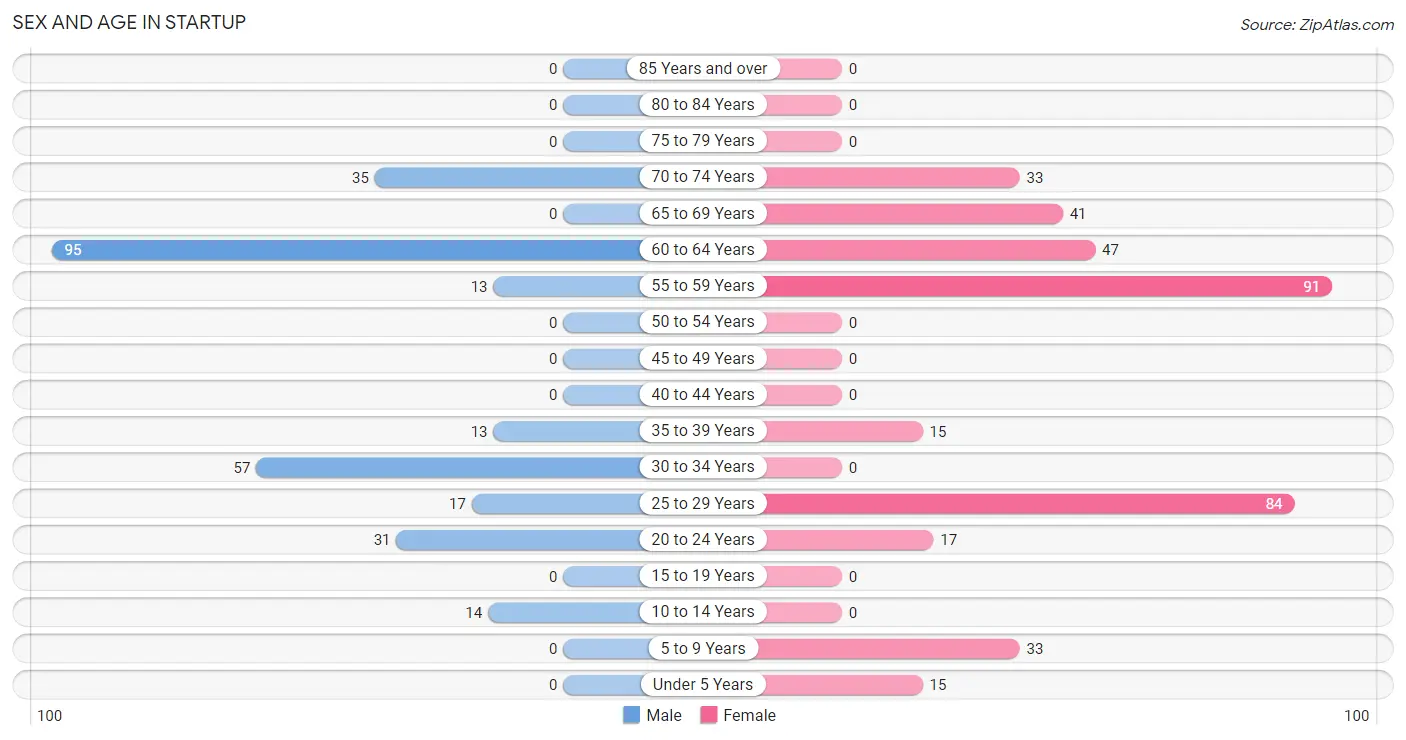
Sex and Age in Startup
Sex and Age in Startup
The most populous age groups in Startup are 60 to 64 Years (95 | 34.5%) for men and 55 to 59 Years (91 | 24.2%) for women.
| Age Bracket | Male | Female |
| Under 5 Years | 0 (0.0%) | 15 (4.0%) |
| 5 to 9 Years | 0 (0.0%) | 33 (8.8%) |
| 10 to 14 Years | 14 (5.1%) | 0 (0.0%) |
| 15 to 19 Years | 0 (0.0%) | 0 (0.0%) |
| 20 to 24 Years | 31 (11.3%) | 17 (4.5%) |
| 25 to 29 Years | 17 (6.2%) | 84 (22.3%) |
| 30 to 34 Years | 57 (20.7%) | 0 (0.0%) |
| 35 to 39 Years | 13 (4.7%) | 15 (4.0%) |
| 40 to 44 Years | 0 (0.0%) | 0 (0.0%) |
| 45 to 49 Years | 0 (0.0%) | 0 (0.0%) |
| 50 to 54 Years | 0 (0.0%) | 0 (0.0%) |
| 55 to 59 Years | 13 (4.7%) | 91 (24.2%) |
| 60 to 64 Years | 95 (34.5%) | 47 (12.5%) |
| 65 to 69 Years | 0 (0.0%) | 41 (10.9%) |
| 70 to 74 Years | 35 (12.7%) | 33 (8.8%) |
| 75 to 79 Years | 0 (0.0%) | 0 (0.0%) |
| 80 to 84 Years | 0 (0.0%) | 0 (0.0%) |
| 85 Years and over | 0 (0.0%) | 0 (0.0%) |
| Total | 275 (100.0%) | 376 (100.0%) |
Families and Households in Startup
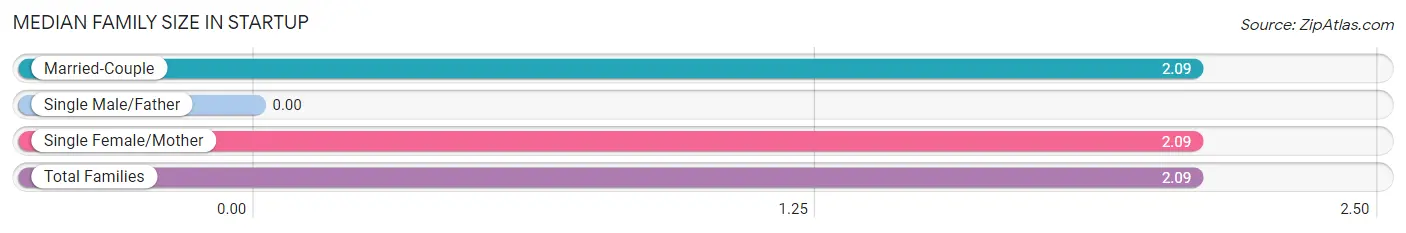
Median Family Size in Startup
| Family Type | # Families | Family Size |
| Married-Couple | 199 (82.2%) | 2.09 |
| Single Male/Father | 0 (0.0%) | - |
| Single Female/Mother | 43 (17.8%) | 2.09 |
| Total Families | 242 (100.0%) | 2.09 |
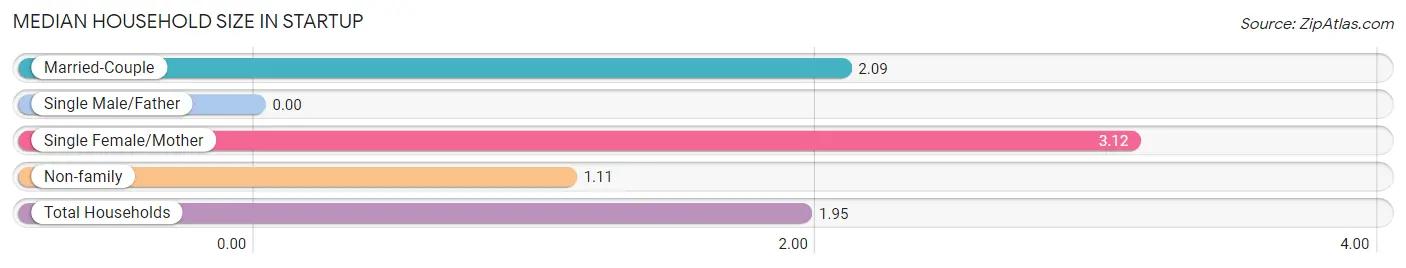
Median Household Size in Startup
| Household Type | # Households | Household Size |
| Married-Couple | 199 (59.8%) | 2.09 |
| Single Male/Father | 0 (0.0%) | - |
| Single Female/Mother | 43 (12.9%) | 3.12 |
| Non-family | 91 (27.3%) | 1.11 |
| Total Households | 333 (100.0%) | 1.95 |
Household Size by Marriage Status in Startup
Out of a total of 333 households in Startup, 242 (72.7%) are family households, while 91 (27.3%) are nonfamily households. The most numerous type of family households are 2-person households, comprising 182, and the most common type of nonfamily households are 1-person households, comprising 78.
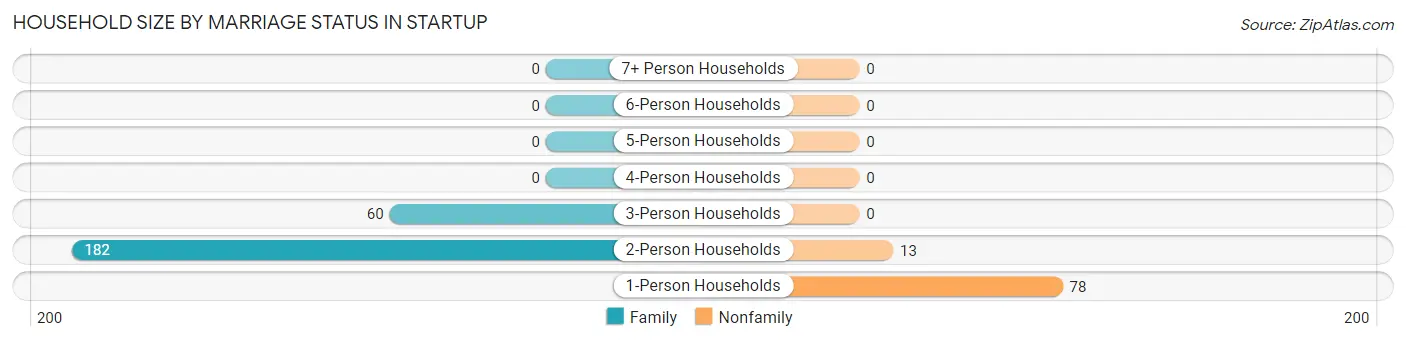
| Household Size | Family Households | Nonfamily Households |
| 1-Person Households | - | 78 (23.4%) |
| 2-Person Households | 182 (54.6%) | 13 (3.9%) |
| 3-Person Households | 60 (18.0%) | 0 (0.0%) |
| 4-Person Households | 0 (0.0%) | 0 (0.0%) |
| 5-Person Households | 0 (0.0%) | 0 (0.0%) |
| 6-Person Households | 0 (0.0%) | 0 (0.0%) |
| 7+ Person Households | 0 (0.0%) | 0 (0.0%) |
| Total | 242 (72.7%) | 91 (27.3%) |
Female Fertility in Startup
Fertility by Age in Startup
| Age Bracket | Women with Births | Births / 1,000 Women |
| 15 to 19 years | 0 (0.0%) | 0.0 |
| 20 to 34 years | 0 (0.0%) | 0.0 |
| 35 to 50 years | 0 (0.0%) | 0.0 |
| Total | 0 (0.0%) | 0.0 |
Fertility by Age by Marriage Status in Startup
| Age Bracket | Married | Unmarried |
| 15 to 19 years | 0 (0.0%) | 0 (0.0%) |
| 20 to 34 years | 0 (0.0%) | 0 (0.0%) |
| 35 to 50 years | 0 (0.0%) | 0 (0.0%) |
| Total | 0 (0.0%) | 0 (0.0%) |
Fertility by Education in Startup
| Educational Attainment | Women with Births | Births / 1,000 Women |
| Less than High School | 0 (0.0%) | 0.0 |
| High School Diploma | 0 (0.0%) | 0.0 |
| College or Associate's Degree | 0 (0.0%) | 0.0 |
| Bachelor's Degree | 0 (0.0%) | 0.0 |
| Graduate Degree | 0 (0.0%) | 0.0 |
| Total | 0 (0.0%) | 0.0 |
Fertility by Education by Marriage Status in Startup
| Educational Attainment | Married | Unmarried |
| Less than High School | 0 (0.0%) | 0 (0.0%) |
| High School Diploma | 0 (0.0%) | 0 (0.0%) |
| College or Associate's Degree | 0 (0.0%) | 0 (0.0%) |
| Bachelor's Degree | 0 (0.0%) | 0 (0.0%) |
| Graduate Degree | 0 (0.0%) | 0 (0.0%) |
| Total | 0 (0.0%) | 0 (0.0%) |
Employment Characteristics in Startup
Employment by Class of Employer in Startup
Among the 389 employed individuals in Startup, private company employees (297 | 76.3%), self-employed (not incorporated) (47 | 12.1%), and not-for-profit organizations (31 | 8.0%) make up the most common classes of employment.
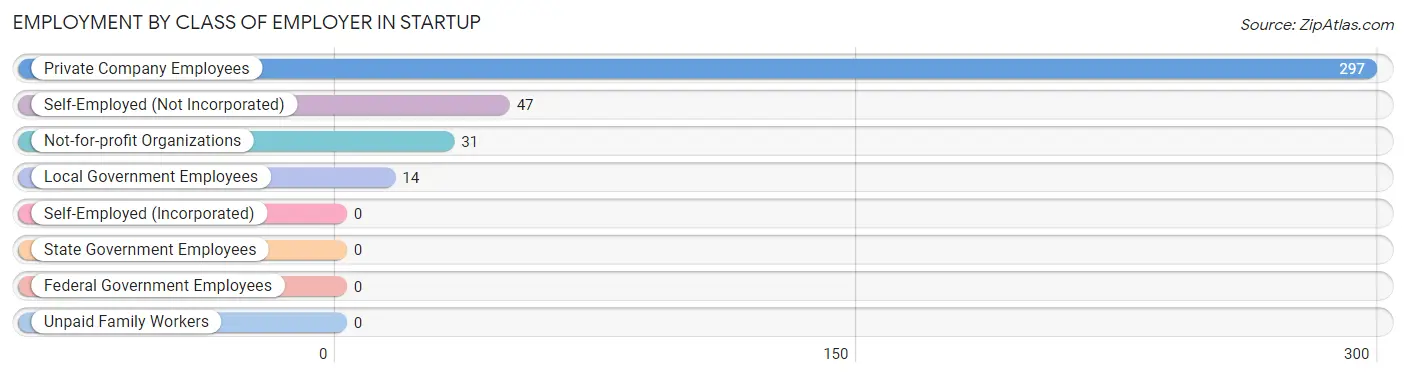
| Employer Class | # Employees | % Employees |
| Private Company Employees | 297 | 76.3% |
| Self-Employed (Incorporated) | 0 | 0.0% |
| Self-Employed (Not Incorporated) | 47 | 12.1% |
| Not-for-profit Organizations | 31 | 8.0% |
| Local Government Employees | 14 | 3.6% |
| State Government Employees | 0 | 0.0% |
| Federal Government Employees | 0 | 0.0% |
| Unpaid Family Workers | 0 | 0.0% |
| Total | 389 | 100.0% |
Employment Status by Age in Startup
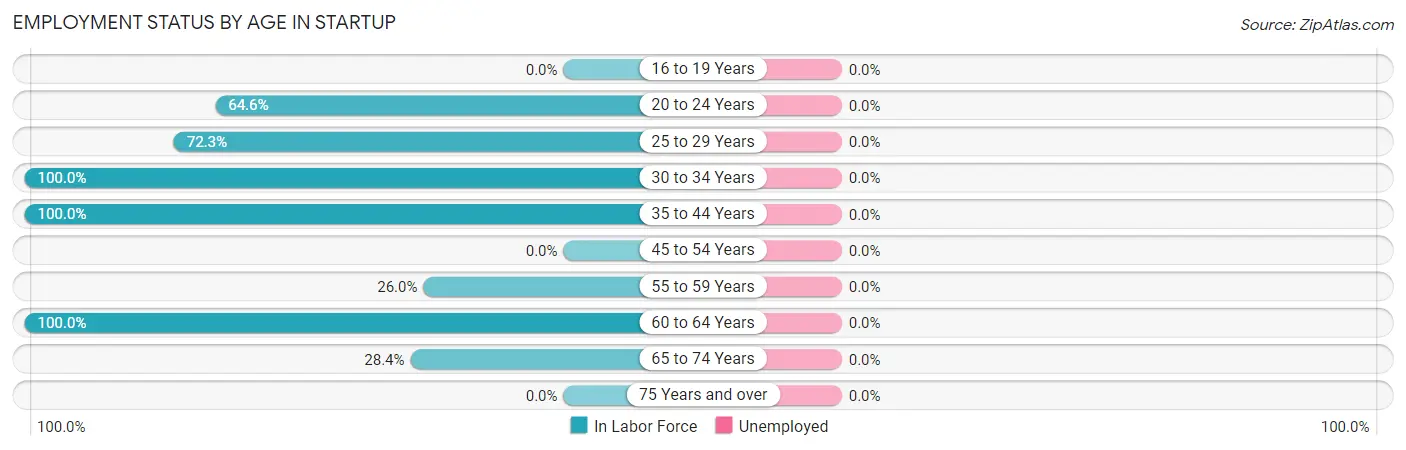
| Age Bracket | In Labor Force | Unemployed |
| 16 to 19 Years | 0 (0.0%) | 0 (0.0%) |
| 20 to 24 Years | 31 (64.6%) | 0 (0.0%) |
| 25 to 29 Years | 73 (72.3%) | 0 (0.0%) |
| 30 to 34 Years | 57 (100.0%) | 0 (0.0%) |
| 35 to 44 Years | 28 (100.0%) | 0 (0.0%) |
| 45 to 54 Years | 0 (0.0%) | 0 (0.0%) |
| 55 to 59 Years | 27 (26.0%) | 0 (0.0%) |
| 60 to 64 Years | 142 (100.0%) | 0 (0.0%) |
| 65 to 74 Years | 31 (28.4%) | 0 (0.0%) |
| 75 Years and over | 0 (0.0%) | 0 (0.0%) |
| Total | 389 (66.0%) | 0 (0.0%) |
Employment Status by Educational Attainment in Startup
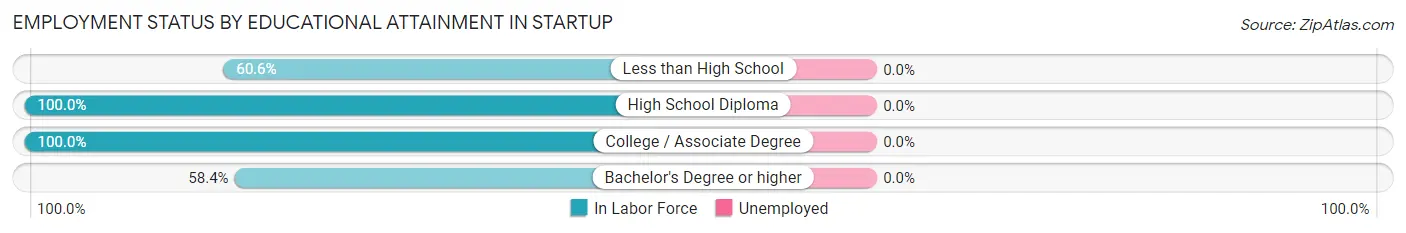
| Educational Attainment | In Labor Force | Unemployed |
| Less than High School | 43 (60.6%) | 0 (0.0%) |
| High School Diploma | 128 (100.0%) | 0 (0.0%) |
| College / Associate Degree | 48 (100.0%) | 0 (0.0%) |
| Bachelor's Degree or higher | 108 (58.4%) | 0 (0.0%) |
| Total | 327 (75.7%) | 0 (0.0%) |
Employment Occupations by Sex in Startup
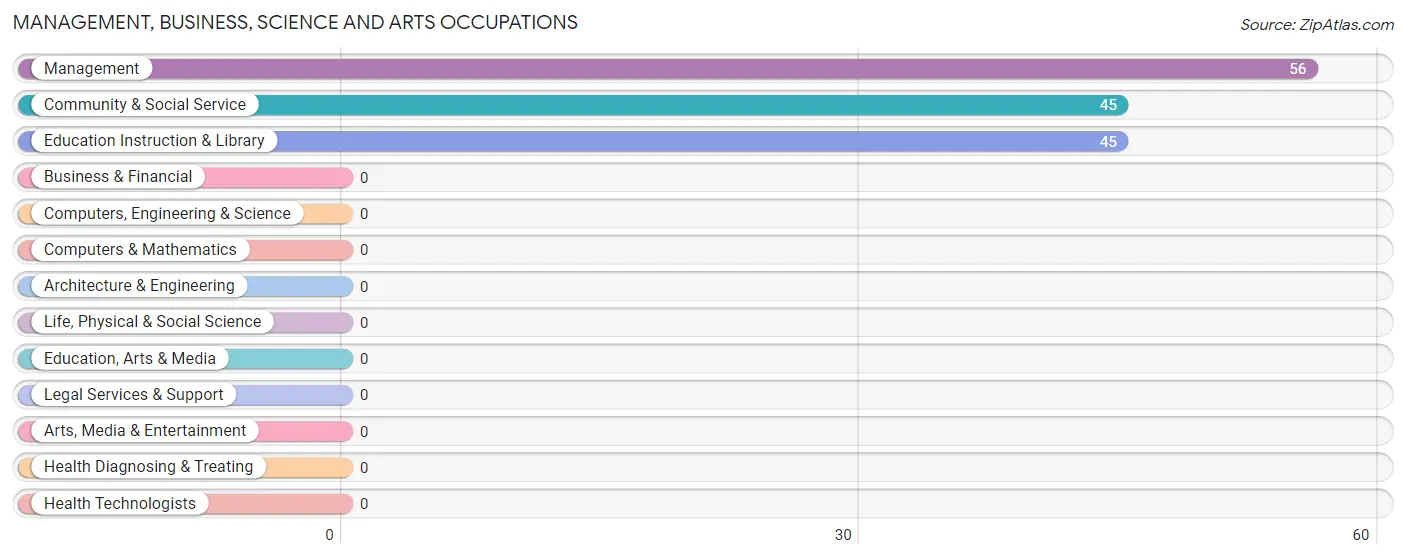
Management, Business, Science and Arts Occupations
The most common Management, Business, Science and Arts occupations in Startup are Management (56 | 14.4%), Community & Social Service (45 | 11.6%), and Education Instruction & Library (45 | 11.6%).
Management, Business, Science and Arts Occupations by Sex
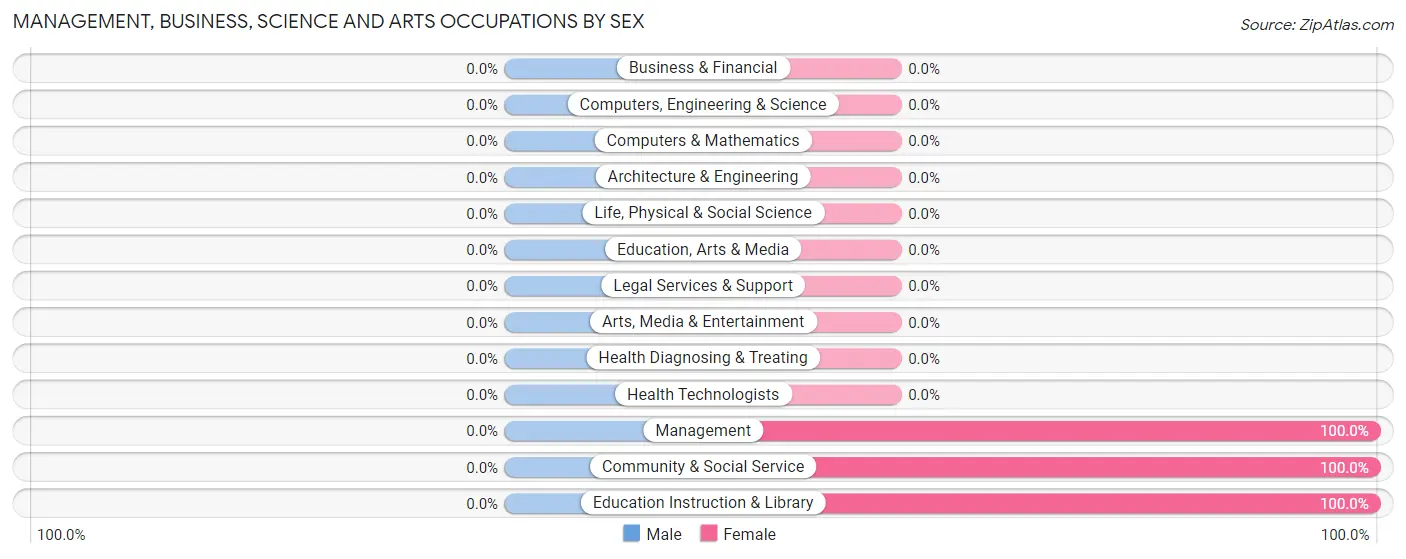
| Occupation | Male | Female |
| Management | 0 (0.0%) | 56 (100.0%) |
| Business & Financial | 0 (0.0%) | 0 (0.0%) |
| Computers, Engineering & Science | 0 (0.0%) | 0 (0.0%) |
| Computers & Mathematics | 0 (0.0%) | 0 (0.0%) |
| Architecture & Engineering | 0 (0.0%) | 0 (0.0%) |
| Life, Physical & Social Science | 0 (0.0%) | 0 (0.0%) |
| Community & Social Service | 0 (0.0%) | 45 (100.0%) |
| Education, Arts & Media | 0 (0.0%) | 0 (0.0%) |
| Legal Services & Support | 0 (0.0%) | 0 (0.0%) |
| Education Instruction & Library | 0 (0.0%) | 45 (100.0%) |
| Arts, Media & Entertainment | 0 (0.0%) | 0 (0.0%) |
| Health Diagnosing & Treating | 0 (0.0%) | 0 (0.0%) |
| Health Technologists | 0 (0.0%) | 0 (0.0%) |
| Total (Category) | 0 (0.0%) | 101 (100.0%) |
| Total (Overall) | 226 (58.1%) | 163 (41.9%) |
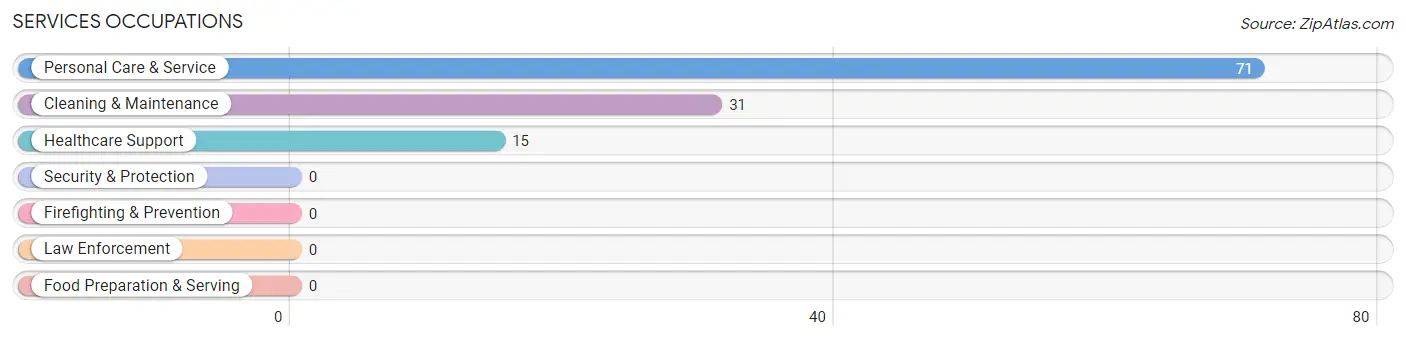
Services Occupations
The most common Services occupations in Startup are Personal Care & Service (71 | 18.2%), Cleaning & Maintenance (31 | 8.0%), and Healthcare Support (15 | 3.9%).
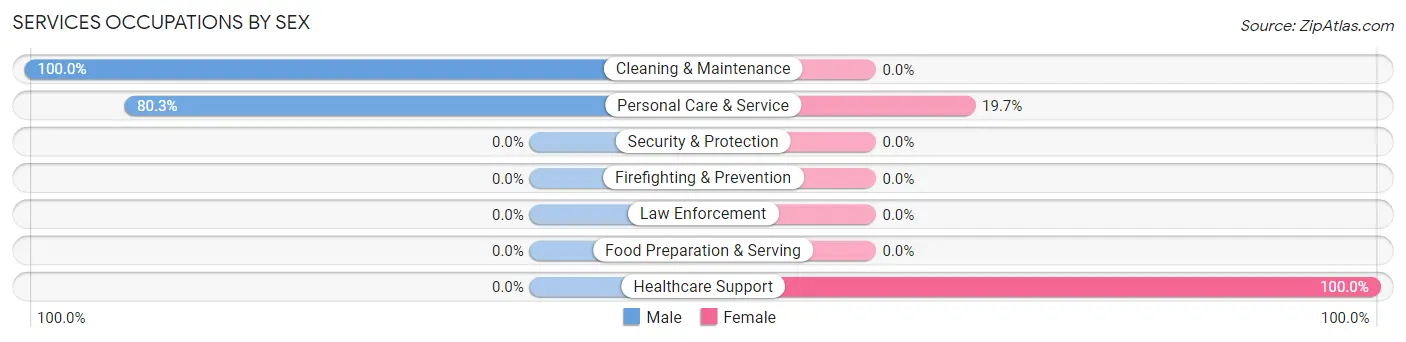
Services Occupations by Sex
Within the Services occupations in Startup, the most male-oriented occupations are Cleaning & Maintenance (100.0%), and Personal Care & Service (80.3%), while the most female-oriented occupations are Healthcare Support (100.0%), and Personal Care & Service (19.7%).
| Occupation | Male | Female |
| Healthcare Support | 0 (0.0%) | 15 (100.0%) |
| Security & Protection | 0 (0.0%) | 0 (0.0%) |
| Firefighting & Prevention | 0 (0.0%) | 0 (0.0%) |
| Law Enforcement | 0 (0.0%) | 0 (0.0%) |
| Food Preparation & Serving | 0 (0.0%) | 0 (0.0%) |
| Cleaning & Maintenance | 31 (100.0%) | 0 (0.0%) |
| Personal Care & Service | 57 (80.3%) | 14 (19.7%) |
| Total (Category) | 88 (75.2%) | 29 (24.8%) |
| Total (Overall) | 226 (58.1%) | 163 (41.9%) |
Sales and Office Occupations
The most common Sales and Office occupations in Startup are , and Sales & Related (33 | 8.5%).
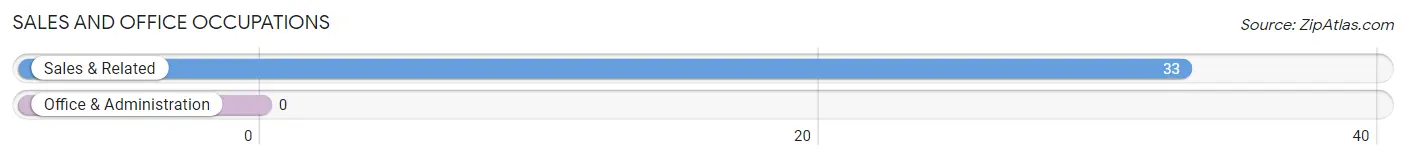
Sales and Office Occupations by Sex
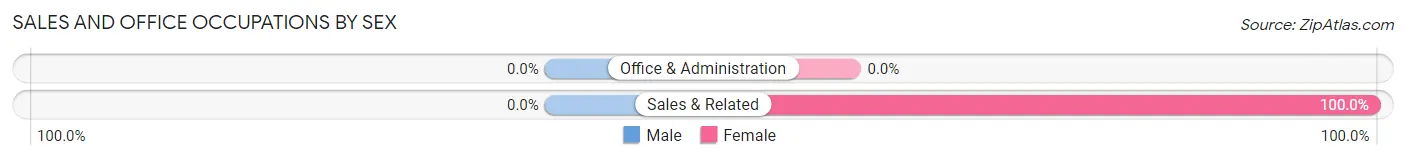
| Occupation | Male | Female |
| Sales & Related | 0 (0.0%) | 33 (100.0%) |
| Office & Administration | 0 (0.0%) | 0 (0.0%) |
| Total (Category) | 0 (0.0%) | 33 (100.0%) |
| Total (Overall) | 226 (58.1%) | 163 (41.9%) |
Natural Resources, Construction and Maintenance Occupations
The most common Natural Resources, Construction and Maintenance occupations in Startup are Construction & Extraction (30 | 7.7%), and Installation, Maintenance & Repair (15 | 3.9%).
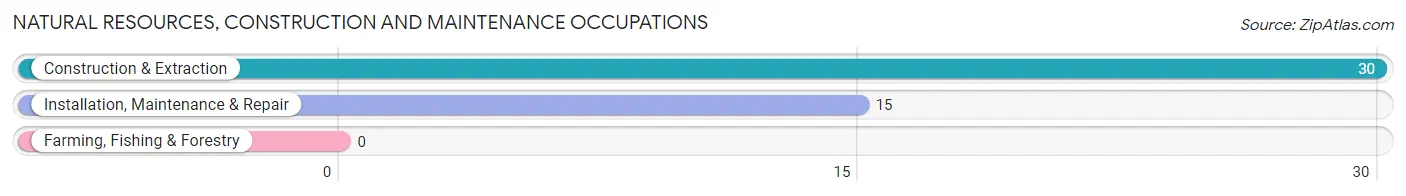
Natural Resources, Construction and Maintenance Occupations by Sex
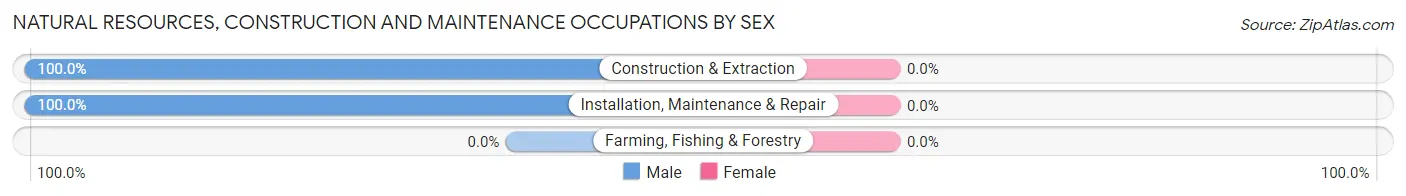
| Occupation | Male | Female |
| Farming, Fishing & Forestry | 0 (0.0%) | 0 (0.0%) |
| Construction & Extraction | 30 (100.0%) | 0 (0.0%) |
| Installation, Maintenance & Repair | 15 (100.0%) | 0 (0.0%) |
| Total (Category) | 45 (100.0%) | 0 (0.0%) |
| Total (Overall) | 226 (58.1%) | 163 (41.9%) |
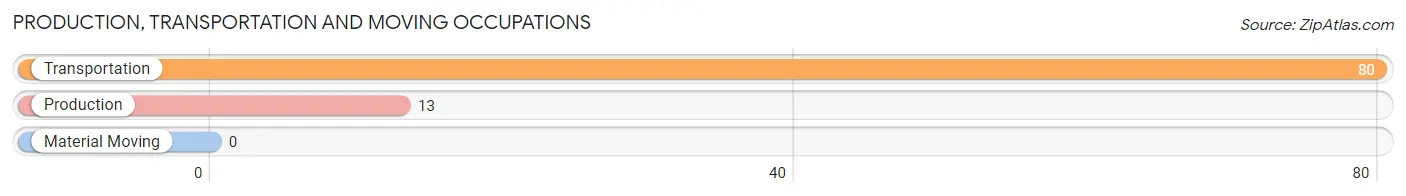
Production, Transportation and Moving Occupations
The most common Production, Transportation and Moving occupations in Startup are Transportation (80 | 20.6%), and Production (13 | 3.3%).
Production, Transportation and Moving Occupations by Sex
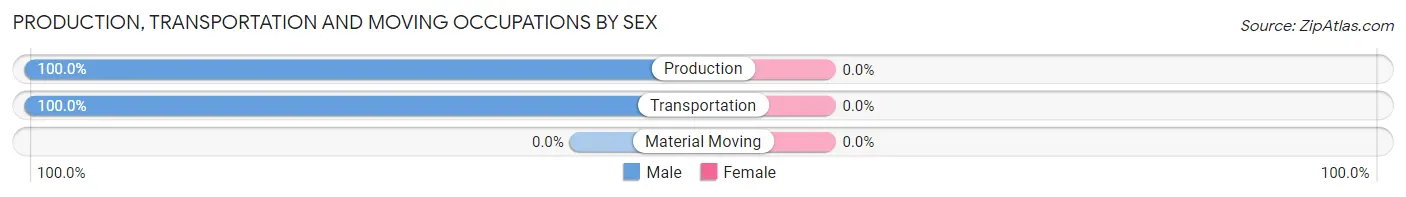
| Occupation | Male | Female |
| Production | 13 (100.0%) | 0 (0.0%) |
| Transportation | 80 (100.0%) | 0 (0.0%) |
| Material Moving | 0 (0.0%) | 0 (0.0%) |
| Total (Category) | 93 (100.0%) | 0 (0.0%) |
| Total (Overall) | 226 (58.1%) | 163 (41.9%) |
Employment Industries by Sex in Startup
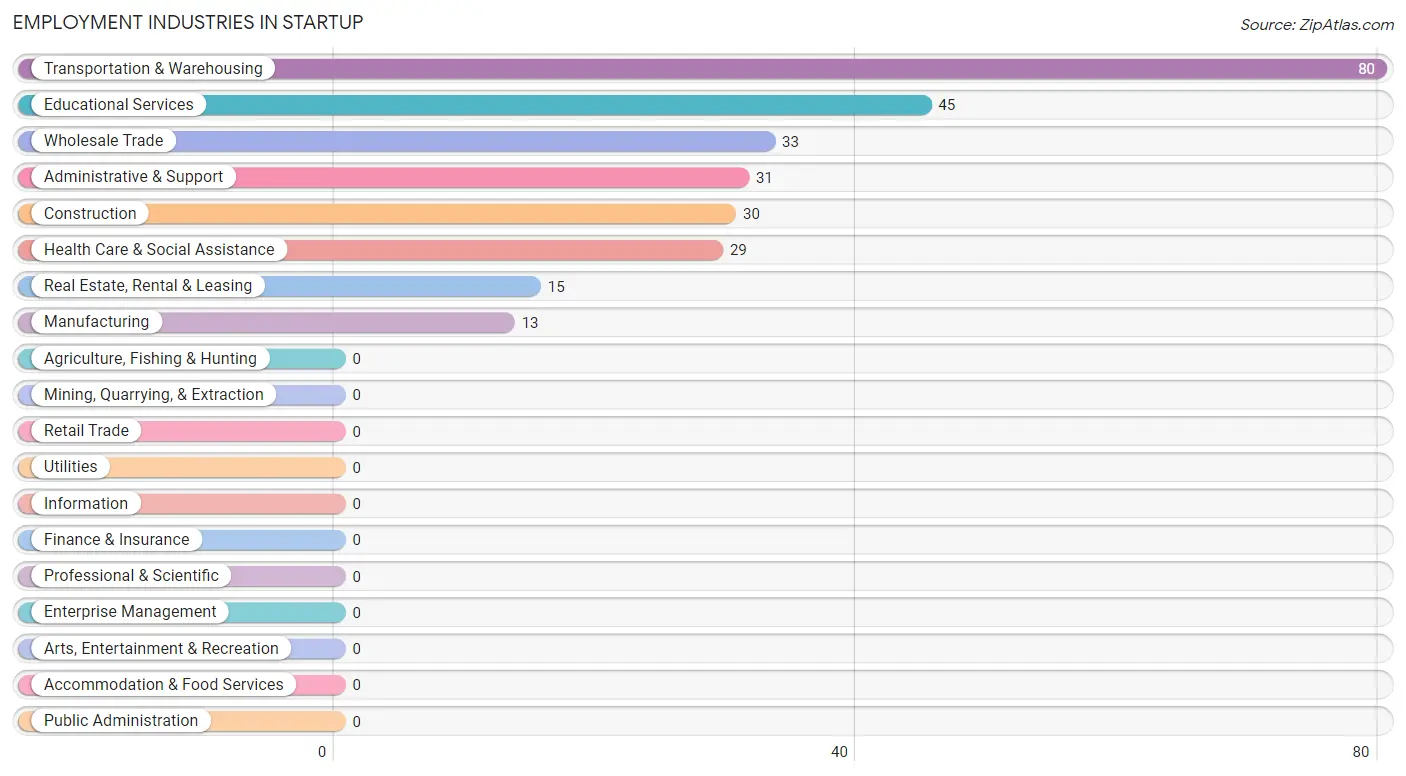
Employment Industries in Startup
The major employment industries in Startup include Transportation & Warehousing (80 | 20.6%), Educational Services (45 | 11.6%), Wholesale Trade (33 | 8.5%), Administrative & Support (31 | 8.0%), and Construction (30 | 7.7%).
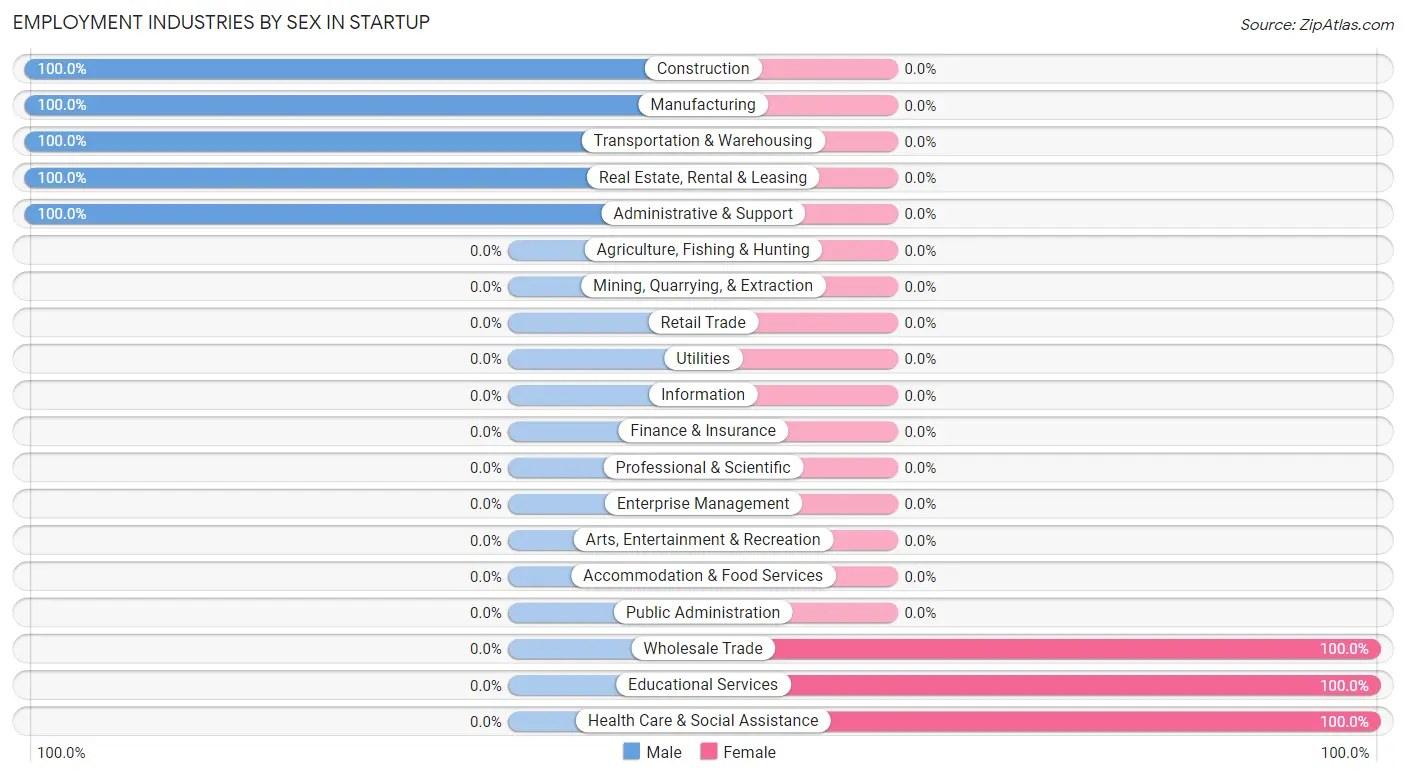
Employment Industries by Sex in Startup
The Startup industries that see more men than women are Construction (100.0%), Manufacturing (100.0%), and Transportation & Warehousing (100.0%), whereas the industries that tend to have a higher number of women are Wholesale Trade (100.0%), Educational Services (100.0%), and Health Care & Social Assistance (100.0%).
| Industry | Male | Female |
| Agriculture, Fishing & Hunting | 0 (0.0%) | 0 (0.0%) |
| Mining, Quarrying, & Extraction | 0 (0.0%) | 0 (0.0%) |
| Construction | 30 (100.0%) | 0 (0.0%) |
| Manufacturing | 13 (100.0%) | 0 (0.0%) |
| Wholesale Trade | 0 (0.0%) | 33 (100.0%) |
| Retail Trade | 0 (0.0%) | 0 (0.0%) |
| Transportation & Warehousing | 80 (100.0%) | 0 (0.0%) |
| Utilities | 0 (0.0%) | 0 (0.0%) |
| Information | 0 (0.0%) | 0 (0.0%) |
| Finance & Insurance | 0 (0.0%) | 0 (0.0%) |
| Real Estate, Rental & Leasing | 15 (100.0%) | 0 (0.0%) |
| Professional & Scientific | 0 (0.0%) | 0 (0.0%) |
| Enterprise Management | 0 (0.0%) | 0 (0.0%) |
| Administrative & Support | 31 (100.0%) | 0 (0.0%) |
| Educational Services | 0 (0.0%) | 45 (100.0%) |
| Health Care & Social Assistance | 0 (0.0%) | 29 (100.0%) |
| Arts, Entertainment & Recreation | 0 (0.0%) | 0 (0.0%) |
| Accommodation & Food Services | 0 (0.0%) | 0 (0.0%) |
| Public Administration | 0 (0.0%) | 0 (0.0%) |
| Total | 226 (58.1%) | 163 (41.9%) |
Education in Startup
School Enrollment in Startup
The most common levels of schooling among the 62 students in Startup are elementary school (33 | 53.2%), nursery / preschool (15 | 24.2%), and high school (14 | 22.6%).
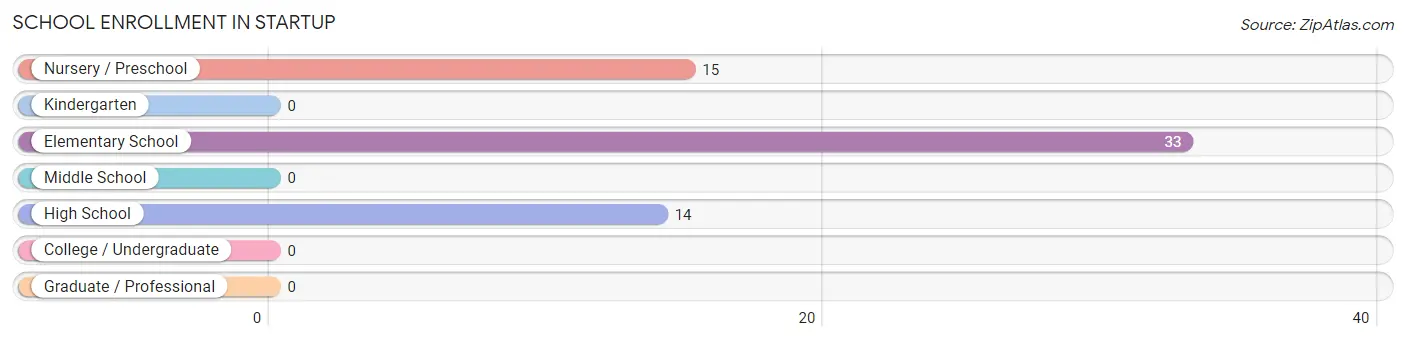
| School Level | # Students | % Students |
| Nursery / Preschool | 15 | 24.2% |
| Kindergarten | 0 | 0.0% |
| Elementary School | 33 | 53.2% |
| Middle School | 0 | 0.0% |
| High School | 14 | 22.6% |
| College / Undergraduate | 0 | 0.0% |
| Graduate / Professional | 0 | 0.0% |
| Total | 62 | 100.0% |
School Enrollment by Age by Funding Source in Startup
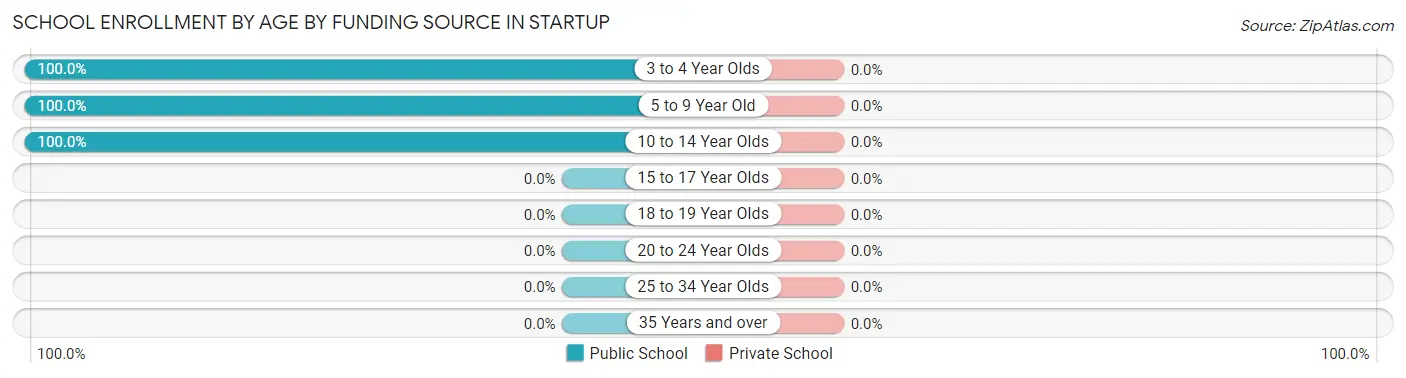
| Age Bracket | Public School | Private School |
| 3 to 4 Year Olds | 15 (100.0%) | 0 (0.0%) |
| 5 to 9 Year Old | 33 (100.0%) | 0 (0.0%) |
| 10 to 14 Year Olds | 14 (100.0%) | 0 (0.0%) |
| 15 to 17 Year Olds | 0 (0.0%) | 0 (0.0%) |
| 18 to 19 Year Olds | 0 (0.0%) | 0 (0.0%) |
| 20 to 24 Year Olds | 0 (0.0%) | 0 (0.0%) |
| 25 to 34 Year Olds | 0 (0.0%) | 0 (0.0%) |
| 35 Years and over | 0 (0.0%) | 0 (0.0%) |
| Total | 62 (100.0%) | 0 (0.0%) |
Educational Attainment by Field of Study in Startup
Business (80 | 34.8%), visual & performing arts (77 | 33.5%), education (45 | 19.6%), and arts & humanities (28 | 12.2%) are the most common fields of study among 230 individuals in Startup who have obtained a bachelor's degree or higher.
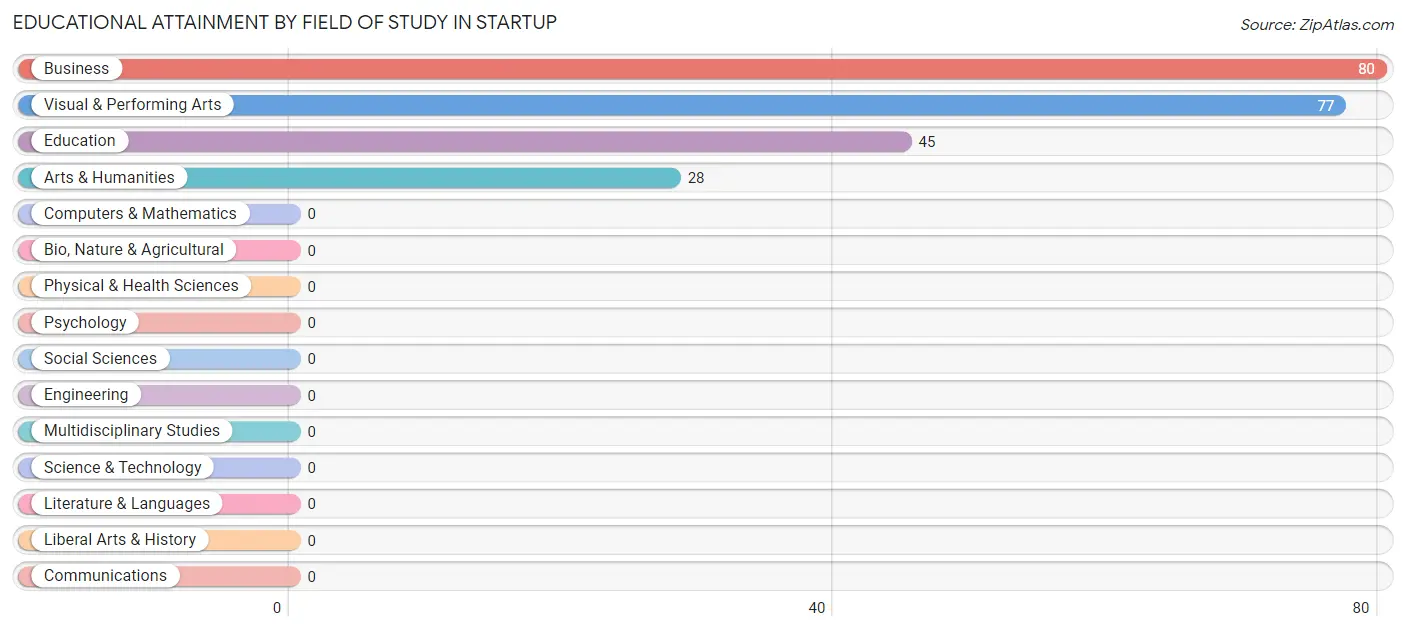
| Field of Study | # Graduates | % Graduates |
| Computers & Mathematics | 0 | 0.0% |
| Bio, Nature & Agricultural | 0 | 0.0% |
| Physical & Health Sciences | 0 | 0.0% |
| Psychology | 0 | 0.0% |
| Social Sciences | 0 | 0.0% |
| Engineering | 0 | 0.0% |
| Multidisciplinary Studies | 0 | 0.0% |
| Science & Technology | 0 | 0.0% |
| Business | 80 | 34.8% |
| Education | 45 | 19.6% |
| Literature & Languages | 0 | 0.0% |
| Liberal Arts & History | 0 | 0.0% |
| Visual & Performing Arts | 77 | 33.5% |
| Communications | 0 | 0.0% |
| Arts & Humanities | 28 | 12.2% |
| Total | 230 | 100.0% |
Transportation & Commute in Startup
Vehicle Availability by Sex in Startup
The most prevalent vehicle ownership categories in Startup are males with 2 vehicles (181, accounting for 80.1%) and females with 2 vehicles (104, making up 111.0%).
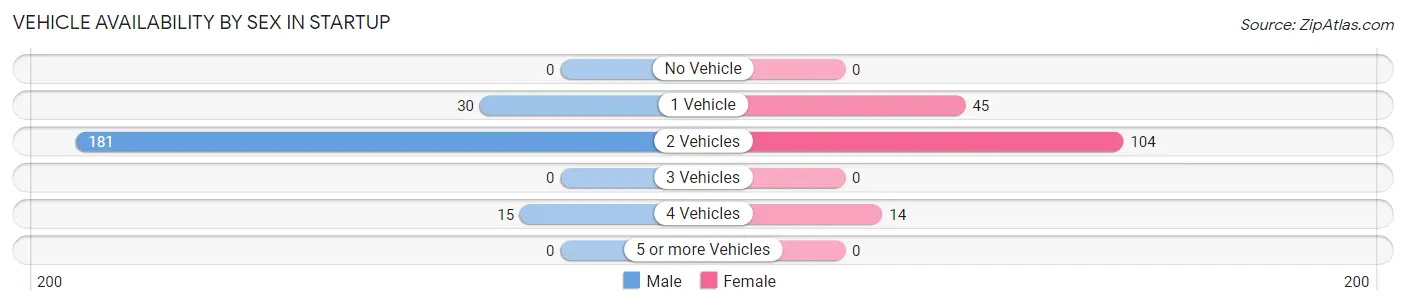
| Vehicles Available | Male | Female |
| No Vehicle | 0 (0.0%) | 0 (0.0%) |
| 1 Vehicle | 30 (13.3%) | 45 (27.6%) |
| 2 Vehicles | 181 (80.1%) | 104 (63.8%) |
| 3 Vehicles | 0 (0.0%) | 0 (0.0%) |
| 4 Vehicles | 15 (6.6%) | 14 (8.6%) |
| 5 or more Vehicles | 0 (0.0%) | 0 (0.0%) |
| Total | 226 (100.0%) | 163 (100.0%) |
Commute Time in Startup
The most frequently occuring commute durations in Startup are 35 to 39 minutes (113 commuters, 32.9%), 60 to 89 minutes (93 commuters, 27.0%), and less than 5 minutes (33 commuters, 9.6%).
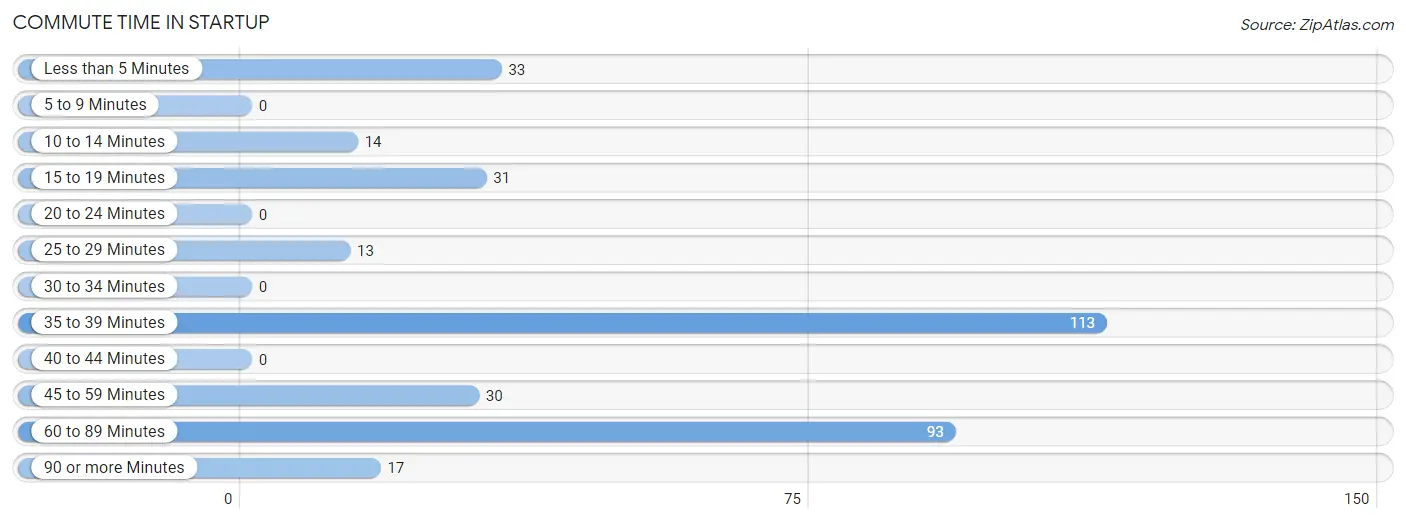
| Commute Time | # Commuters | % Commuters |
| Less than 5 Minutes | 33 | 9.6% |
| 5 to 9 Minutes | 0 | 0.0% |
| 10 to 14 Minutes | 14 | 4.1% |
| 15 to 19 Minutes | 31 | 9.0% |
| 20 to 24 Minutes | 0 | 0.0% |
| 25 to 29 Minutes | 13 | 3.8% |
| 30 to 34 Minutes | 0 | 0.0% |
| 35 to 39 Minutes | 113 | 32.9% |
| 40 to 44 Minutes | 0 | 0.0% |
| 45 to 59 Minutes | 30 | 8.7% |
| 60 to 89 Minutes | 93 | 27.0% |
| 90 or more Minutes | 17 | 4.9% |
Commute Time by Sex in Startup
The most common commute times in Startup are 60 to 89 minutes (93 commuters, 41.1%) for males and 35 to 39 minutes (56 commuters, 47.5%) for females.
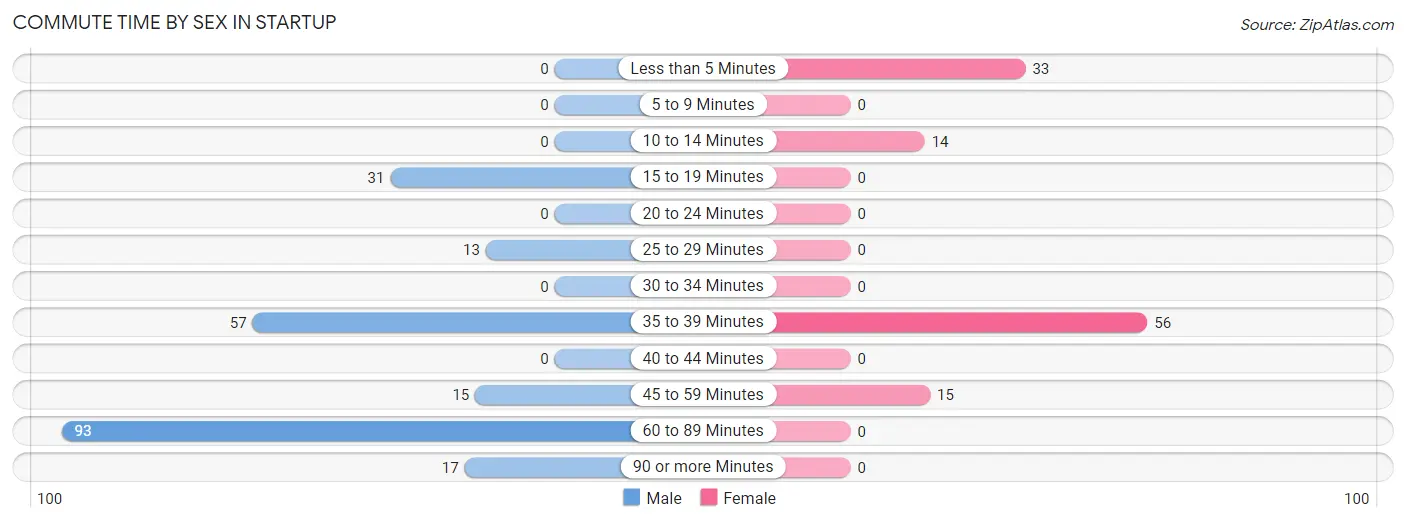
| Commute Time | Male | Female |
| Less than 5 Minutes | 0 (0.0%) | 33 (28.0%) |
| 5 to 9 Minutes | 0 (0.0%) | 0 (0.0%) |
| 10 to 14 Minutes | 0 (0.0%) | 14 (11.9%) |
| 15 to 19 Minutes | 31 (13.7%) | 0 (0.0%) |
| 20 to 24 Minutes | 0 (0.0%) | 0 (0.0%) |
| 25 to 29 Minutes | 13 (5.8%) | 0 (0.0%) |
| 30 to 34 Minutes | 0 (0.0%) | 0 (0.0%) |
| 35 to 39 Minutes | 57 (25.2%) | 56 (47.5%) |
| 40 to 44 Minutes | 0 (0.0%) | 0 (0.0%) |
| 45 to 59 Minutes | 15 (6.6%) | 15 (12.7%) |
| 60 to 89 Minutes | 93 (41.1%) | 0 (0.0%) |
| 90 or more Minutes | 17 (7.5%) | 0 (0.0%) |
Time of Departure to Work by Sex in Startup
The most frequent times of departure to work in Startup are 9:00 AM to 9:59 AM (80, 35.4%) for males and 6:00 AM to 6:29 AM (56, 47.5%) for females.
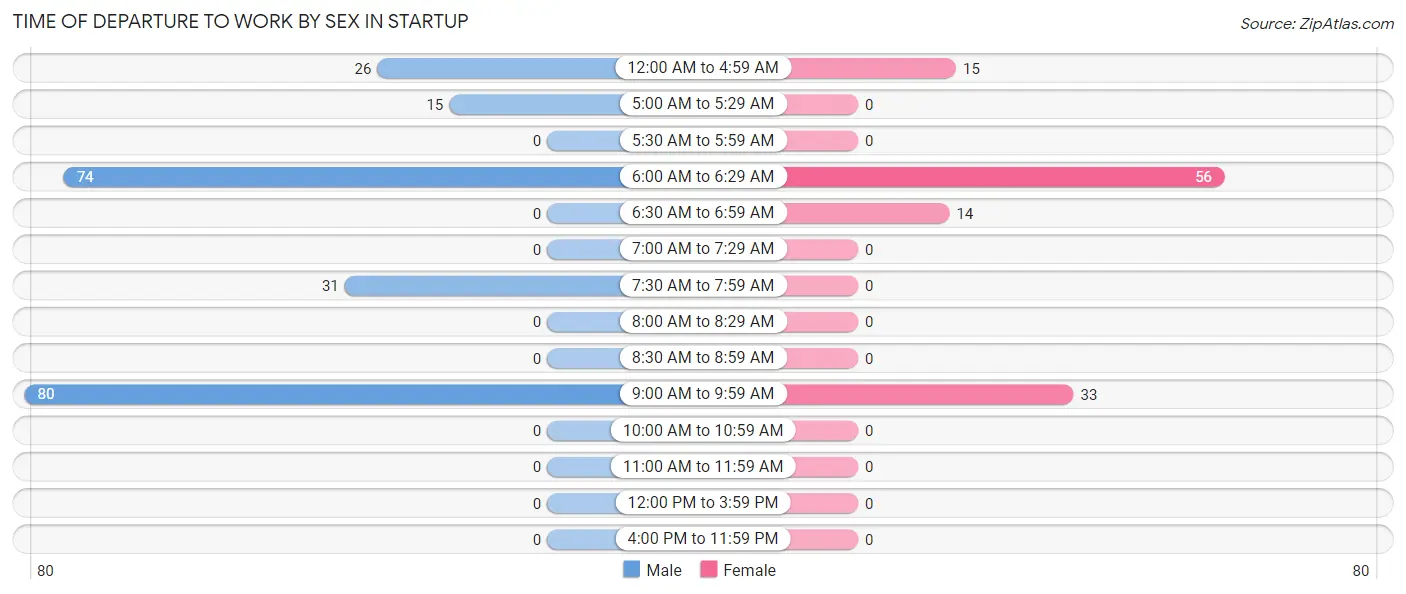
| Time of Departure | Male | Female |
| 12:00 AM to 4:59 AM | 26 (11.5%) | 15 (12.7%) |
| 5:00 AM to 5:29 AM | 15 (6.6%) | 0 (0.0%) |
| 5:30 AM to 5:59 AM | 0 (0.0%) | 0 (0.0%) |
| 6:00 AM to 6:29 AM | 74 (32.7%) | 56 (47.5%) |
| 6:30 AM to 6:59 AM | 0 (0.0%) | 14 (11.9%) |
| 7:00 AM to 7:29 AM | 0 (0.0%) | 0 (0.0%) |
| 7:30 AM to 7:59 AM | 31 (13.7%) | 0 (0.0%) |
| 8:00 AM to 8:29 AM | 0 (0.0%) | 0 (0.0%) |
| 8:30 AM to 8:59 AM | 0 (0.0%) | 0 (0.0%) |
| 9:00 AM to 9:59 AM | 80 (35.4%) | 33 (28.0%) |
| 10:00 AM to 10:59 AM | 0 (0.0%) | 0 (0.0%) |
| 11:00 AM to 11:59 AM | 0 (0.0%) | 0 (0.0%) |
| 12:00 PM to 3:59 PM | 0 (0.0%) | 0 (0.0%) |
| 4:00 PM to 11:59 PM | 0 (0.0%) | 0 (0.0%) |
| Total | 226 (100.0%) | 118 (100.0%) |
Housing Occupancy in Startup
Occupancy by Ownership in Startup
Of the total 333 dwellings in Startup, owner-occupied units account for 303 (91.0%), while renter-occupied units make up 30 (9.0%).
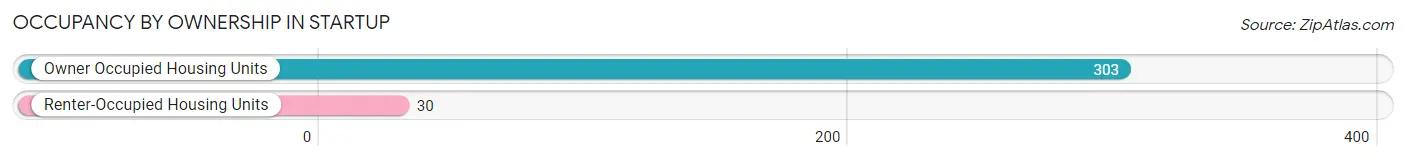
| Occupancy | # Housing Units | % Housing Units |
| Owner Occupied Housing Units | 303 | 91.0% |
| Renter-Occupied Housing Units | 30 | 9.0% |
| Total Occupied Housing Units | 333 | 100.0% |
Occupancy by Household Size in Startup
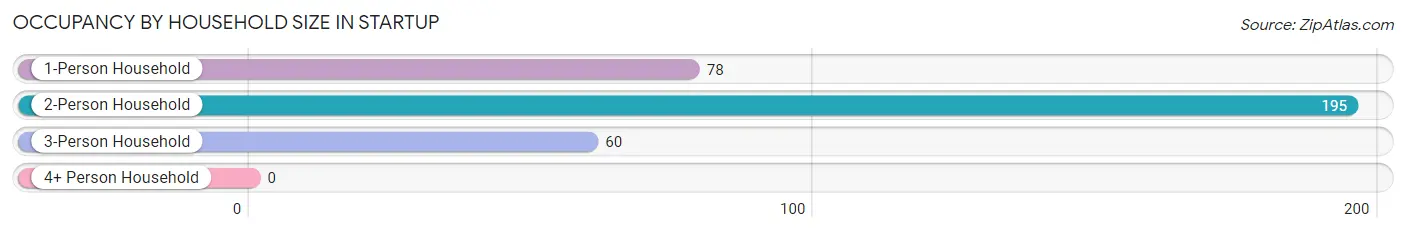
| Household Size | # Housing Units | % Housing Units |
| 1-Person Household | 78 | 23.4% |
| 2-Person Household | 195 | 58.6% |
| 3-Person Household | 60 | 18.0% |
| 4+ Person Household | 0 | 0.0% |
| Total Housing Units | 333 | 100.0% |
Occupancy by Ownership by Household Size in Startup
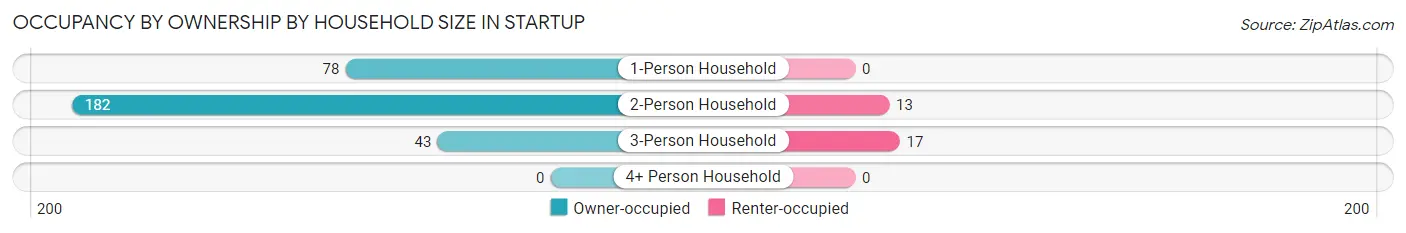
| Household Size | Owner-occupied | Renter-occupied |
| 1-Person Household | 78 (100.0%) | 0 (0.0%) |
| 2-Person Household | 182 (93.3%) | 13 (6.7%) |
| 3-Person Household | 43 (71.7%) | 17 (28.3%) |
| 4+ Person Household | 0 (0.0%) | 0 (0.0%) |
| Total Housing Units | 303 (91.0%) | 30 (9.0%) |
Occupancy by Educational Attainment in Startup
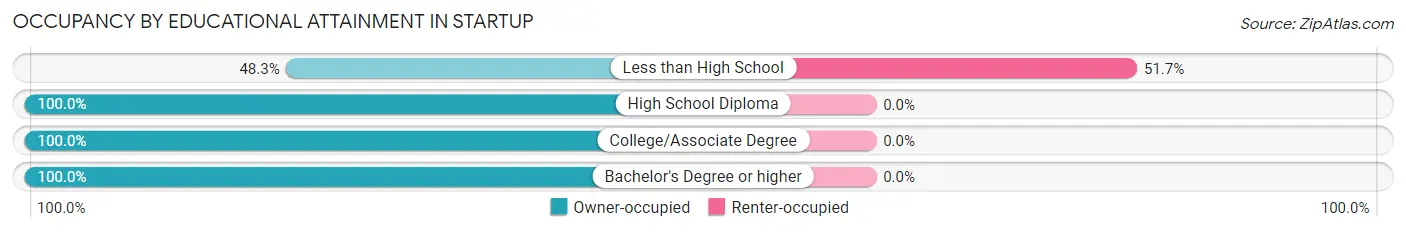
| Household Size | Owner-occupied | Renter-occupied |
| Less than High School | 28 (48.3%) | 30 (51.7%) |
| High School Diploma | 105 (100.0%) | 0 (0.0%) |
| College/Associate Degree | 48 (100.0%) | 0 (0.0%) |
| Bachelor's Degree or higher | 122 (100.0%) | 0 (0.0%) |
Occupancy by Age of Householder in Startup
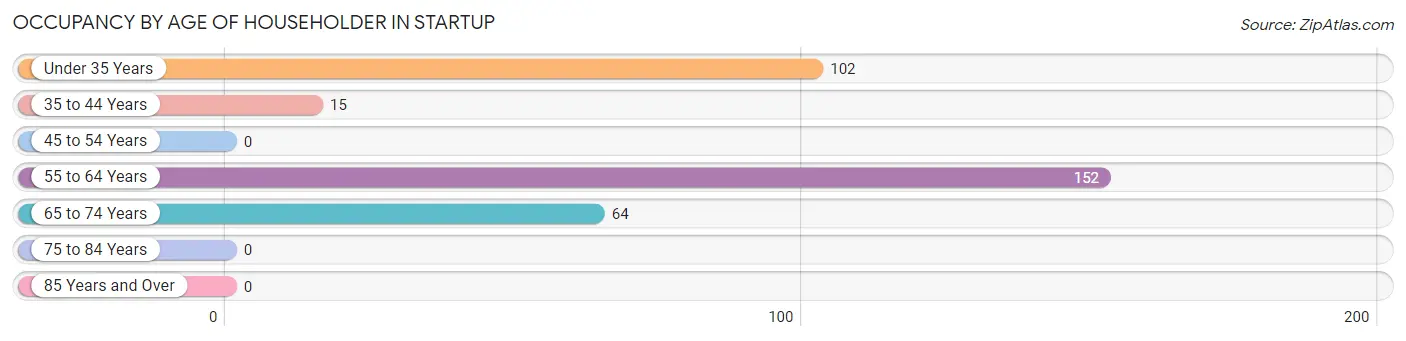
| Age Bracket | # Households | % Households |
| Under 35 Years | 102 | 30.6% |
| 35 to 44 Years | 15 | 4.5% |
| 45 to 54 Years | 0 | 0.0% |
| 55 to 64 Years | 152 | 45.7% |
| 65 to 74 Years | 64 | 19.2% |
| 75 to 84 Years | 0 | 0.0% |
| 85 Years and Over | 0 | 0.0% |
| Total | 333 | 100.0% |
Housing Finances in Startup
Median Income by Occupancy in Startup
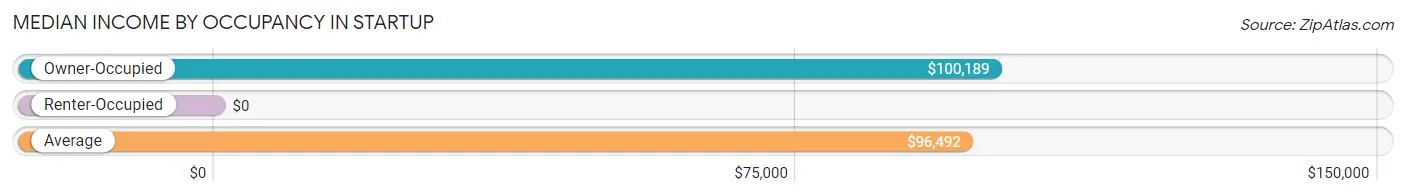
| Occupancy Type | # Households | Median Income |
| Owner-Occupied | 303 (91.0%) | $100,189 |
| Renter-Occupied | 30 (9.0%) | $0 |
| Average | 333 (100.0%) | $96,492 |
Occupancy by Householder Income Bracket in Startup
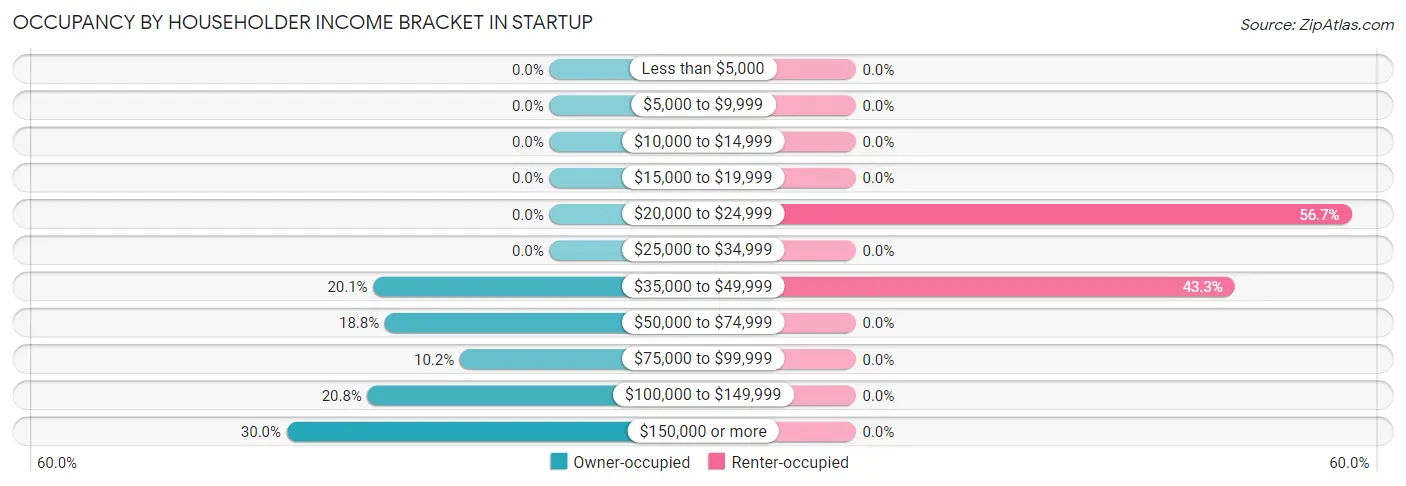
| Income Bracket | Owner-occupied | Renter-occupied |
| Less than $5,000 | 0 (0.0%) | 0 (0.0%) |
| $5,000 to $9,999 | 0 (0.0%) | 0 (0.0%) |
| $10,000 to $14,999 | 0 (0.0%) | 0 (0.0%) |
| $15,000 to $19,999 | 0 (0.0%) | 0 (0.0%) |
| $20,000 to $24,999 | 0 (0.0%) | 17 (56.7%) |
| $25,000 to $34,999 | 0 (0.0%) | 0 (0.0%) |
| $35,000 to $49,999 | 61 (20.1%) | 13 (43.3%) |
| $50,000 to $74,999 | 57 (18.8%) | 0 (0.0%) |
| $75,000 to $99,999 | 31 (10.2%) | 0 (0.0%) |
| $100,000 to $149,999 | 63 (20.8%) | 0 (0.0%) |
| $150,000 or more | 91 (30.0%) | 0 (0.0%) |
| Total | 303 (100.0%) | 30 (100.0%) |
Monthly Housing Cost Tiers in Startup
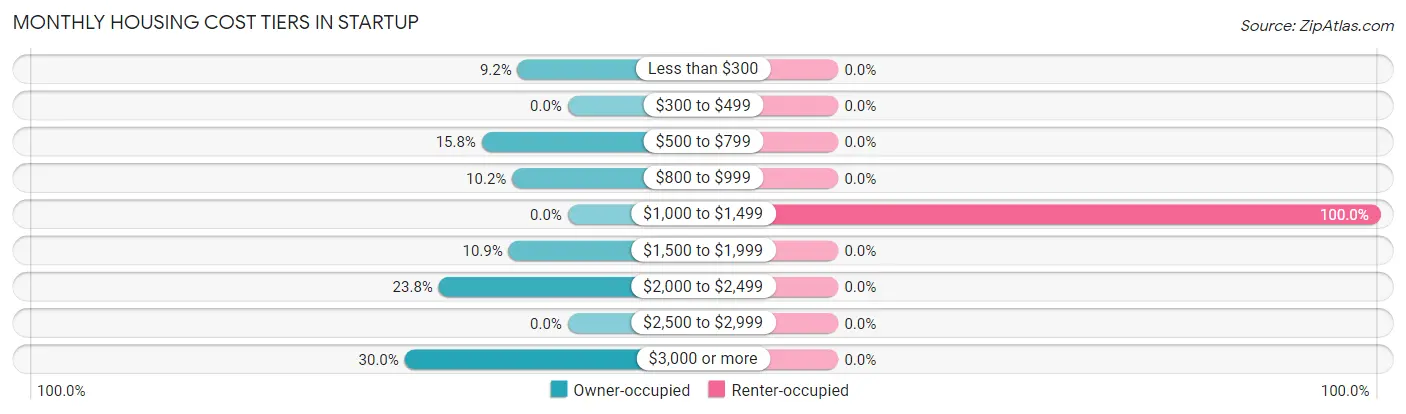
| Monthly Cost | Owner-occupied | Renter-occupied |
| Less than $300 | 28 (9.2%) | 0 (0.0%) |
| $300 to $499 | 0 (0.0%) | 0 (0.0%) |
| $500 to $799 | 48 (15.8%) | 0 (0.0%) |
| $800 to $999 | 31 (10.2%) | 0 (0.0%) |
| $1,000 to $1,499 | 0 (0.0%) | 30 (100.0%) |
| $1,500 to $1,999 | 33 (10.9%) | 0 (0.0%) |
| $2,000 to $2,499 | 72 (23.8%) | 0 (0.0%) |
| $2,500 to $2,999 | 0 (0.0%) | 0 (0.0%) |
| $3,000 or more | 91 (30.0%) | 0 (0.0%) |
| Total | 303 (100.0%) | 30 (100.0%) |
Physical Housing Characteristics in Startup
Housing Structures in Startup
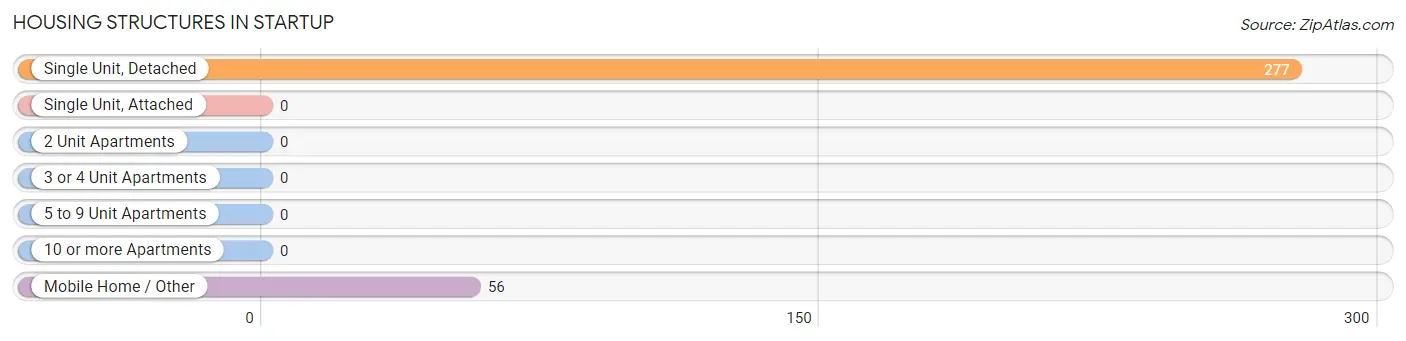
| Structure Type | # Housing Units | % Housing Units |
| Single Unit, Detached | 277 | 83.2% |
| Single Unit, Attached | 0 | 0.0% |
| 2 Unit Apartments | 0 | 0.0% |
| 3 or 4 Unit Apartments | 0 | 0.0% |
| 5 to 9 Unit Apartments | 0 | 0.0% |
| 10 or more Apartments | 0 | 0.0% |
| Mobile Home / Other | 56 | 16.8% |
| Total | 333 | 100.0% |
Housing Structures by Occupancy in Startup
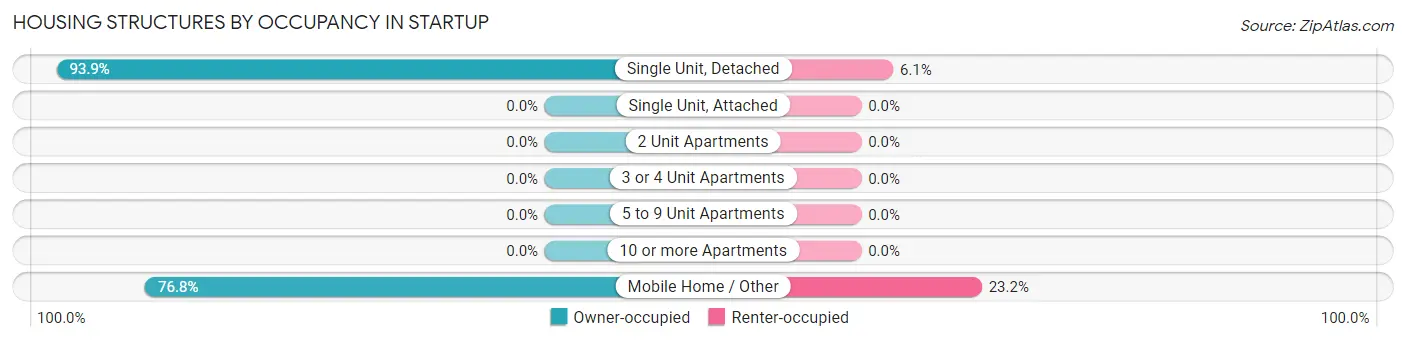
| Structure Type | Owner-occupied | Renter-occupied |
| Single Unit, Detached | 260 (93.9%) | 17 (6.1%) |
| Single Unit, Attached | 0 (0.0%) | 0 (0.0%) |
| 2 Unit Apartments | 0 (0.0%) | 0 (0.0%) |
| 3 or 4 Unit Apartments | 0 (0.0%) | 0 (0.0%) |
| 5 to 9 Unit Apartments | 0 (0.0%) | 0 (0.0%) |
| 10 or more Apartments | 0 (0.0%) | 0 (0.0%) |
| Mobile Home / Other | 43 (76.8%) | 13 (23.2%) |
| Total | 303 (91.0%) | 30 (9.0%) |
Housing Structures by Number of Rooms in Startup
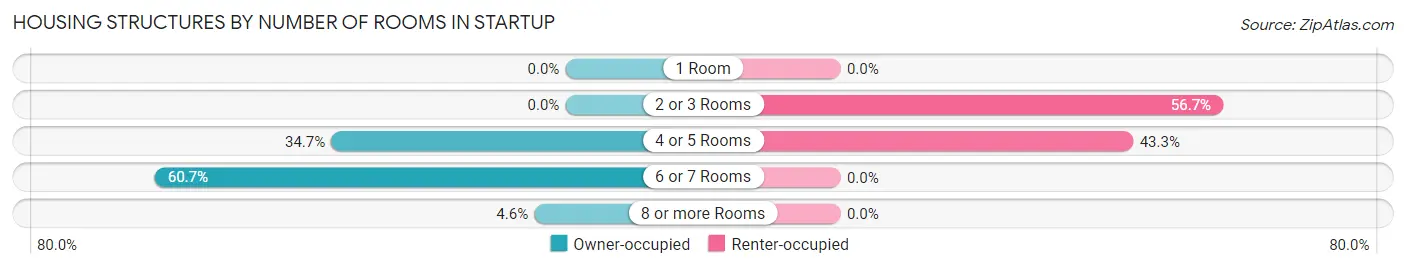
| Number of Rooms | Owner-occupied | Renter-occupied |
| 1 Room | 0 (0.0%) | 0 (0.0%) |
| 2 or 3 Rooms | 0 (0.0%) | 17 (56.7%) |
| 4 or 5 Rooms | 105 (34.6%) | 13 (43.3%) |
| 6 or 7 Rooms | 184 (60.7%) | 0 (0.0%) |
| 8 or more Rooms | 14 (4.6%) | 0 (0.0%) |
| Total | 303 (100.0%) | 30 (100.0%) |
Housing Structure by Heating Type in Startup
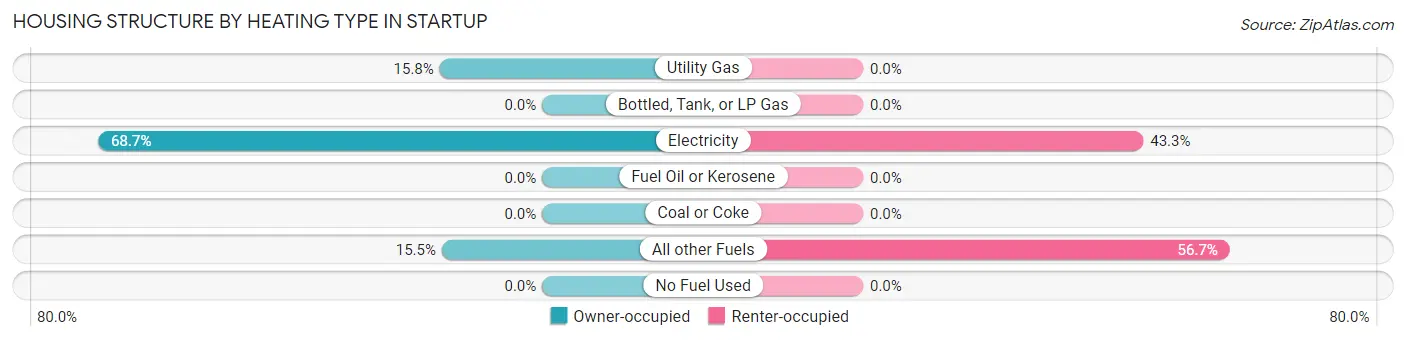
| Heating Type | Owner-occupied | Renter-occupied |
| Utility Gas | 48 (15.8%) | 0 (0.0%) |
| Bottled, Tank, or LP Gas | 0 (0.0%) | 0 (0.0%) |
| Electricity | 208 (68.6%) | 13 (43.3%) |
| Fuel Oil or Kerosene | 0 (0.0%) | 0 (0.0%) |
| Coal or Coke | 0 (0.0%) | 0 (0.0%) |
| All other Fuels | 47 (15.5%) | 17 (56.7%) |
| No Fuel Used | 0 (0.0%) | 0 (0.0%) |
| Total | 303 (100.0%) | 30 (100.0%) |
Household Vehicle Usage in Startup
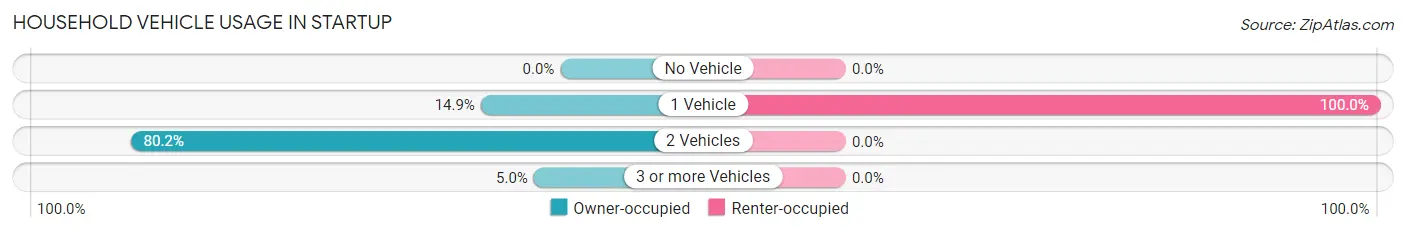
| Vehicles per Household | Owner-occupied | Renter-occupied |
| No Vehicle | 0 (0.0%) | 0 (0.0%) |
| 1 Vehicle | 45 (14.8%) | 30 (100.0%) |
| 2 Vehicles | 243 (80.2%) | 0 (0.0%) |
| 3 or more Vehicles | 15 (5.0%) | 0 (0.0%) |
| Total | 303 (100.0%) | 30 (100.0%) |
Real Estate & Mortgages in Startup
Real Estate and Mortgage Overview in Startup
| Characteristic | Without Mortgage | With Mortgage |
| Housing Units | 107 | 196 |
| Median Property Value | $331,800 | $0 |
| Median Household Income | - | - |
| Monthly Housing Costs | $553 | $91 |
| Real Estate Taxes | $3,742 | $0 |
Property Value by Mortgage Status in Startup
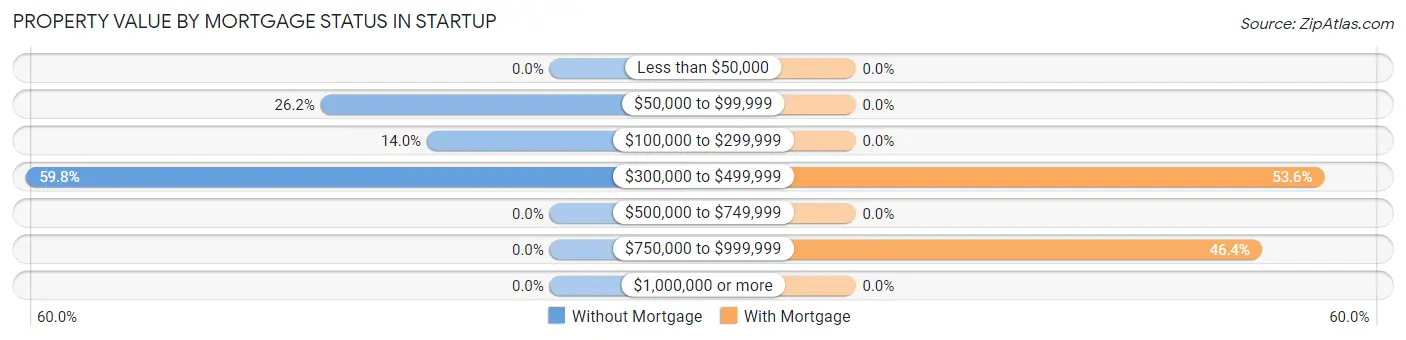
| Property Value | Without Mortgage | With Mortgage |
| Less than $50,000 | 0 (0.0%) | 0 (0.0%) |
| $50,000 to $99,999 | 28 (26.2%) | 0 (0.0%) |
| $100,000 to $299,999 | 15 (14.0%) | 0 (0.0%) |
| $300,000 to $499,999 | 64 (59.8%) | 105 (53.6%) |
| $500,000 to $749,999 | 0 (0.0%) | 0 (0.0%) |
| $750,000 to $999,999 | 0 (0.0%) | 91 (46.4%) |
| $1,000,000 or more | 0 (0.0%) | 0 (0.0%) |
| Total | 107 (100.0%) | 196 (100.0%) |
Household Income by Mortgage Status in Startup
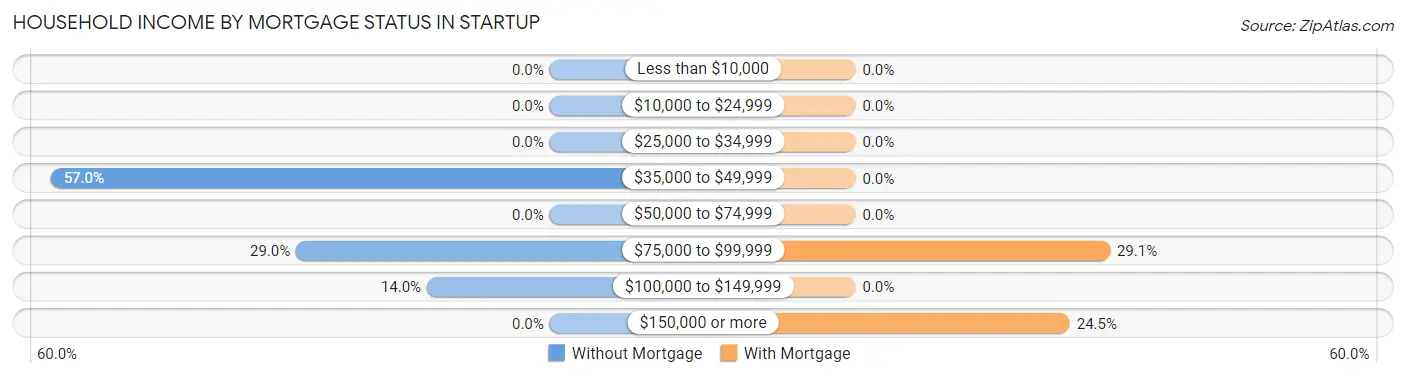
| Household Income | Without Mortgage | With Mortgage |
| Less than $10,000 | 0 (0.0%) | 0 (0.0%) |
| $10,000 to $24,999 | 0 (0.0%) | 0 (0.0%) |
| $25,000 to $34,999 | 0 (0.0%) | 0 (0.0%) |
| $35,000 to $49,999 | 61 (57.0%) | 0 (0.0%) |
| $50,000 to $74,999 | 0 (0.0%) | 0 (0.0%) |
| $75,000 to $99,999 | 31 (29.0%) | 57 (29.1%) |
| $100,000 to $149,999 | 15 (14.0%) | 0 (0.0%) |
| $150,000 or more | 0 (0.0%) | 48 (24.5%) |
| Total | 107 (100.0%) | 196 (100.0%) |
Property Value to Household Income Ratio in Startup
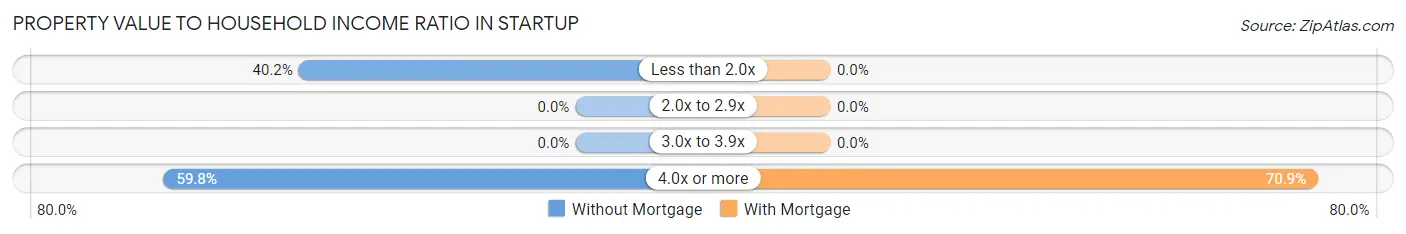
| Value-to-Income Ratio | Without Mortgage | With Mortgage |
| Less than 2.0x | 43 (40.2%) | 0 (0.0%) |
| 2.0x to 2.9x | 0 (0.0%) | 0 (0.0%) |
| 3.0x to 3.9x | 0 (0.0%) | 0 (0.0%) |
| 4.0x or more | 64 (59.8%) | 139 (70.9%) |
| Total | 107 (100.0%) | 196 (100.0%) |
Real Estate Taxes by Mortgage Status in Startup
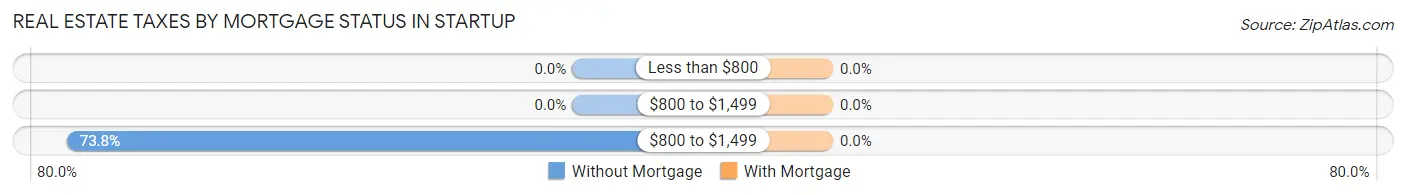
| Property Taxes | Without Mortgage | With Mortgage |
| Less than $800 | 0 (0.0%) | 0 (0.0%) |
| $800 to $1,499 | 0 (0.0%) | 0 (0.0%) |
| $800 to $1,499 | 79 (73.8%) | 0 (0.0%) |
| Total | 107 (100.0%) | 196 (100.0%) |
Health & Disability in Startup
Health Insurance Coverage by Age in Startup
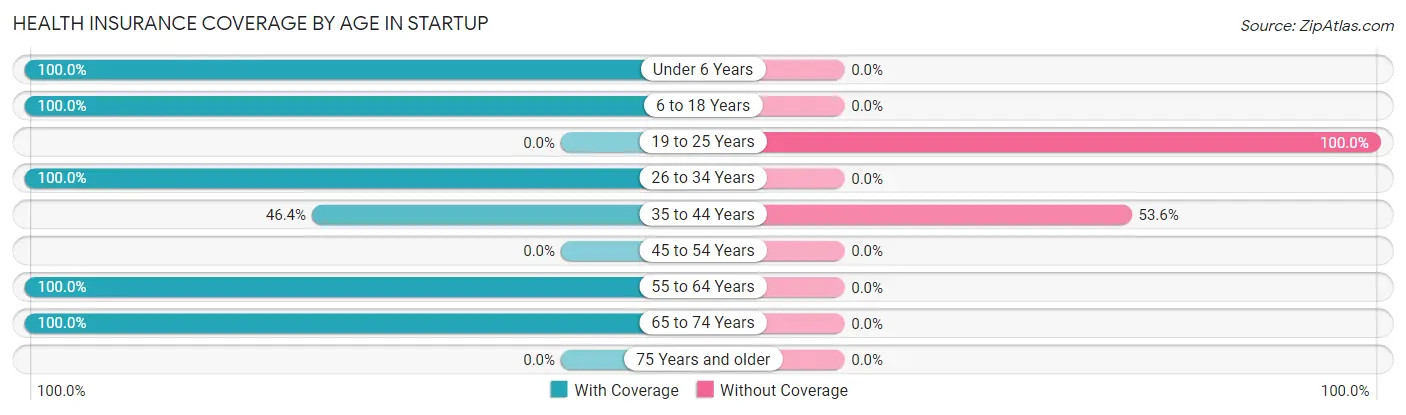
| Age Bracket | With Coverage | Without Coverage |
| Under 6 Years | 15 (100.0%) | 0 (0.0%) |
| 6 to 18 Years | 47 (100.0%) | 0 (0.0%) |
| 19 to 25 Years | 0 (0.0%) | 48 (100.0%) |
| 26 to 34 Years | 158 (100.0%) | 0 (0.0%) |
| 35 to 44 Years | 13 (46.4%) | 15 (53.6%) |
| 45 to 54 Years | 0 (0.0%) | 0 (0.0%) |
| 55 to 64 Years | 246 (100.0%) | 0 (0.0%) |
| 65 to 74 Years | 109 (100.0%) | 0 (0.0%) |
| 75 Years and older | 0 (0.0%) | 0 (0.0%) |
| Total | 588 (90.3%) | 63 (9.7%) |
Health Insurance Coverage by Citizenship Status in Startup
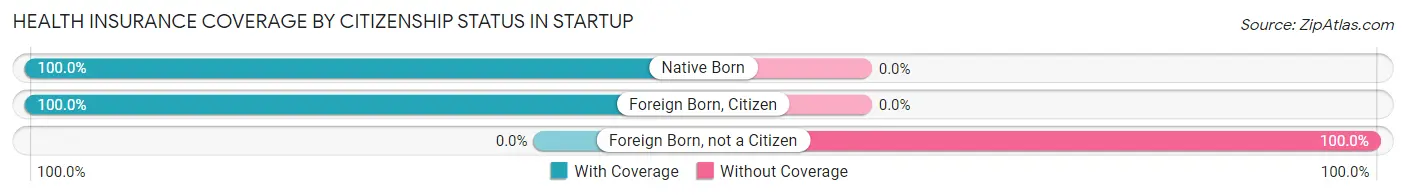
| Citizenship Status | With Coverage | Without Coverage |
| Native Born | 15 (100.0%) | 0 (0.0%) |
| Foreign Born, Citizen | 47 (100.0%) | 0 (0.0%) |
| Foreign Born, not a Citizen | 0 (0.0%) | 48 (100.0%) |
Health Insurance Coverage by Household Income in Startup
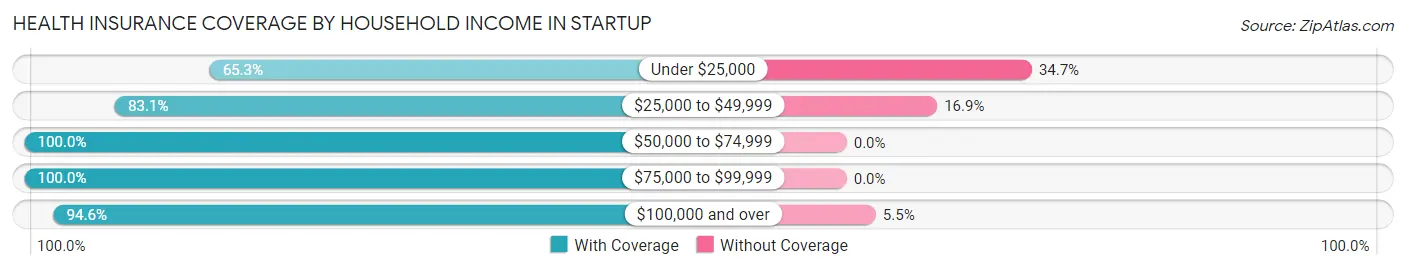
| Household Income | With Coverage | Without Coverage |
| Under $25,000 | 32 (65.3%) | 17 (34.7%) |
| $25,000 to $49,999 | 152 (83.1%) | 31 (16.9%) |
| $50,000 to $74,999 | 113 (100.0%) | 0 (0.0%) |
| $75,000 to $99,999 | 31 (100.0%) | 0 (0.0%) |
| $100,000 and over | 260 (94.6%) | 15 (5.4%) |
Public vs Private Health Insurance Coverage by Age in Startup
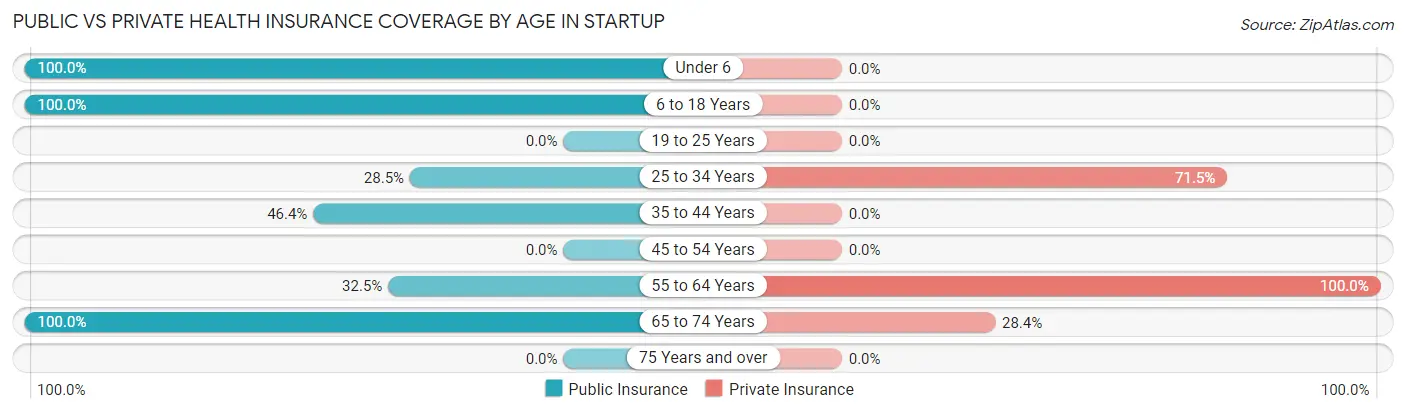
| Age Bracket | Public Insurance | Private Insurance |
| Under 6 | 15 (100.0%) | 0 (0.0%) |
| 6 to 18 Years | 47 (100.0%) | 0 (0.0%) |
| 19 to 25 Years | 0 (0.0%) | 0 (0.0%) |
| 25 to 34 Years | 45 (28.5%) | 113 (71.5%) |
| 35 to 44 Years | 13 (46.4%) | 0 (0.0%) |
| 45 to 54 Years | 0 (0.0%) | 0 (0.0%) |
| 55 to 64 Years | 80 (32.5%) | 246 (100.0%) |
| 65 to 74 Years | 109 (100.0%) | 31 (28.4%) |
| 75 Years and over | 0 (0.0%) | 0 (0.0%) |
| Total | 309 (47.5%) | 390 (59.9%) |
Disability Status by Sex by Age in Startup
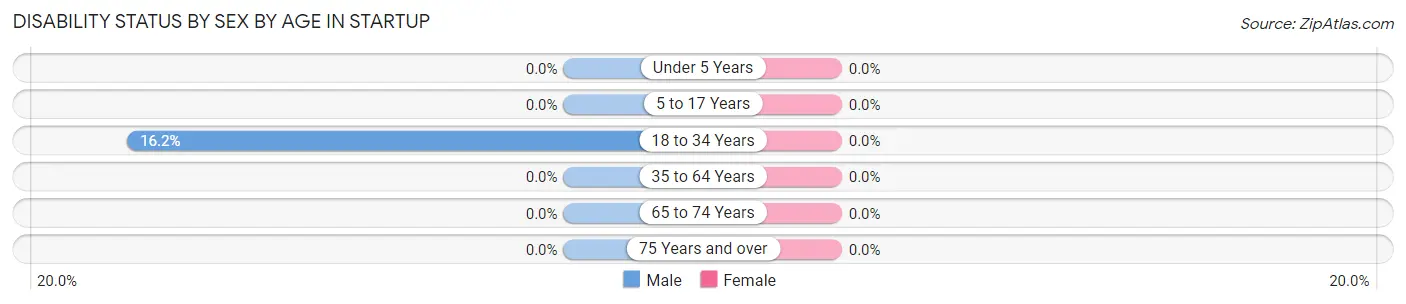
| Age Bracket | Male | Female |
| Under 5 Years | 0 (0.0%) | 0 (0.0%) |
| 5 to 17 Years | 0 (0.0%) | 0 (0.0%) |
| 18 to 34 Years | 17 (16.2%) | 0 (0.0%) |
| 35 to 64 Years | 0 (0.0%) | 0 (0.0%) |
| 65 to 74 Years | 0 (0.0%) | 0 (0.0%) |
| 75 Years and over | 0 (0.0%) | 0 (0.0%) |
Disability Class by Sex by Age in Startup
Disability Class: Hearing Difficulty
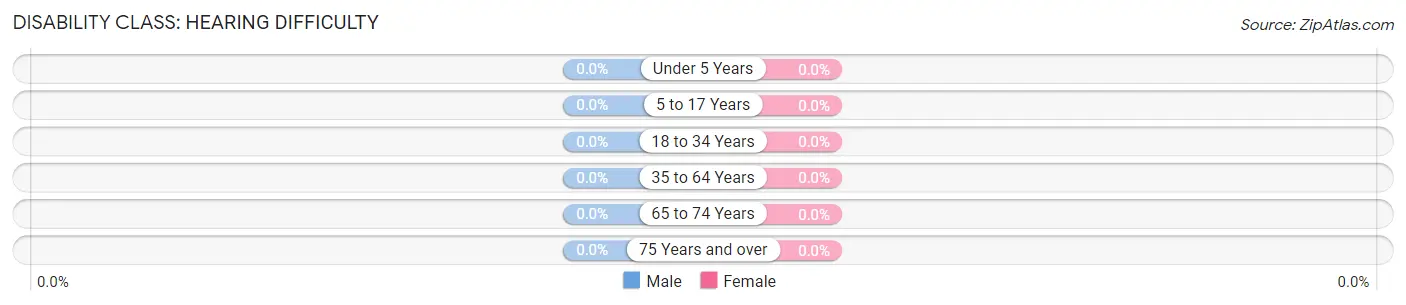
| Age Bracket | Male | Female |
| Under 5 Years | 0 (0.0%) | 0 (0.0%) |
| 5 to 17 Years | 0 (0.0%) | 0 (0.0%) |
| 18 to 34 Years | 0 (0.0%) | 0 (0.0%) |
| 35 to 64 Years | 0 (0.0%) | 0 (0.0%) |
| 65 to 74 Years | 0 (0.0%) | 0 (0.0%) |
| 75 Years and over | 0 (0.0%) | 0 (0.0%) |
Disability Class: Vision Difficulty
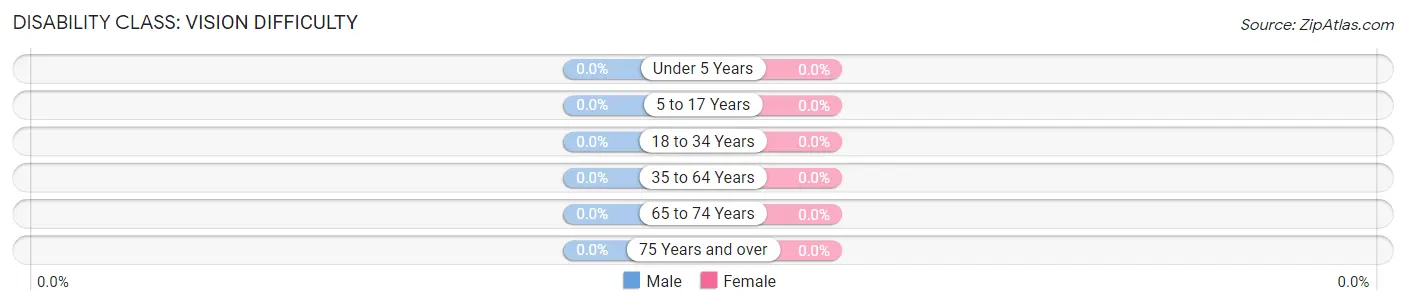
| Age Bracket | Male | Female |
| Under 5 Years | 0 (0.0%) | 0 (0.0%) |
| 5 to 17 Years | 0 (0.0%) | 0 (0.0%) |
| 18 to 34 Years | 0 (0.0%) | 0 (0.0%) |
| 35 to 64 Years | 0 (0.0%) | 0 (0.0%) |
| 65 to 74 Years | 0 (0.0%) | 0 (0.0%) |
| 75 Years and over | 0 (0.0%) | 0 (0.0%) |
Disability Class: Cognitive Difficulty
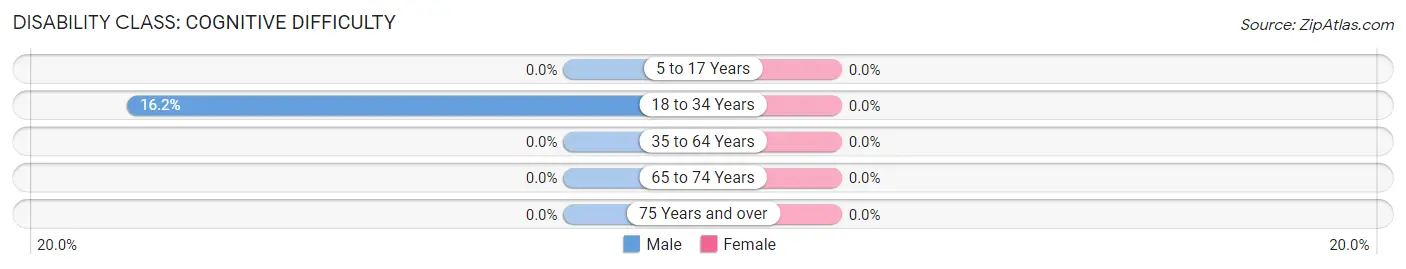
| Age Bracket | Male | Female |
| 5 to 17 Years | 0 (0.0%) | 0 (0.0%) |
| 18 to 34 Years | 17 (16.2%) | 0 (0.0%) |
| 35 to 64 Years | 0 (0.0%) | 0 (0.0%) |
| 65 to 74 Years | 0 (0.0%) | 0 (0.0%) |
| 75 Years and over | 0 (0.0%) | 0 (0.0%) |
Disability Class: Ambulatory Difficulty
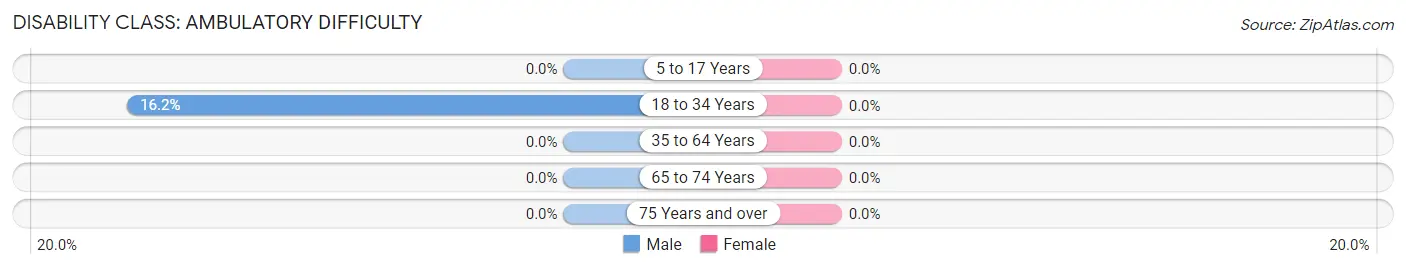
| Age Bracket | Male | Female |
| 5 to 17 Years | 0 (0.0%) | 0 (0.0%) |
| 18 to 34 Years | 17 (16.2%) | 0 (0.0%) |
| 35 to 64 Years | 0 (0.0%) | 0 (0.0%) |
| 65 to 74 Years | 0 (0.0%) | 0 (0.0%) |
| 75 Years and over | 0 (0.0%) | 0 (0.0%) |
Disability Class: Self-Care Difficulty
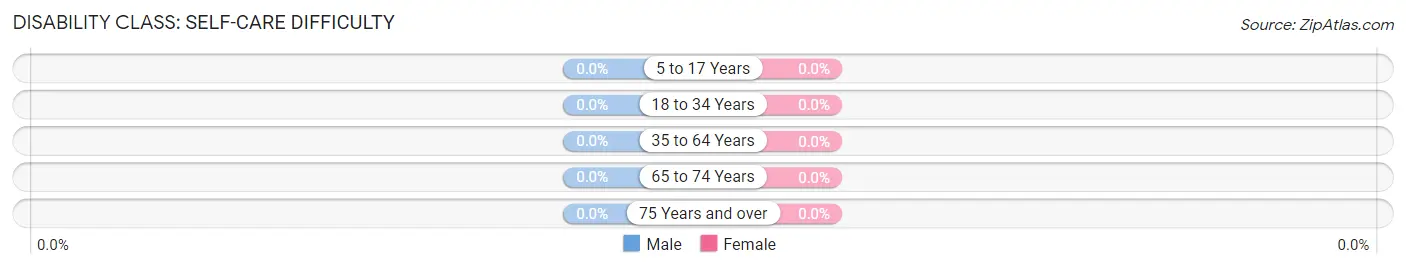
| Age Bracket | Male | Female |
| 5 to 17 Years | 0 (0.0%) | 0 (0.0%) |
| 18 to 34 Years | 0 (0.0%) | 0 (0.0%) |
| 35 to 64 Years | 0 (0.0%) | 0 (0.0%) |
| 65 to 74 Years | 0 (0.0%) | 0 (0.0%) |
| 75 Years and over | 0 (0.0%) | 0 (0.0%) |
Technology Access in Startup
Computing Device Access in Startup
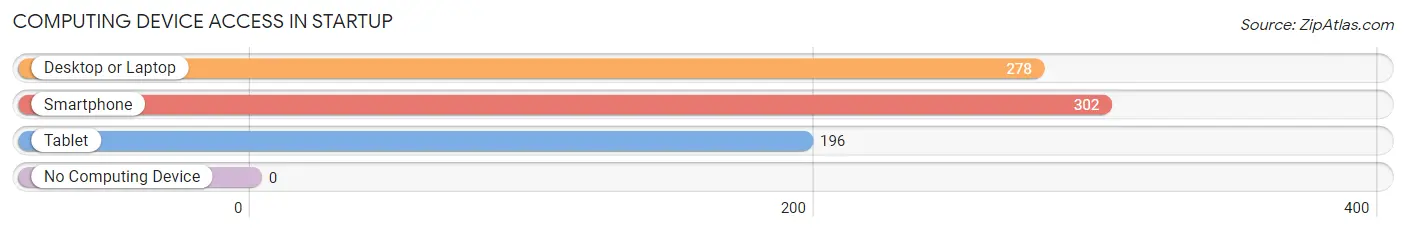
| Device Type | # Households | % Households |
| Desktop or Laptop | 278 | 83.5% |
| Smartphone | 302 | 90.7% |
| Tablet | 196 | 58.9% |
| No Computing Device | 0 | 0.0% |
| Total | 333 | 100.0% |
Internet Access in Startup
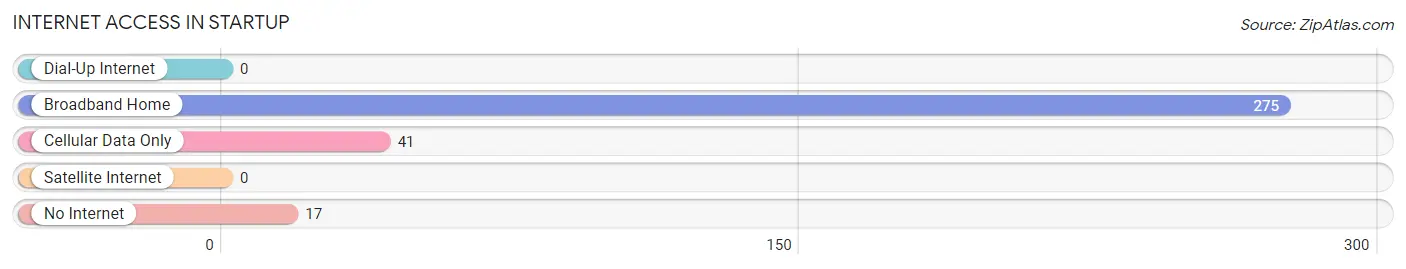
| Internet Type | # Households | % Households |
| Dial-Up Internet | 0 | 0.0% |
| Broadband Home | 275 | 82.6% |
| Cellular Data Only | 41 | 12.3% |
| Satellite Internet | 0 | 0.0% |
| No Internet | 17 | 5.1% |
| Total | 333 | 100.0% |
Startup Summary
Washington is a state located in the Pacific Northwest region of the United States. It is bordered by Oregon to the south, Idaho to the east, and the Canadian province of British Columbia to the north. Washington is the 18th largest state in the United States, with an area of 71,362 square miles, and the 13th most populous state, with a population of 7.4 million as of 2019. The state capital is Olympia, and the largest city is Seattle.
History
The area that is now Washington was first inhabited by Native American tribes, including the Chinook, Nisqually, and Klickitat. The first European to explore the area was British explorer George Vancouver in 1792. The area was part of the Oregon Country, a disputed region between the United States and Great Britain, until 1846 when the Oregon Treaty established the 49th parallel as the border between the two countries.
Washington became the 42nd state in 1889, after a long struggle for statehood. The state was named after George Washington, the first president of the United States. Washington was the first state to be admitted to the Union under the newly-ratified Constitution.
Geography
Washington is located in the Pacific Northwest region of the United States. It is bordered by Oregon to the south, Idaho to the east, and the Canadian province of British Columbia to the north. The state has a diverse landscape, ranging from the Cascade Mountains in the west to the Rocky Mountains in the east. The Olympic Mountains are located in the northwest corner of the state, and the Columbia River forms much of the state's eastern border.
Economy
Washington's economy is largely driven by the technology industry, with Seattle being home to many major tech companies such as Microsoft, Amazon, and Boeing. The state is also a major producer of agricultural products, including apples, wheat, and potatoes. Washington is also a major producer of timber, and the state is home to many lumber mills.
The state's economy is also supported by the tourism industry, with many visitors coming to the state to visit its national parks, such as Mount Rainier National Park and Olympic National Park.
Demographics
As of 2019, the population of Washington was estimated to be 7.4 million. The state is ethnically diverse, with the largest ethnic groups being White (77.2%), Hispanic or Latino (11.2%), and Asian (7.2%). The state's largest cities are Seattle, Spokane, Tacoma, and Vancouver.
Washington is also home to many Native American tribes, including the Chinook, Nisqually, and Klickitat. The state is also home to many immigrants, with the largest immigrant groups being from Mexico, India, and China.
Common Questions
What is Per Capita Income in Startup?
Per Capita income in Startup is $64,038.
What is the Median Family Income in Startup?
Median Family Income in Startup is $63,728.
What is the Median Household income in Startup?
Median Household Income in Startup is $96,492.
What is Inequality or Gini Index in Startup?
Inequality or Gini Index in Startup is 0.39.
What is the Total Population of Startup?
Total Population of Startup is 651.
What is the Total Male Population of Startup?
Total Male Population of Startup is 275.
What is the Total Female Population of Startup?
Total Female Population of Startup is 376.
What is the Ratio of Males per 100 Females in Startup?
There are 73.14 Males per 100 Females in Startup.
What is the Ratio of Females per 100 Males in Startup?
There are 136.73 Females per 100 Males in Startup.
What is the Median Population Age in Startup?
Median Population Age in Startup is 59.3 Years.
What is the Average Family Size in Startup
Average Family Size in Startup is 2.1 People.
What is the Average Household Size in Startup
Average Household Size in Startup is 1.9 People.
How Large is the Labor Force in Startup?
There are 389 People in the Labor Forcein in Startup.
What is the Percentage of People in the Labor Force in Startup?
66.0% of People are in the Labor Force in Startup.