Maple Heights Lake Desire, WA Map & Demographics
Maple Heights Lake Desire Map
Maple Heights Lake Desire Overview
$54,918
PER CAPITA INCOME
$134,423
AVG FAMILY INCOME
$124,400
AVG HOUSEHOLD INCOME
34.3%
WAGE / INCOME GAP [ % ]
65.7¢/ $1
WAGE / INCOME GAP [ $ ]
0.39
INEQUALITY / GINI INDEX
3,436
TOTAL POPULATION
1,831
MALE POPULATION
1,605
FEMALE POPULATION
114.08
MALES / 100 FEMALES
87.66
FEMALES / 100 MALES
46.0
MEDIAN AGE
2.9
AVG FAMILY SIZE
2.8
AVG HOUSEHOLD SIZE
1,626
LABOR FORCE [ PEOPLE ]
59.4%
PERCENT IN LABOR FORCE
1.0%
UNEMPLOYMENT RATE
Income in Maple Heights Lake Desire
Income Overview in Maple Heights Lake Desire
Per Capita Income in Maple Heights Lake Desire is $54,918, while median incomes of families and households are $134,423 and $124,400 respectively.
| Characteristic | Number | Measure |
| Per Capita Income | 3,436 | $54,918 |
| Median Family Income | 960 | $134,423 |
| Mean Family Income | 960 | $169,848 |
| Median Household Income | 1,206 | $124,400 |
| Mean Household Income | 1,206 | $153,619 |
| Income Deficit | 960 | $0 |
| Wage / Income Gap (%) | 3,436 | 34.35% |
| Wage / Income Gap ($) | 3,436 | 65.65¢ per $1 |
| Gini / Inequality Index | 3,436 | 0.39 |
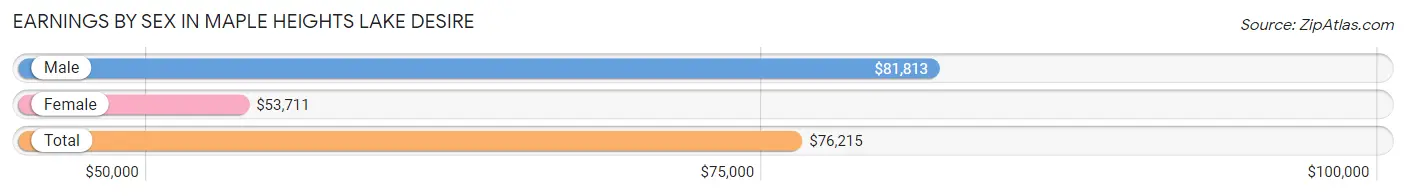
Earnings by Sex in Maple Heights Lake Desire
Average Earnings in Maple Heights Lake Desire are $76,215, $81,813 for men and $53,711 for women, a difference of 34.4%.
| Sex | Number | Average Earnings |
| Male | 946 (54.3%) | $81,813 |
| Female | 797 (45.7%) | $53,711 |
| Total | 1,743 (100.0%) | $76,215 |
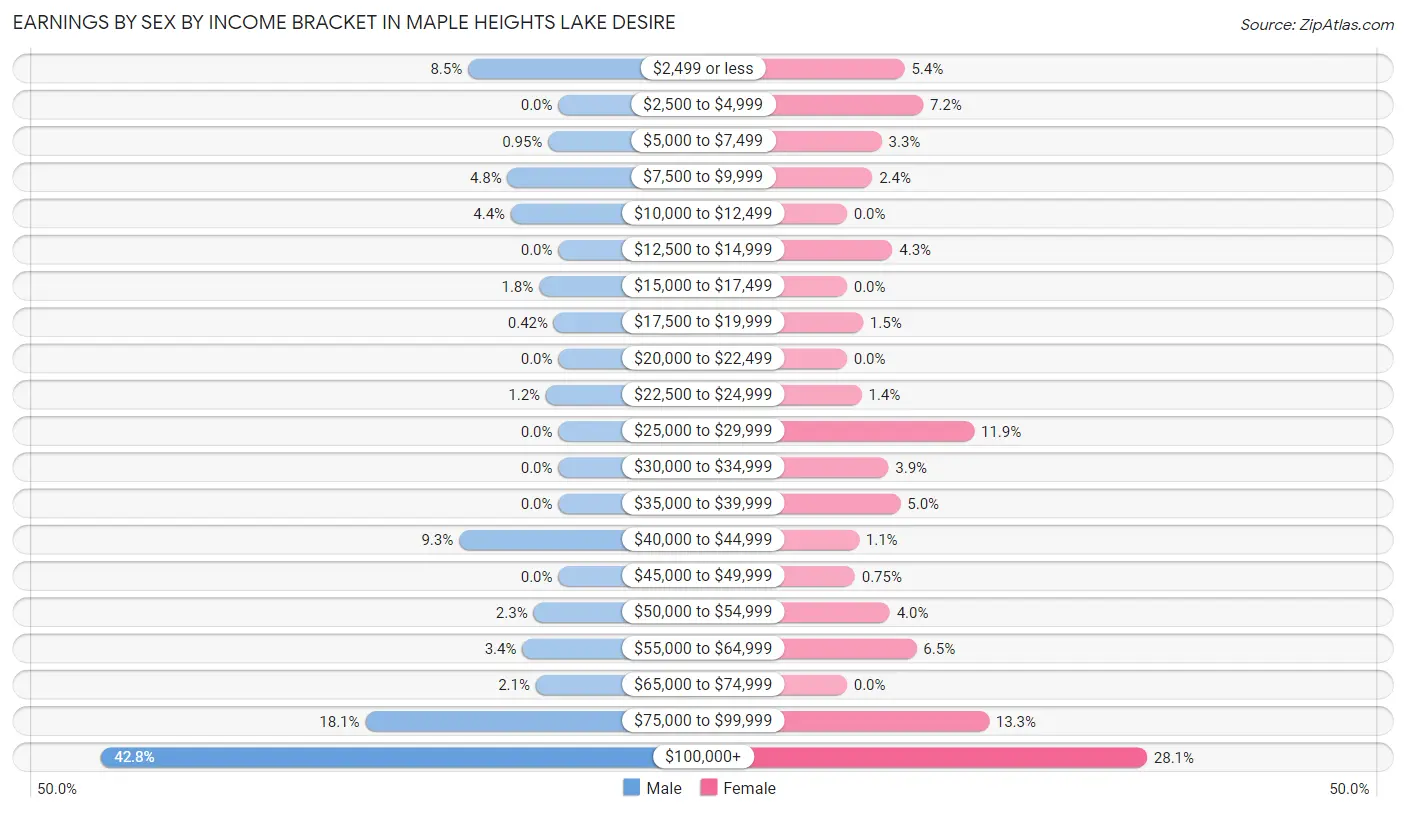
Earnings by Sex by Income Bracket in Maple Heights Lake Desire
The most common earnings brackets in Maple Heights Lake Desire are $100,000+ for men (405 | 42.8%) and $100,000+ for women (224 | 28.1%).
| Income | Male | Female |
| $2,499 or less | 80 (8.5%) | 43 (5.4%) |
| $2,500 to $4,999 | 0 (0.0%) | 57 (7.1%) |
| $5,000 to $7,499 | 9 (0.9%) | 26 (3.3%) |
| $7,500 to $9,999 | 45 (4.8%) | 19 (2.4%) |
| $10,000 to $12,499 | 42 (4.4%) | 0 (0.0%) |
| $12,500 to $14,999 | 0 (0.0%) | 34 (4.3%) |
| $15,000 to $17,499 | 17 (1.8%) | 0 (0.0%) |
| $17,500 to $19,999 | 4 (0.4%) | 12 (1.5%) |
| $20,000 to $22,499 | 0 (0.0%) | 0 (0.0%) |
| $22,500 to $24,999 | 11 (1.2%) | 11 (1.4%) |
| $25,000 to $29,999 | 0 (0.0%) | 95 (11.9%) |
| $30,000 to $34,999 | 0 (0.0%) | 31 (3.9%) |
| $35,000 to $39,999 | 0 (0.0%) | 40 (5.0%) |
| $40,000 to $44,999 | 88 (9.3%) | 9 (1.1%) |
| $45,000 to $49,999 | 0 (0.0%) | 6 (0.7%) |
| $50,000 to $54,999 | 22 (2.3%) | 32 (4.0%) |
| $55,000 to $64,999 | 32 (3.4%) | 52 (6.5%) |
| $65,000 to $74,999 | 20 (2.1%) | 0 (0.0%) |
| $75,000 to $99,999 | 171 (18.1%) | 106 (13.3%) |
| $100,000+ | 405 (42.8%) | 224 (28.1%) |
| Total | 946 (100.0%) | 797 (100.0%) |
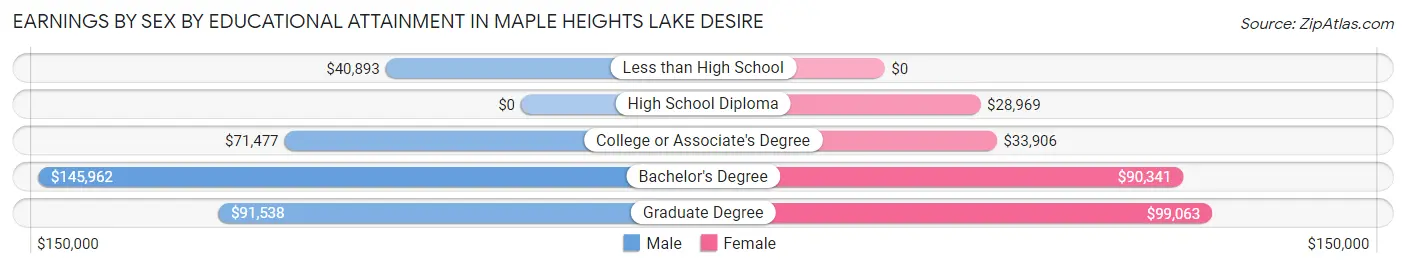
Earnings by Sex by Educational Attainment in Maple Heights Lake Desire
Average earnings in Maple Heights Lake Desire are $92,143 for men and $62,566 for women, a difference of 32.1%. Men with an educational attainment of bachelor's degree enjoy the highest average annual earnings of $145,962, while those with less than high school education earn the least with $40,893. Women with an educational attainment of graduate degree earn the most with the average annual earnings of $99,063, while those with high school diploma education have the smallest earnings of $28,969.
| Educational Attainment | Male Income | Female Income |
| Less than High School | $40,893 | $0 |
| High School Diploma | - | - |
| College or Associate's Degree | $71,477 | $33,906 |
| Bachelor's Degree | $145,962 | $90,341 |
| Graduate Degree | $91,538 | $99,063 |
| Total | $92,143 | $62,566 |
Family Income in Maple Heights Lake Desire
Family Income Brackets in Maple Heights Lake Desire
According to the Maple Heights Lake Desire family income data, there are 336 families falling into the $200,000+ income range, which is the most common income bracket and makes up 35.0% of all families.
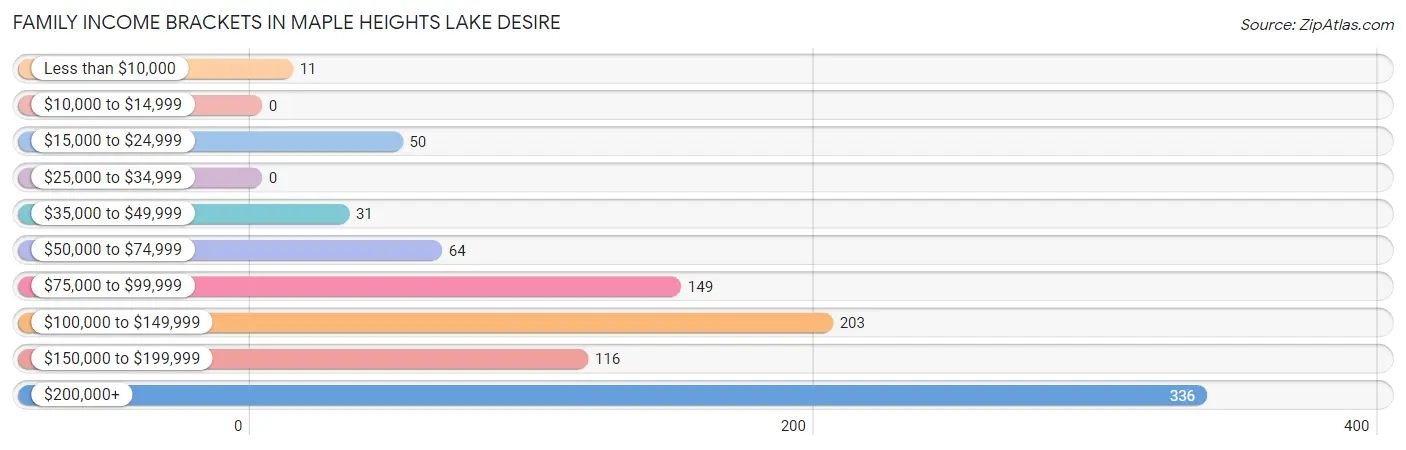
| Income Bracket | # Families | % Families |
| Less than $10,000 | 11 | 1.1% |
| $10,000 to $14,999 | 0 | 0.0% |
| $15,000 to $24,999 | 50 | 5.2% |
| $25,000 to $34,999 | 0 | 0.0% |
| $35,000 to $49,999 | 31 | 3.2% |
| $50,000 to $74,999 | 64 | 6.7% |
| $75,000 to $99,999 | 149 | 15.5% |
| $100,000 to $149,999 | 203 | 21.1% |
| $150,000 to $199,999 | 116 | 12.1% |
| $200,000+ | 336 | 35.0% |
Family Income by Famaliy Size in Maple Heights Lake Desire
5-person families (106 | 11.0%) account for the highest median family income in Maple Heights Lake Desire with $250,001 per family, while 3-person families (136 | 14.2%) have the highest median income of $66,806 per family member.
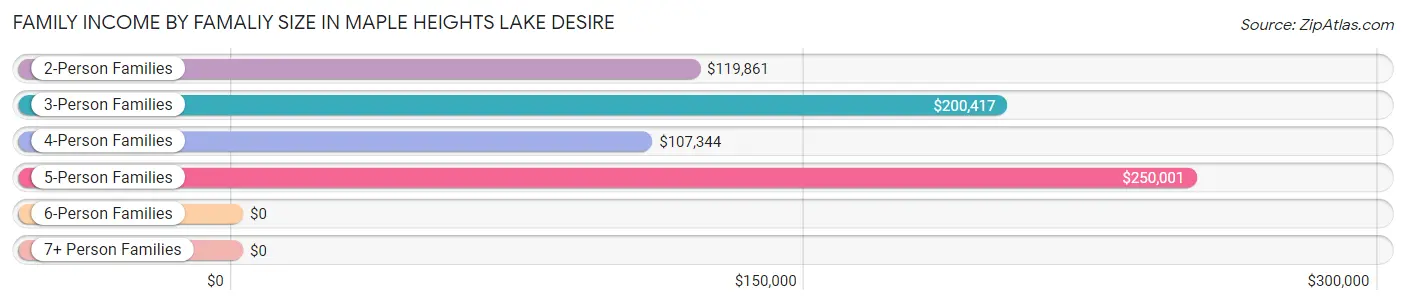
| Income Bracket | # Families | Median Income |
| 2-Person Families | 517 (53.8%) | $119,861 |
| 3-Person Families | 136 (14.2%) | $200,417 |
| 4-Person Families | 197 (20.5%) | $107,344 |
| 5-Person Families | 106 (11.0%) | $250,001 |
| 6-Person Families | 0 (0.0%) | $0 |
| 7+ Person Families | 4 (0.4%) | $0 |
| Total | 960 (100.0%) | $134,423 |
Family Income by Number of Earners in Maple Heights Lake Desire
The median family income in Maple Heights Lake Desire is $134,423, with families comprising 2 earners (433) having the highest median family income of $237,688, while families with no earners (143) have the lowest median family income of $67,639, accounting for 45.1% and 14.9% of families, respectively.
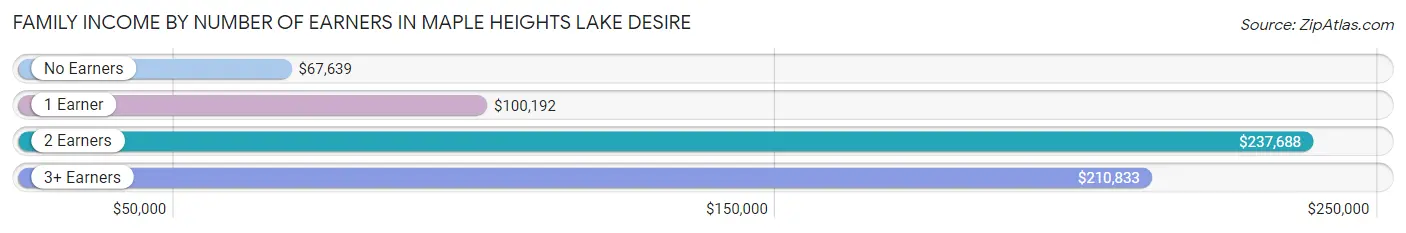
| Number of Earners | # Families | Median Income |
| No Earners | 143 (14.9%) | $67,639 |
| 1 Earner | 290 (30.2%) | $100,192 |
| 2 Earners | 433 (45.1%) | $237,688 |
| 3+ Earners | 94 (9.8%) | $210,833 |
| Total | 960 (100.0%) | $134,423 |
Household Income in Maple Heights Lake Desire
Household Income Brackets in Maple Heights Lake Desire
With 340 households falling in the category, the $200,000+ income range is the most frequent in Maple Heights Lake Desire, accounting for 28.2% of all households.
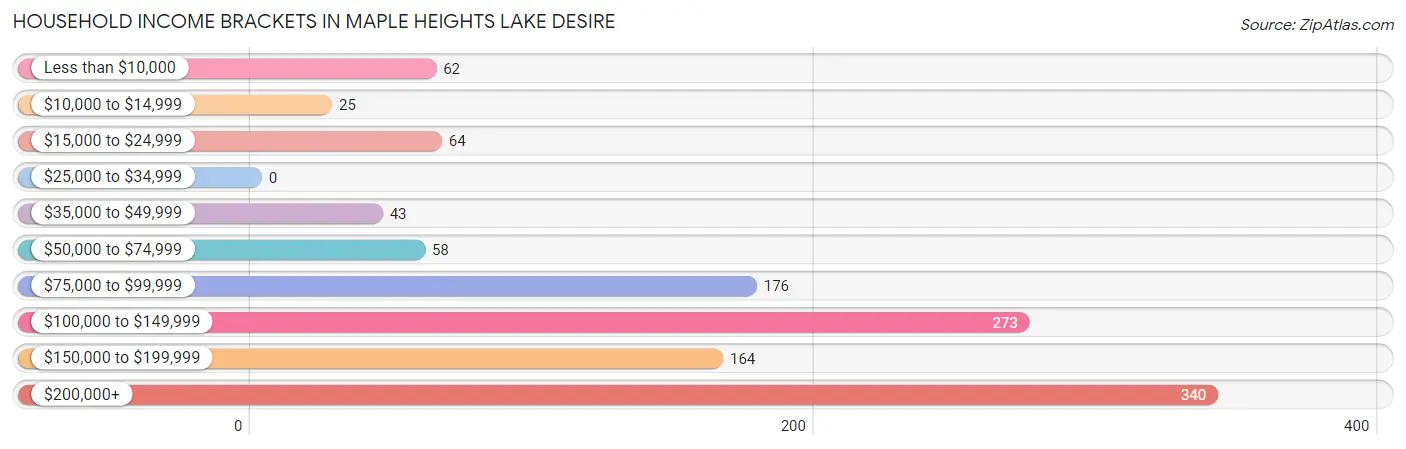
| Income Bracket | # Households | % Households |
| Less than $10,000 | 62 | 5.1% |
| $10,000 to $14,999 | 25 | 2.1% |
| $15,000 to $24,999 | 64 | 5.3% |
| $25,000 to $34,999 | 0 | 0.0% |
| $35,000 to $49,999 | 43 | 3.6% |
| $50,000 to $74,999 | 58 | 4.8% |
| $75,000 to $99,999 | 176 | 14.6% |
| $100,000 to $149,999 | 273 | 22.6% |
| $150,000 to $199,999 | 164 | 13.6% |
| $200,000+ | 340 | 28.2% |
Household Income by Householder Age in Maple Heights Lake Desire
The median household income in Maple Heights Lake Desire is $124,400, with the highest median household income of $134,135 found in the 25 to 44 years age bracket for the primary householder. A total of 325 households (27.0%) fall into this category.
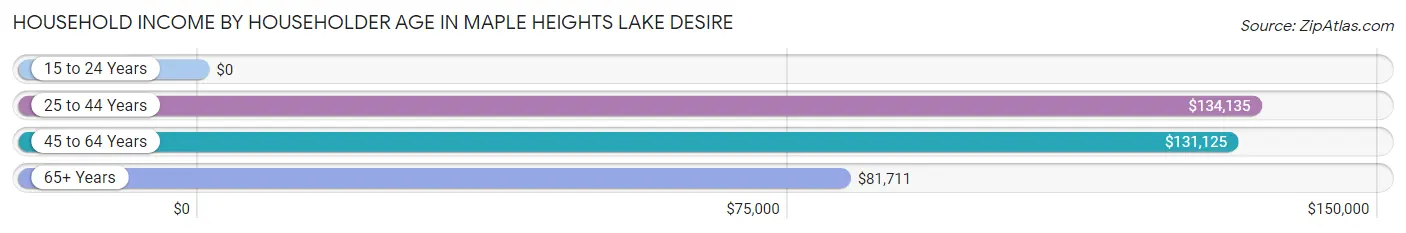
| Income Bracket | # Households | Median Income |
| 15 to 24 Years | 0 (0.0%) | $0 |
| 25 to 44 Years | 325 (27.0%) | $134,135 |
| 45 to 64 Years | 589 (48.8%) | $131,125 |
| 65+ Years | 292 (24.2%) | $81,711 |
| Total | 1,206 (100.0%) | $124,400 |
Poverty in Maple Heights Lake Desire
Income Below Poverty by Sex and Age in Maple Heights Lake Desire
With 9.5% poverty level for males and 10.6% for females among the residents of Maple Heights Lake Desire, 45 to 54 year old males and 75 year old and over females are the most vulnerable to poverty, with 111 males (27.8%) and 23 females (23.2%) in their respective age groups living below the poverty level.
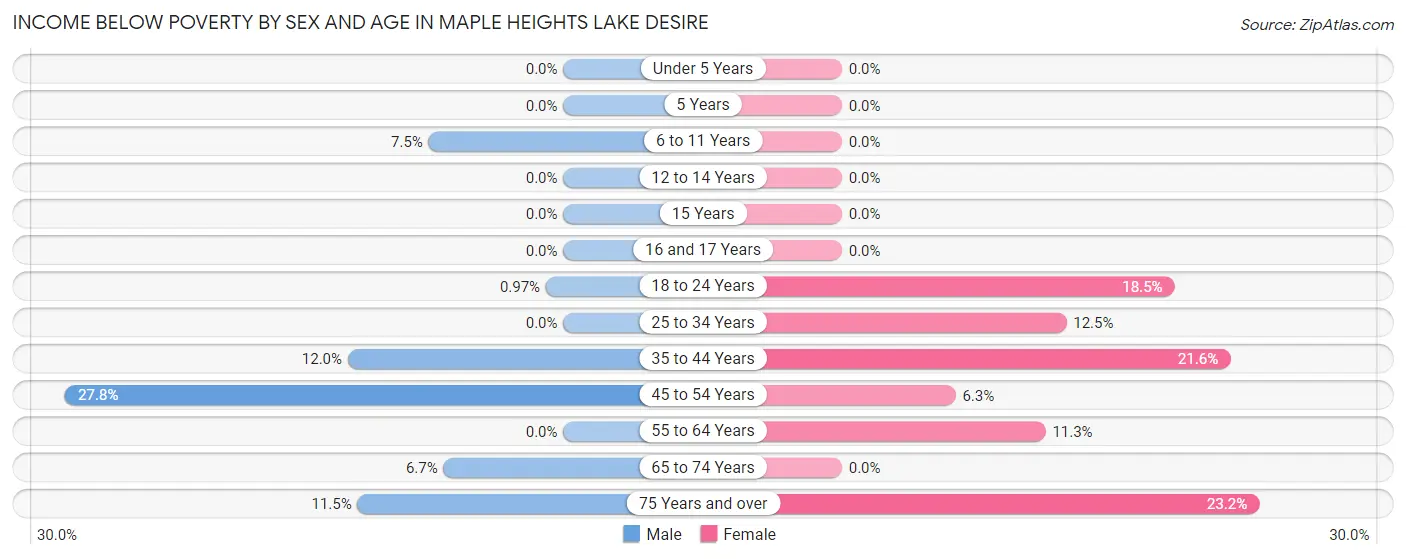
| Age Bracket | Male | Female |
| Under 5 Years | 0 (0.0%) | 0 (0.0%) |
| 5 Years | 0 (0.0%) | 0 (0.0%) |
| 6 to 11 Years | 12 (7.5%) | 0 (0.0%) |
| 12 to 14 Years | 0 (0.0%) | 0 (0.0%) |
| 15 Years | 0 (0.0%) | 0 (0.0%) |
| 16 and 17 Years | 0 (0.0%) | 0 (0.0%) |
| 18 to 24 Years | 1 (1.0%) | 10 (18.5%) |
| 25 to 34 Years | 0 (0.0%) | 19 (12.5%) |
| 35 to 44 Years | 24 (12.0%) | 64 (21.6%) |
| 45 to 54 Years | 111 (27.8%) | 15 (6.3%) |
| 55 to 64 Years | 0 (0.0%) | 33 (11.3%) |
| 65 to 74 Years | 11 (6.7%) | 0 (0.0%) |
| 75 Years and over | 11 (11.5%) | 23 (23.2%) |
| Total | 170 (9.5%) | 164 (10.6%) |
Income Above Poverty by Sex and Age in Maple Heights Lake Desire
According to the poverty statistics in Maple Heights Lake Desire, males aged under 5 years and females aged under 5 years are the age groups that are most secure financially, with 100.0% of males and 100.0% of females in these age groups living above the poverty line.
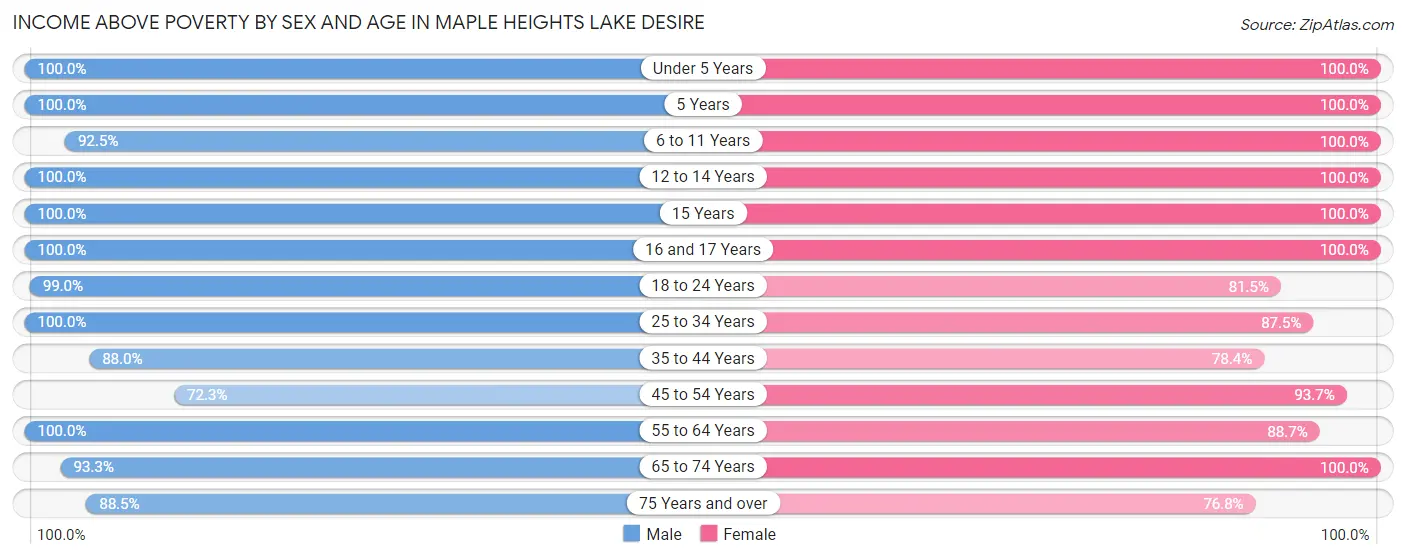
| Age Bracket | Male | Female |
| Under 5 Years | 78 (100.0%) | 50 (100.0%) |
| 5 Years | 10 (100.0%) | 20 (100.0%) |
| 6 to 11 Years | 148 (92.5%) | 81 (100.0%) |
| 12 to 14 Years | 87 (100.0%) | 61 (100.0%) |
| 15 Years | 46 (100.0%) | 20 (100.0%) |
| 16 and 17 Years | 43 (100.0%) | 16 (100.0%) |
| 18 to 24 Years | 102 (99.0%) | 44 (81.5%) |
| 25 to 34 Years | 92 (100.0%) | 133 (87.5%) |
| 35 to 44 Years | 176 (88.0%) | 232 (78.4%) |
| 45 to 54 Years | 289 (72.3%) | 222 (93.7%) |
| 55 to 64 Years | 309 (100.0%) | 258 (88.7%) |
| 65 to 74 Years | 154 (93.3%) | 168 (100.0%) |
| 75 Years and over | 85 (88.5%) | 76 (76.8%) |
| Total | 1,619 (90.5%) | 1,381 (89.4%) |
Income Below Poverty Among Married-Couple Families in Maple Heights Lake Desire
The poverty statistics for married-couple families in Maple Heights Lake Desire show that 2.6% or 22 of the total 855 families live below the poverty line. Families with no children have the highest poverty rate of 4.1%, comprising of 22 families. On the other hand, families with 1 or 2 children have the lowest poverty rate of 0.0%, which includes 0 families.
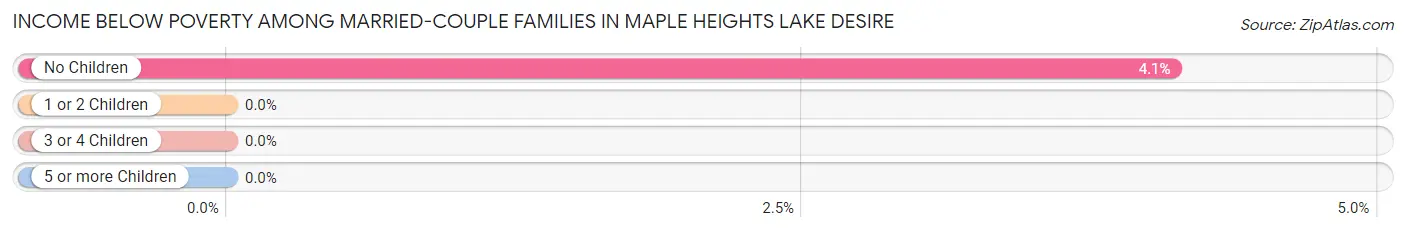
| Children | Above Poverty | Below Poverty |
| No Children | 513 (95.9%) | 22 (4.1%) |
| 1 or 2 Children | 272 (100.0%) | 0 (0.0%) |
| 3 or 4 Children | 48 (100.0%) | 0 (0.0%) |
| 5 or more Children | 0 (0.0%) | 0 (0.0%) |
| Total | 833 (97.4%) | 22 (2.6%) |
Income Below Poverty Among Single-Parent Households in Maple Heights Lake Desire
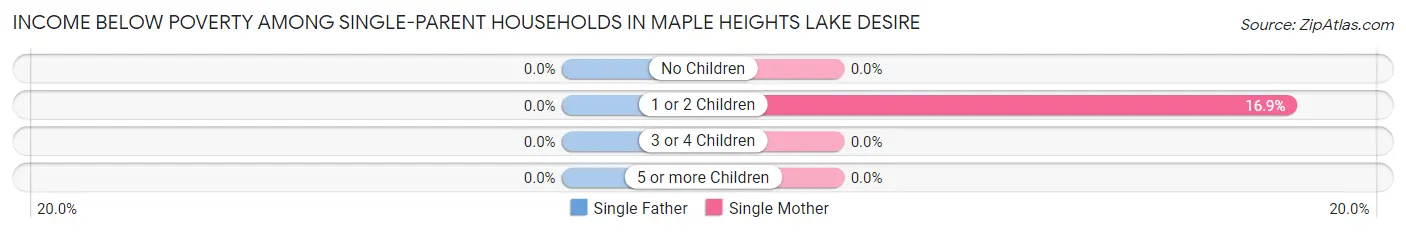
| Children | Single Father | Single Mother |
| No Children | 0 (0.0%) | 0 (0.0%) |
| 1 or 2 Children | 0 (0.0%) | 12 (16.9%) |
| 3 or 4 Children | 0 (0.0%) | 0 (0.0%) |
| 5 or more Children | 0 (0.0%) | 0 (0.0%) |
| Total | 0 (0.0%) | 12 (15.8%) |
Income Below Poverty Among Married-Couple vs Single-Parent Households in Maple Heights Lake Desire
The poverty data for Maple Heights Lake Desire shows that 22 of the married-couple family households (2.6%) and 12 of the single-parent households (11.4%) are living below the poverty level. Within the married-couple family households, those with no children have the highest poverty rate, with 22 households (4.1%) falling below the poverty line. Among the single-parent households, those with 1 or 2 children have the highest poverty rate, with 12 household (15.6%) living below poverty.
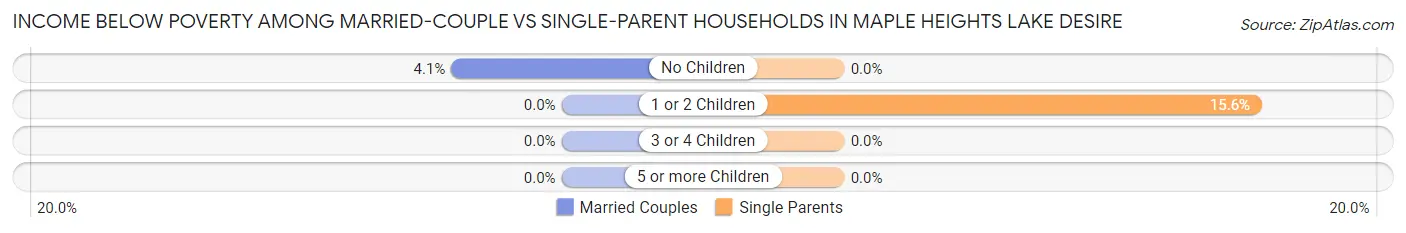
| Children | Married-Couple Families | Single-Parent Households |
| No Children | 22 (4.1%) | 0 (0.0%) |
| 1 or 2 Children | 0 (0.0%) | 12 (15.6%) |
| 3 or 4 Children | 0 (0.0%) | 0 (0.0%) |
| 5 or more Children | 0 (0.0%) | 0 (0.0%) |
| Total | 22 (2.6%) | 12 (11.4%) |
Race in Maple Heights Lake Desire
The most populous races in Maple Heights Lake Desire are White / Caucasian (2,814 | 81.9%), Asian (316 | 9.2%), and Hispanic or Latino (257 | 7.5%).
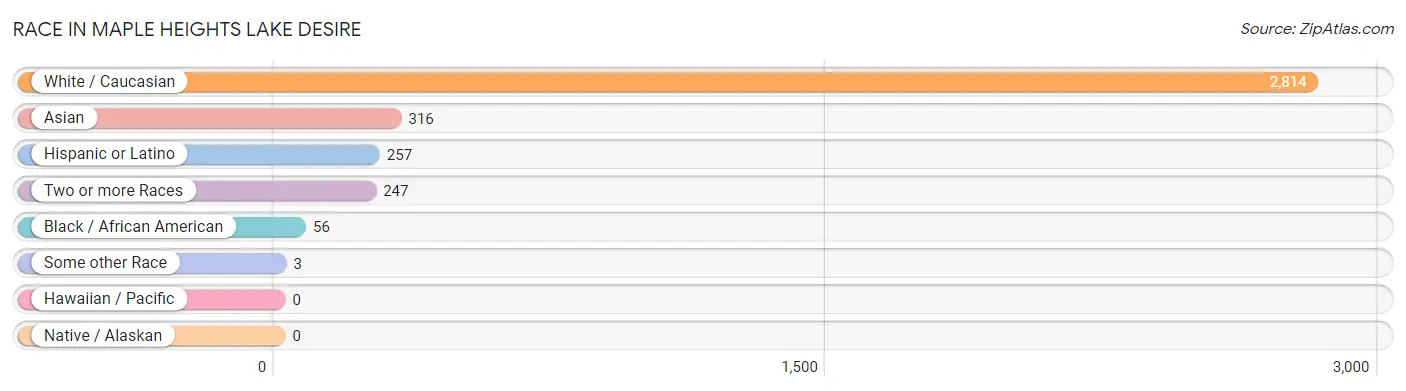
| Race | # Population | % Population |
| Asian | 316 | 9.2% |
| Black / African American | 56 | 1.6% |
| Hawaiian / Pacific | 0 | 0.0% |
| Hispanic or Latino | 257 | 7.5% |
| Native / Alaskan | 0 | 0.0% |
| White / Caucasian | 2,814 | 81.9% |
| Two or more Races | 247 | 7.2% |
| Some other Race | 3 | 0.1% |
| Total | 3,436 | 100.0% |
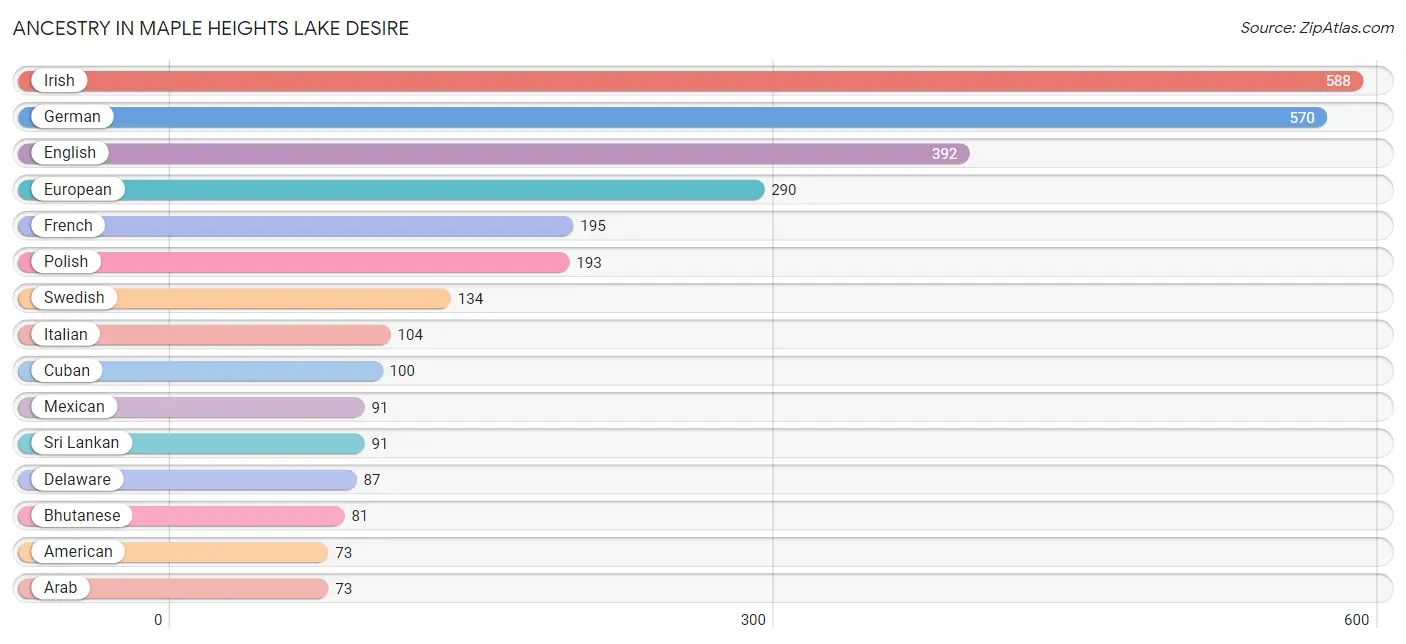
Ancestry in Maple Heights Lake Desire
The most populous ancestries reported in Maple Heights Lake Desire are Irish (588 | 17.1%), German (570 | 16.6%), English (392 | 11.4%), European (290 | 8.4%), and French (195 | 5.7%), together accounting for 59.2% of all Maple Heights Lake Desire residents.
| Ancestry | # Population | % Population |
| African | 2 | 0.1% |
| American | 73 | 2.1% |
| Arab | 73 | 2.1% |
| Bhutanese | 81 | 2.4% |
| British | 10 | 0.3% |
| Burmese | 27 | 0.8% |
| Canadian | 42 | 1.2% |
| Chilean | 6 | 0.2% |
| Cuban | 100 | 2.9% |
| Czech | 11 | 0.3% |
| Danish | 27 | 0.8% |
| Delaware | 87 | 2.5% |
| Dutch | 58 | 1.7% |
| Egyptian | 58 | 1.7% |
| English | 392 | 11.4% |
| European | 290 | 8.4% |
| Finnish | 37 | 1.1% |
| French | 195 | 5.7% |
| German | 570 | 16.6% |
| Greek | 9 | 0.3% |
| Hungarian | 8 | 0.2% |
| Indian (Asian) | 69 | 2.0% |
| Irish | 588 | 17.1% |
| Italian | 104 | 3.0% |
| Jamaican | 2 | 0.1% |
| Korean | 32 | 0.9% |
| Latvian | 9 | 0.3% |
| Lebanese | 15 | 0.4% |
| Lithuanian | 7 | 0.2% |
| Mexican | 91 | 2.6% |
| Mexican American Indian | 2 | 0.1% |
| Norwegian | 63 | 1.8% |
| Pennsylvania German | 13 | 0.4% |
| Peruvian | 14 | 0.4% |
| Polish | 193 | 5.6% |
| Puerto Rican | 20 | 0.6% |
| Russian | 53 | 1.5% |
| Scandinavian | 21 | 0.6% |
| Scotch-Irish | 10 | 0.3% |
| Scottish | 44 | 1.3% |
| South American | 20 | 0.6% |
| Spanish | 8 | 0.2% |
| Spanish American | 18 | 0.5% |
| Sri Lankan | 91 | 2.6% |
| Subsaharan African | 2 | 0.1% |
| Swedish | 134 | 3.9% |
| Swiss | 15 | 0.4% |
| Thai | 57 | 1.7% |
| Welsh | 31 | 0.9% | View All 49 Rows |
Immigrants in Maple Heights Lake Desire
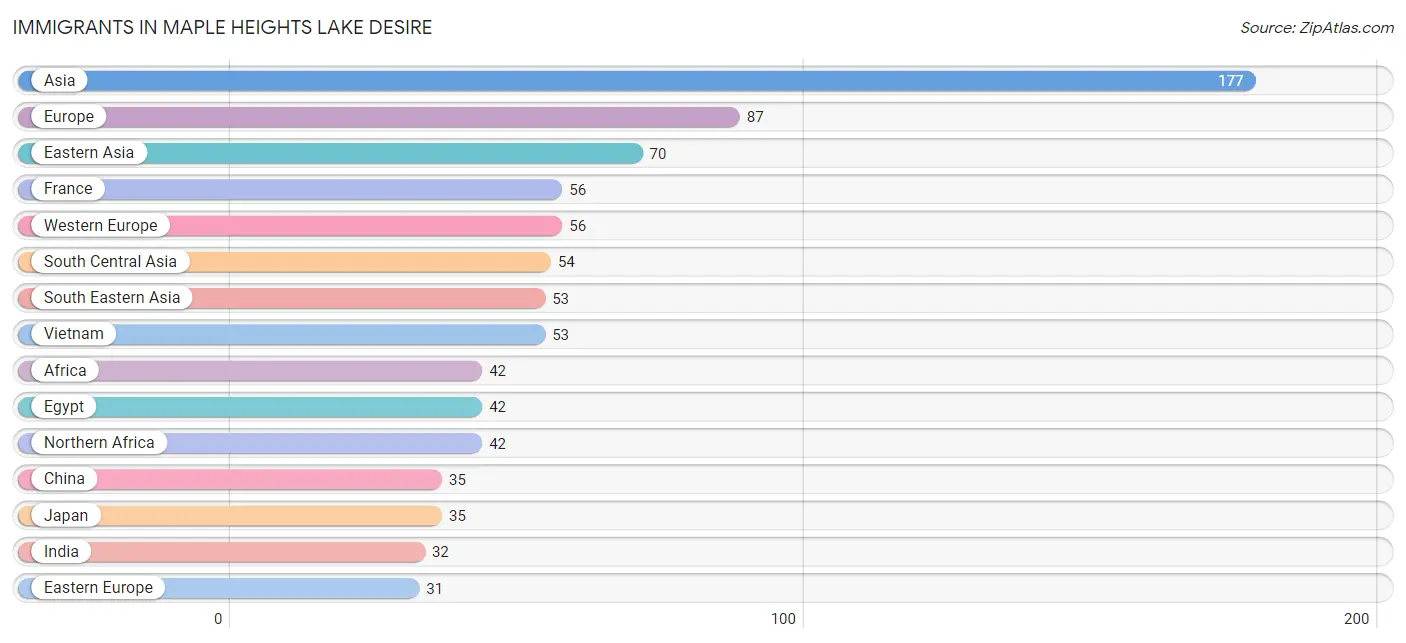
The most numerous immigrant groups reported in Maple Heights Lake Desire came from Asia (177 | 5.1%), Europe (87 | 2.5%), Eastern Asia (70 | 2.0%), France (56 | 1.6%), and Western Europe (56 | 1.6%), together accounting for 13.0% of all Maple Heights Lake Desire residents.
| Immigration Origin | # Population | % Population |
| Africa | 42 | 1.2% |
| Asia | 177 | 5.1% |
| Canada | 28 | 0.8% |
| Central America | 25 | 0.7% |
| Chile | 6 | 0.2% |
| China | 35 | 1.0% |
| Eastern Asia | 70 | 2.0% |
| Eastern Europe | 31 | 0.9% |
| Egypt | 42 | 1.2% |
| Europe | 87 | 2.5% |
| France | 56 | 1.6% |
| Hong Kong | 11 | 0.3% |
| India | 32 | 0.9% |
| Japan | 35 | 1.0% |
| Latin America | 31 | 0.9% |
| Latvia | 5 | 0.2% |
| Mexico | 25 | 0.7% |
| Northern Africa | 42 | 1.2% |
| Pakistan | 22 | 0.6% |
| Poland | 26 | 0.8% |
| South America | 6 | 0.2% |
| South Central Asia | 54 | 1.6% |
| South Eastern Asia | 53 | 1.5% |
| Taiwan | 13 | 0.4% |
| Vietnam | 53 | 1.5% |
| Western Europe | 56 | 1.6% | View All 26 Rows |
Sex and Age in Maple Heights Lake Desire
Sex and Age in Maple Heights Lake Desire
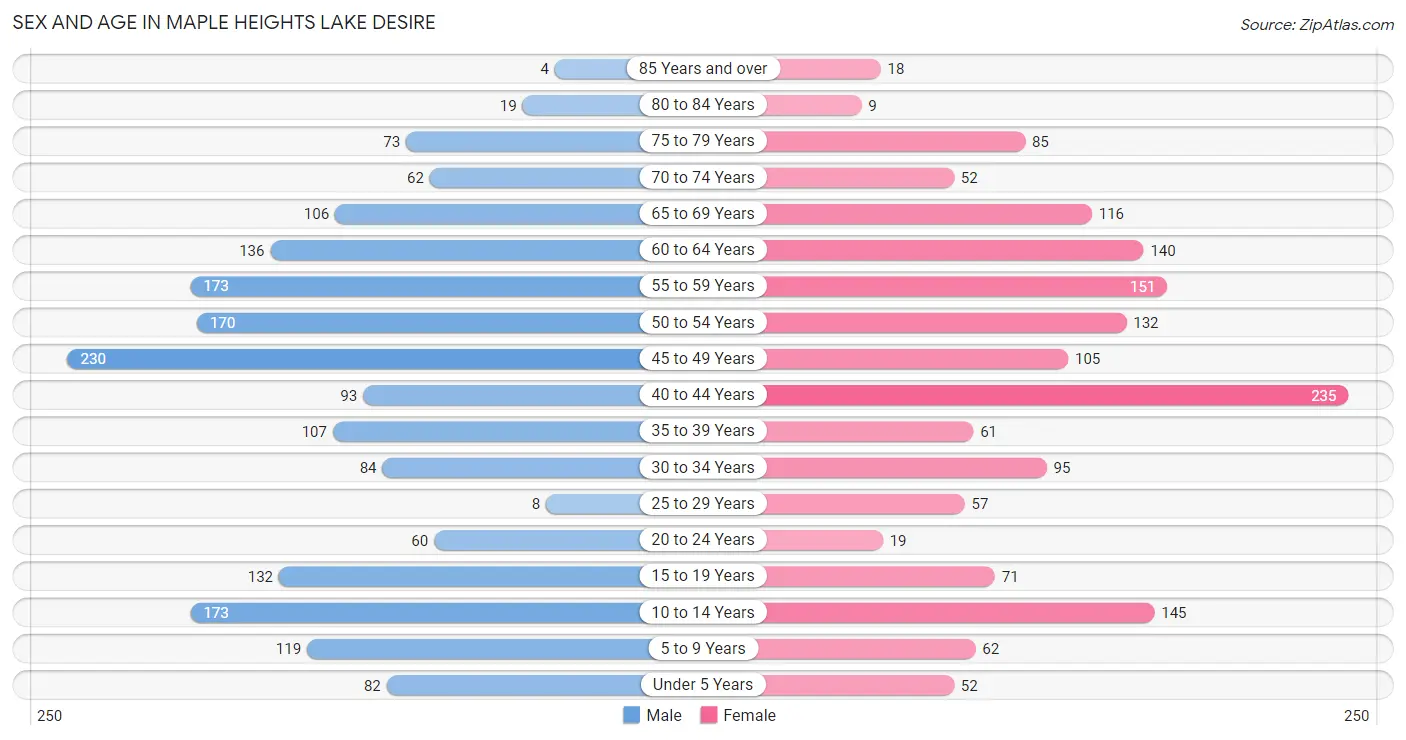
The most populous age groups in Maple Heights Lake Desire are 45 to 49 Years (230 | 12.6%) for men and 40 to 44 Years (235 | 14.6%) for women.
| Age Bracket | Male | Female |
| Under 5 Years | 82 (4.5%) | 52 (3.2%) |
| 5 to 9 Years | 119 (6.5%) | 62 (3.9%) |
| 10 to 14 Years | 173 (9.5%) | 145 (9.0%) |
| 15 to 19 Years | 132 (7.2%) | 71 (4.4%) |
| 20 to 24 Years | 60 (3.3%) | 19 (1.2%) |
| 25 to 29 Years | 8 (0.4%) | 57 (3.5%) |
| 30 to 34 Years | 84 (4.6%) | 95 (5.9%) |
| 35 to 39 Years | 107 (5.8%) | 61 (3.8%) |
| 40 to 44 Years | 93 (5.1%) | 235 (14.6%) |
| 45 to 49 Years | 230 (12.6%) | 105 (6.5%) |
| 50 to 54 Years | 170 (9.3%) | 132 (8.2%) |
| 55 to 59 Years | 173 (9.5%) | 151 (9.4%) |
| 60 to 64 Years | 136 (7.4%) | 140 (8.7%) |
| 65 to 69 Years | 106 (5.8%) | 116 (7.2%) |
| 70 to 74 Years | 62 (3.4%) | 52 (3.2%) |
| 75 to 79 Years | 73 (4.0%) | 85 (5.3%) |
| 80 to 84 Years | 19 (1.0%) | 9 (0.6%) |
| 85 Years and over | 4 (0.2%) | 18 (1.1%) |
| Total | 1,831 (100.0%) | 1,605 (100.0%) |
Families and Households in Maple Heights Lake Desire
Median Family Size in Maple Heights Lake Desire
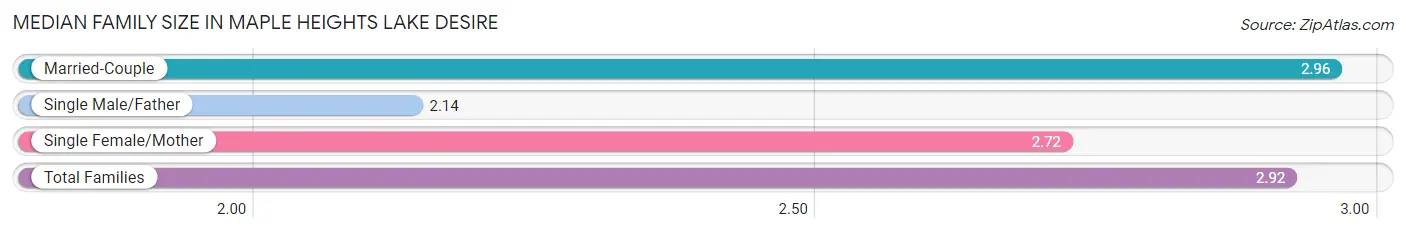
The median family size in Maple Heights Lake Desire is 2.92 persons per family, with married-couple families (855 | 89.1%) accounting for the largest median family size of 2.96 persons per family. On the other hand, single male/father families (29 | 3.0%) represent the smallest median family size with 2.14 persons per family.
| Family Type | # Families | Family Size |
| Married-Couple | 855 (89.1%) | 2.96 |
| Single Male/Father | 29 (3.0%) | 2.14 |
| Single Female/Mother | 76 (7.9%) | 2.72 |
| Total Families | 960 (100.0%) | 2.92 |
Median Household Size in Maple Heights Lake Desire
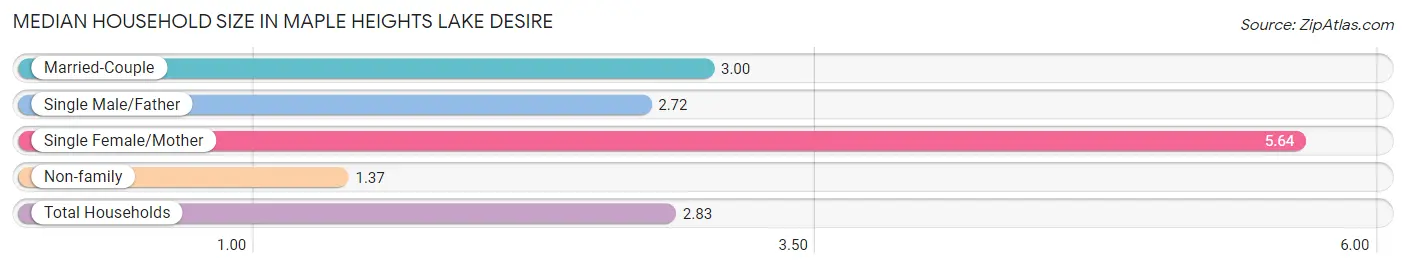
The median household size in Maple Heights Lake Desire is 2.83 persons per household, with single female/mother households (76 | 6.3%) accounting for the largest median household size of 5.64 persons per household. non-family households (246 | 20.4%) represent the smallest median household size with 1.37 persons per household.
| Household Type | # Households | Household Size |
| Married-Couple | 855 (70.9%) | 3.00 |
| Single Male/Father | 29 (2.4%) | 2.72 |
| Single Female/Mother | 76 (6.3%) | 5.64 |
| Non-family | 246 (20.4%) | 1.37 |
| Total Households | 1,206 (100.0%) | 2.83 |
Household Size by Marriage Status in Maple Heights Lake Desire
Out of a total of 1,206 households in Maple Heights Lake Desire, 960 (79.6%) are family households, while 246 (20.4%) are nonfamily households. The most numerous type of family households are 2-person households, comprising 463, and the most common type of nonfamily households are 1-person households, comprising 159.
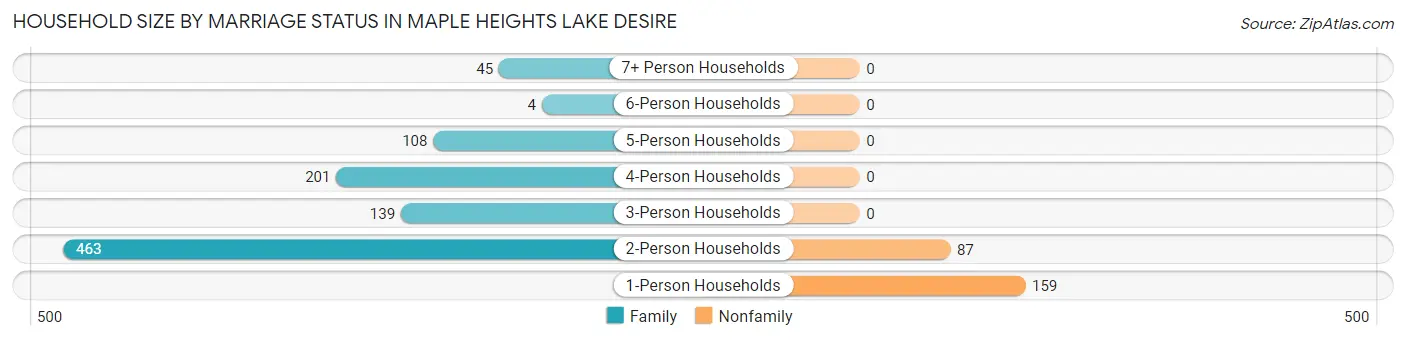
| Household Size | Family Households | Nonfamily Households |
| 1-Person Households | - | 159 (13.2%) |
| 2-Person Households | 463 (38.4%) | 87 (7.2%) |
| 3-Person Households | 139 (11.5%) | 0 (0.0%) |
| 4-Person Households | 201 (16.7%) | 0 (0.0%) |
| 5-Person Households | 108 (9.0%) | 0 (0.0%) |
| 6-Person Households | 4 (0.3%) | 0 (0.0%) |
| 7+ Person Households | 45 (3.7%) | 0 (0.0%) |
| Total | 960 (79.6%) | 246 (20.4%) |
Female Fertility in Maple Heights Lake Desire
Fertility by Age in Maple Heights Lake Desire
Average fertility rate in Maple Heights Lake Desire is 42.0 births per 1,000 women. Women in the age bracket of 20 to 34 years have the highest fertility rate with 164.0 births per 1,000 women. Women in the age bracket of 20 to 34 years acount for 100.0% of all women with births.
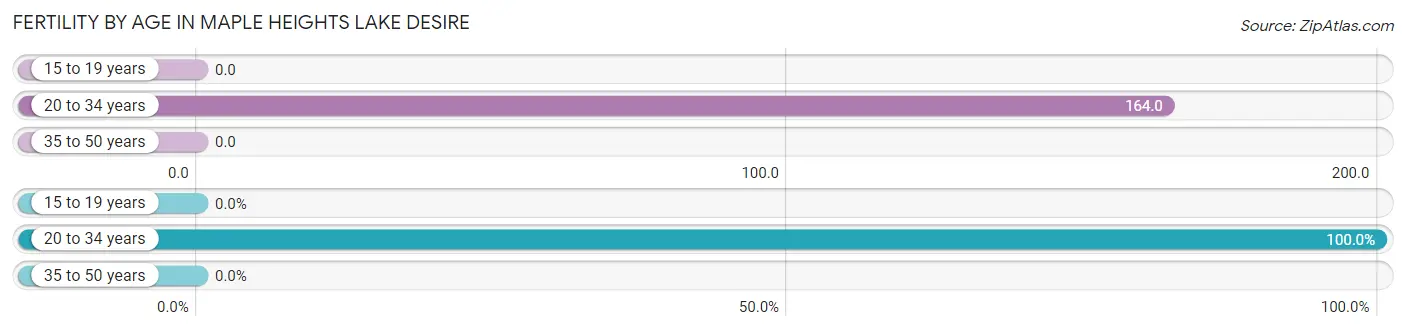
| Age Bracket | Women with Births | Births / 1,000 Women |
| 15 to 19 years | 0 (0.0%) | 0.0 |
| 20 to 34 years | 28 (100.0%) | 164.0 |
| 35 to 50 years | 0 (0.0%) | 0.0 |
| Total | 28 (100.0%) | 42.0 |
Fertility by Age by Marriage Status in Maple Heights Lake Desire
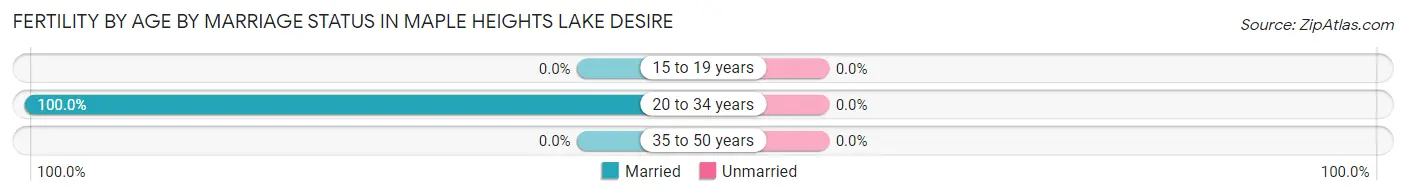
| Age Bracket | Married | Unmarried |
| 15 to 19 years | 0 (0.0%) | 0 (0.0%) |
| 20 to 34 years | 28 (100.0%) | 0 (0.0%) |
| 35 to 50 years | 0 (0.0%) | 0 (0.0%) |
| Total | 28 (100.0%) | 0 (0.0%) |
Fertility by Education in Maple Heights Lake Desire
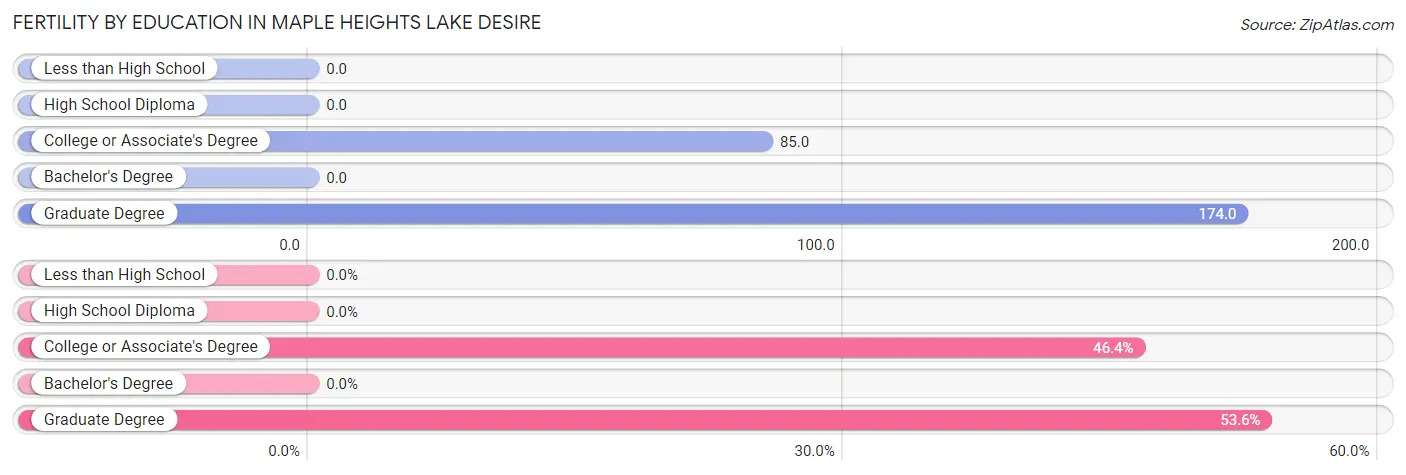
| Educational Attainment | Women with Births | Births / 1,000 Women |
| Less than High School | 0 (0.0%) | 0.0 |
| High School Diploma | 0 (0.0%) | 0.0 |
| College or Associate's Degree | 13 (46.4%) | 85.0 |
| Bachelor's Degree | 0 (0.0%) | 0.0 |
| Graduate Degree | 15 (53.6%) | 174.0 |
| Total | 28 (100.0%) | 42.0 |
Fertility by Education by Marriage Status in Maple Heights Lake Desire
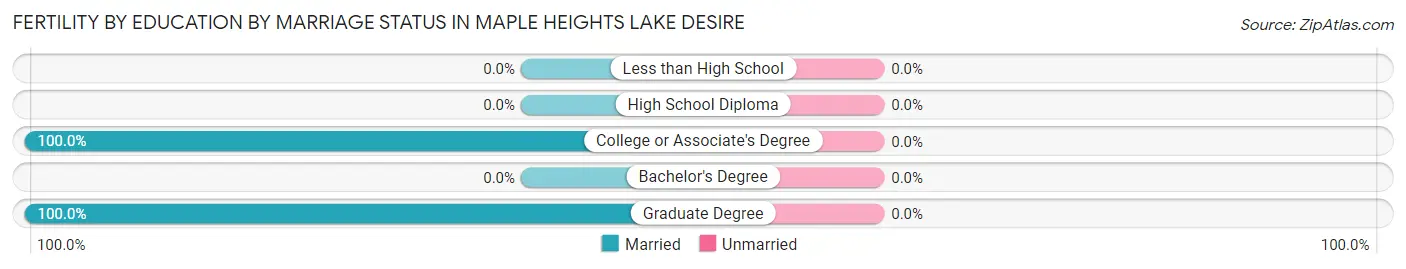
| Educational Attainment | Married | Unmarried |
| Less than High School | 0 (0.0%) | 0 (0.0%) |
| High School Diploma | 0 (0.0%) | 0 (0.0%) |
| College or Associate's Degree | 13 (100.0%) | 0 (0.0%) |
| Bachelor's Degree | 0 (0.0%) | 0 (0.0%) |
| Graduate Degree | 15 (100.0%) | 0 (0.0%) |
| Total | 28 (100.0%) | 0 (0.0%) |
Employment Characteristics in Maple Heights Lake Desire
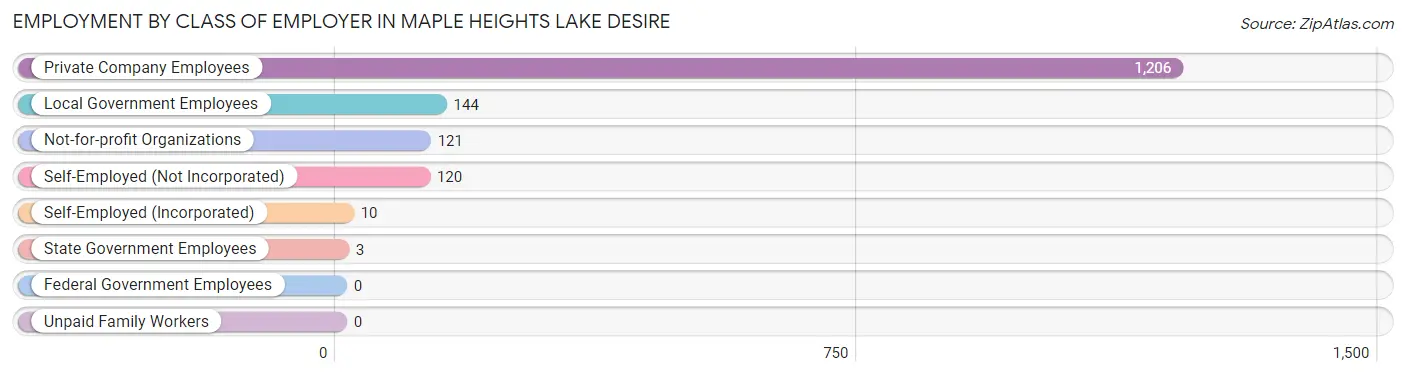
Employment by Class of Employer in Maple Heights Lake Desire
Among the 1,604 employed individuals in Maple Heights Lake Desire, private company employees (1,206 | 75.2%), local government employees (144 | 9.0%), and not-for-profit organizations (121 | 7.5%) make up the most common classes of employment.
| Employer Class | # Employees | % Employees |
| Private Company Employees | 1,206 | 75.2% |
| Self-Employed (Incorporated) | 10 | 0.6% |
| Self-Employed (Not Incorporated) | 120 | 7.5% |
| Not-for-profit Organizations | 121 | 7.5% |
| Local Government Employees | 144 | 9.0% |
| State Government Employees | 3 | 0.2% |
| Federal Government Employees | 0 | 0.0% |
| Unpaid Family Workers | 0 | 0.0% |
| Total | 1,604 | 100.0% |
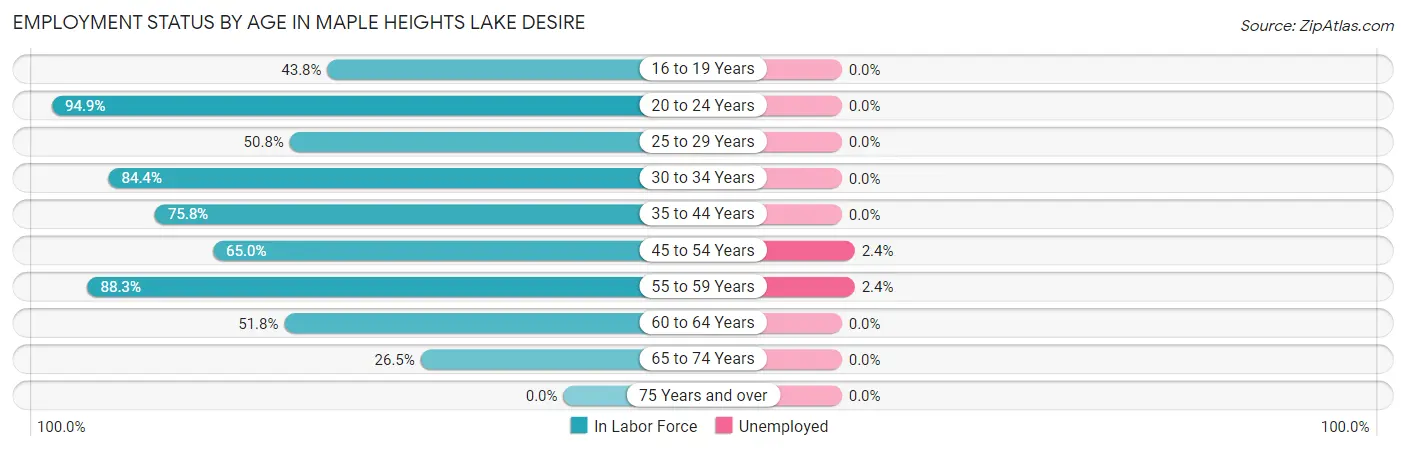
Employment Status by Age in Maple Heights Lake Desire
According to the labor force statistics for Maple Heights Lake Desire, out of the total population over 16 years of age (2,737), 59.4% or 1,626 individuals are in the labor force, with 1.0% or 16 of them unemployed. The age group with the highest labor force participation rate is 20 to 24 years, with 94.9% or 75 individuals in the labor force. Within the labor force, the 45 to 54 years age range has the highest percentage of unemployed individuals, with 2.4% or 10 of them being unemployed.
| Age Bracket | In Labor Force | Unemployed |
| 16 to 19 Years | 60 (43.8%) | 0 (0.0%) |
| 20 to 24 Years | 75 (94.9%) | 0 (0.0%) |
| 25 to 29 Years | 33 (50.8%) | 0 (0.0%) |
| 30 to 34 Years | 151 (84.4%) | 0 (0.0%) |
| 35 to 44 Years | 376 (75.8%) | 0 (0.0%) |
| 45 to 54 Years | 414 (65.0%) | 10 (2.4%) |
| 55 to 59 Years | 286 (88.3%) | 7 (2.4%) |
| 60 to 64 Years | 143 (51.8%) | 0 (0.0%) |
| 65 to 74 Years | 89 (26.5%) | 0 (0.0%) |
| 75 Years and over | 0 (0.0%) | 0 (0.0%) |
| Total | 1,626 (59.4%) | 16 (1.0%) |
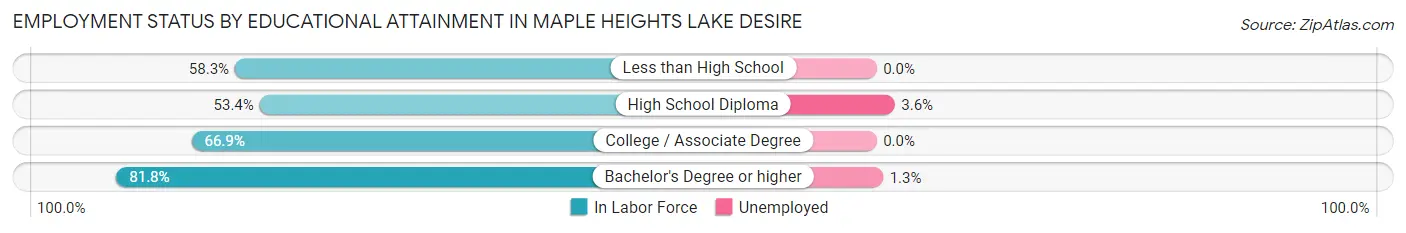
Employment Status by Educational Attainment in Maple Heights Lake Desire
According to labor force statistics for Maple Heights Lake Desire, 71.0% of individuals (1,404) out of the total population between 25 and 64 years of age (1,977) are in the labor force, with 1.2% or 17 of them being unemployed. The group with the highest labor force participation rate are those with the educational attainment of bachelor's degree or higher, with 81.8% or 741 individuals in the labor force. Within the labor force, individuals with high school diploma education have the highest percentage of unemployment, with 3.6% or 7 of them being unemployed.
| Educational Attainment | In Labor Force | Unemployed |
| Less than High School | 35 (58.3%) | 0 (0.0%) |
| High School Diploma | 196 (53.4%) | 13 (3.6%) |
| College / Associate Degree | 431 (66.9%) | 0 (0.0%) |
| Bachelor's Degree or higher | 741 (81.8%) | 12 (1.3%) |
| Total | 1,404 (71.0%) | 24 (1.2%) |
Employment Occupations by Sex in Maple Heights Lake Desire
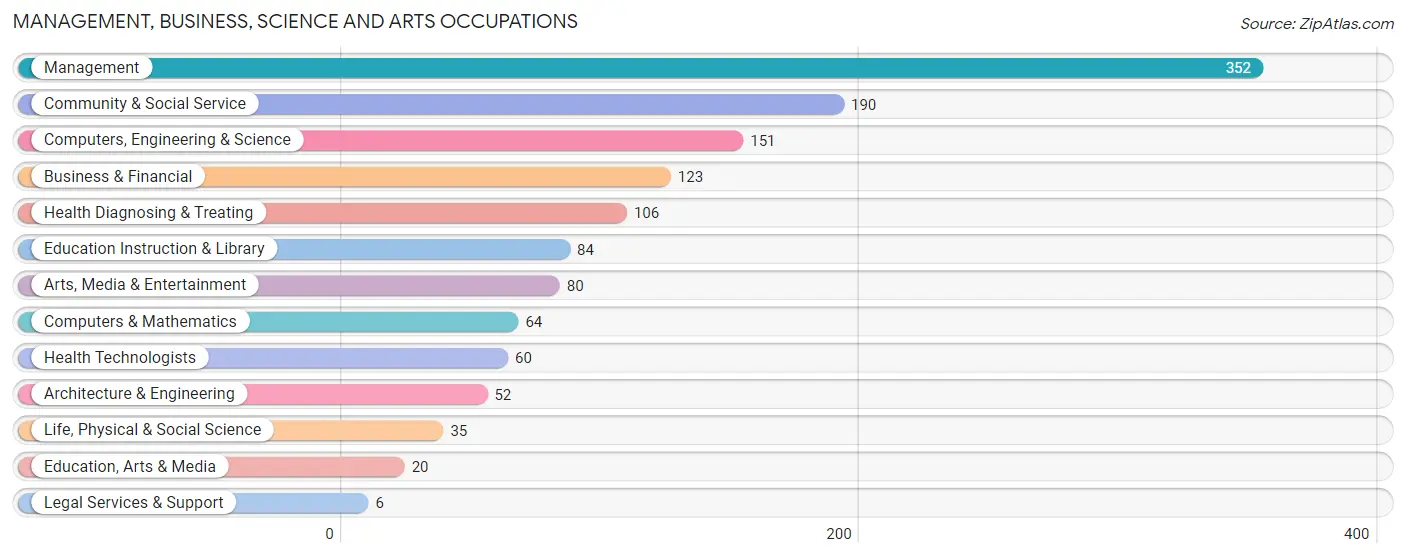
Management, Business, Science and Arts Occupations
The most common Management, Business, Science and Arts occupations in Maple Heights Lake Desire are Management (352 | 21.9%), Community & Social Service (190 | 11.8%), Computers, Engineering & Science (151 | 9.4%), Business & Financial (123 | 7.6%), and Health Diagnosing & Treating (106 | 6.6%).
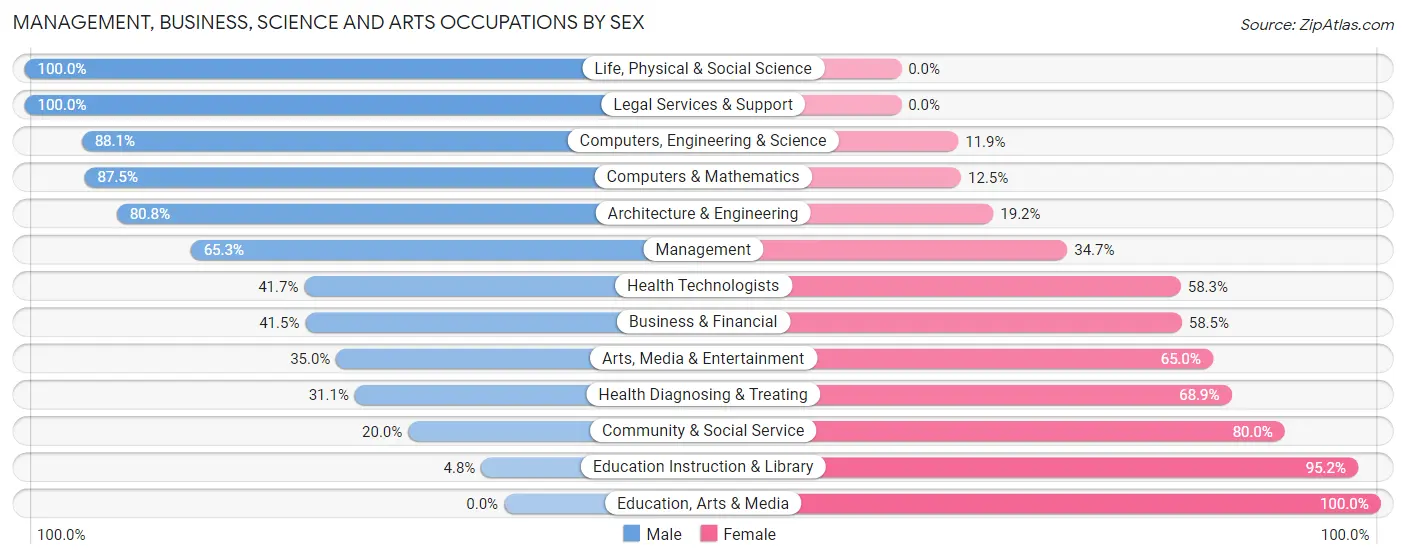
Management, Business, Science and Arts Occupations by Sex
Within the Management, Business, Science and Arts occupations in Maple Heights Lake Desire, the most male-oriented occupations are Life, Physical & Social Science (100.0%), Legal Services & Support (100.0%), and Computers, Engineering & Science (88.1%), while the most female-oriented occupations are Education, Arts & Media (100.0%), Education Instruction & Library (95.2%), and Community & Social Service (80.0%).
| Occupation | Male | Female |
| Management | 230 (65.3%) | 122 (34.7%) |
| Business & Financial | 51 (41.5%) | 72 (58.5%) |
| Computers, Engineering & Science | 133 (88.1%) | 18 (11.9%) |
| Computers & Mathematics | 56 (87.5%) | 8 (12.5%) |
| Architecture & Engineering | 42 (80.8%) | 10 (19.2%) |
| Life, Physical & Social Science | 35 (100.0%) | 0 (0.0%) |
| Community & Social Service | 38 (20.0%) | 152 (80.0%) |
| Education, Arts & Media | 0 (0.0%) | 20 (100.0%) |
| Legal Services & Support | 6 (100.0%) | 0 (0.0%) |
| Education Instruction & Library | 4 (4.8%) | 80 (95.2%) |
| Arts, Media & Entertainment | 28 (35.0%) | 52 (65.0%) |
| Health Diagnosing & Treating | 33 (31.1%) | 73 (68.9%) |
| Health Technologists | 25 (41.7%) | 35 (58.3%) |
| Total (Category) | 485 (52.6%) | 437 (47.4%) |
| Total (Overall) | 884 (54.9%) | 726 (45.1%) |
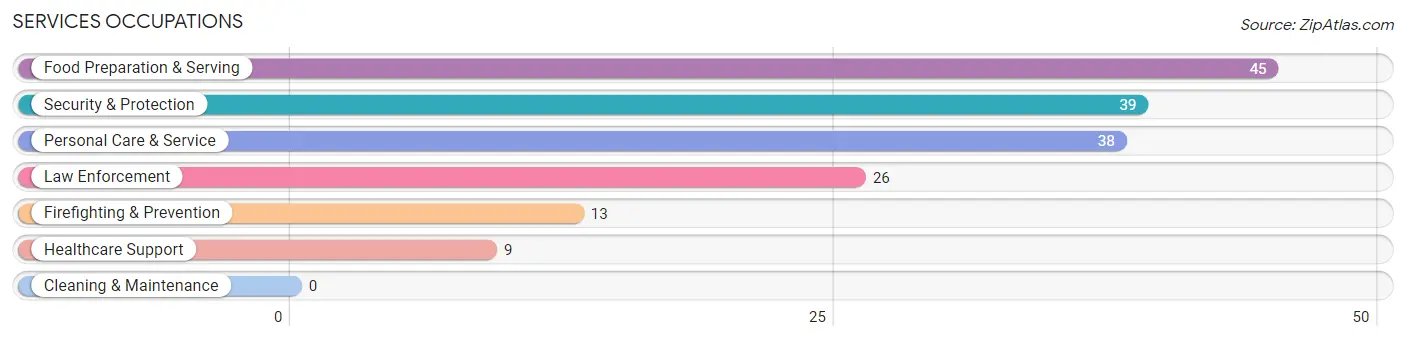
Services Occupations
The most common Services occupations in Maple Heights Lake Desire are Food Preparation & Serving (45 | 2.8%), Security & Protection (39 | 2.4%), Personal Care & Service (38 | 2.4%), Law Enforcement (26 | 1.6%), and Firefighting & Prevention (13 | 0.8%).
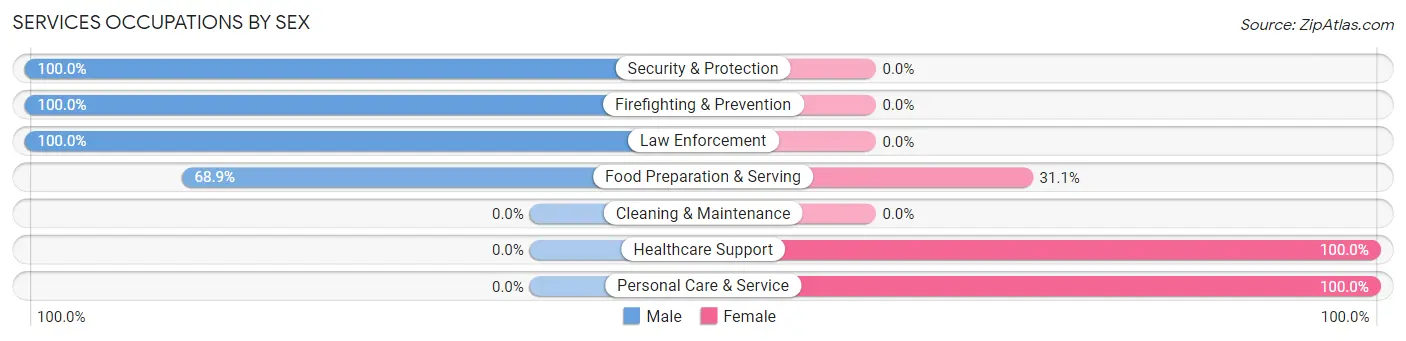
Services Occupations by Sex
Within the Services occupations in Maple Heights Lake Desire, the most male-oriented occupations are Security & Protection (100.0%), Firefighting & Prevention (100.0%), and Law Enforcement (100.0%), while the most female-oriented occupations are Healthcare Support (100.0%), Personal Care & Service (100.0%), and Food Preparation & Serving (31.1%).
| Occupation | Male | Female |
| Healthcare Support | 0 (0.0%) | 9 (100.0%) |
| Security & Protection | 39 (100.0%) | 0 (0.0%) |
| Firefighting & Prevention | 13 (100.0%) | 0 (0.0%) |
| Law Enforcement | 26 (100.0%) | 0 (0.0%) |
| Food Preparation & Serving | 31 (68.9%) | 14 (31.1%) |
| Cleaning & Maintenance | 0 (0.0%) | 0 (0.0%) |
| Personal Care & Service | 0 (0.0%) | 38 (100.0%) |
| Total (Category) | 70 (53.4%) | 61 (46.6%) |
| Total (Overall) | 884 (54.9%) | 726 (45.1%) |
Sales and Office Occupations
The most common Sales and Office occupations in Maple Heights Lake Desire are Sales & Related (258 | 16.0%), and Office & Administration (110 | 6.8%).
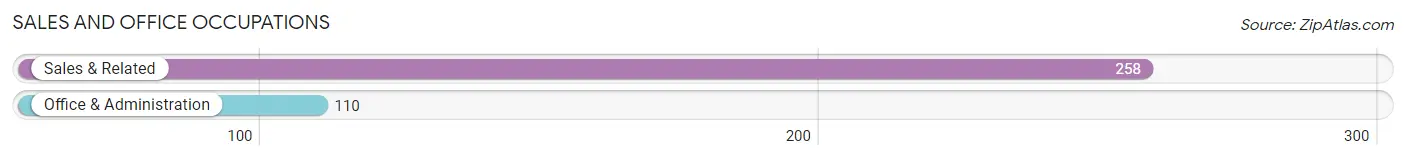
Sales and Office Occupations by Sex
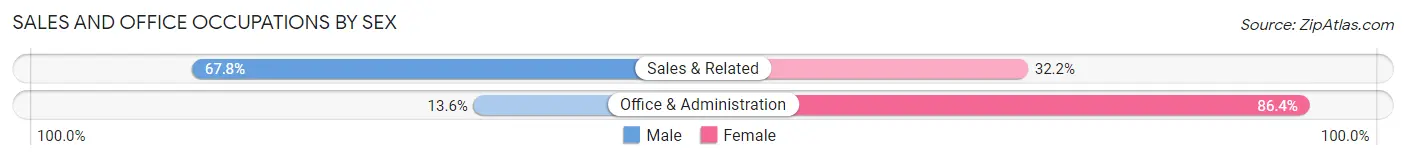
| Occupation | Male | Female |
| Sales & Related | 175 (67.8%) | 83 (32.2%) |
| Office & Administration | 15 (13.6%) | 95 (86.4%) |
| Total (Category) | 190 (51.6%) | 178 (48.4%) |
| Total (Overall) | 884 (54.9%) | 726 (45.1%) |
Natural Resources, Construction and Maintenance Occupations
The most common Natural Resources, Construction and Maintenance occupations in Maple Heights Lake Desire are Installation, Maintenance & Repair (54 | 3.4%), and Construction & Extraction (27 | 1.7%).
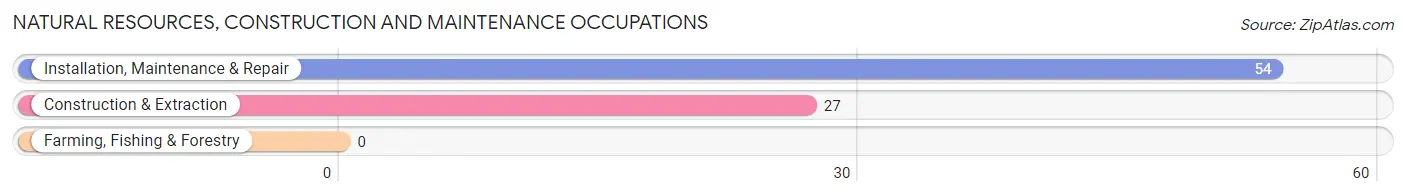
Natural Resources, Construction and Maintenance Occupations by Sex
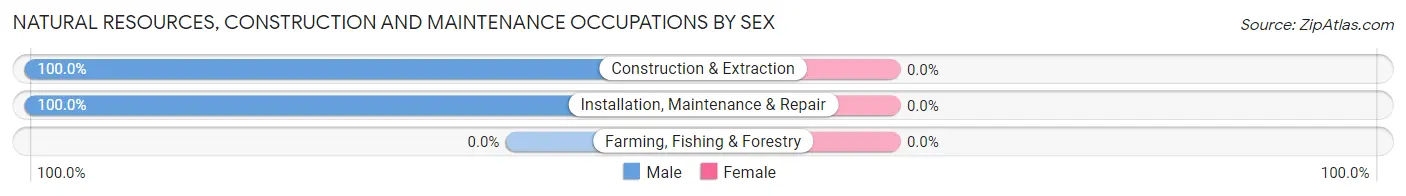
| Occupation | Male | Female |
| Farming, Fishing & Forestry | 0 (0.0%) | 0 (0.0%) |
| Construction & Extraction | 27 (100.0%) | 0 (0.0%) |
| Installation, Maintenance & Repair | 54 (100.0%) | 0 (0.0%) |
| Total (Category) | 81 (100.0%) | 0 (0.0%) |
| Total (Overall) | 884 (54.9%) | 726 (45.1%) |
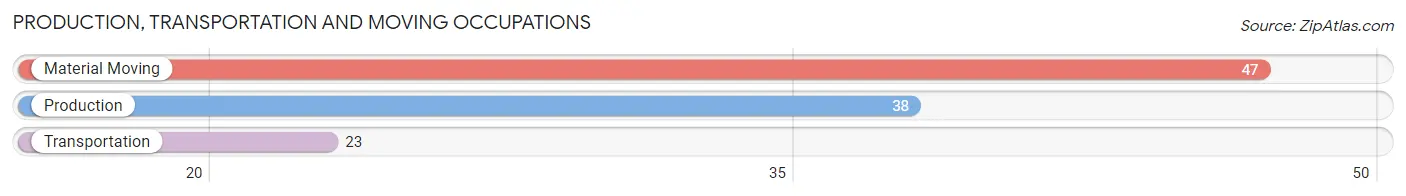
Production, Transportation and Moving Occupations
The most common Production, Transportation and Moving occupations in Maple Heights Lake Desire are Material Moving (47 | 2.9%), Production (38 | 2.4%), and Transportation (23 | 1.4%).
Production, Transportation and Moving Occupations by Sex
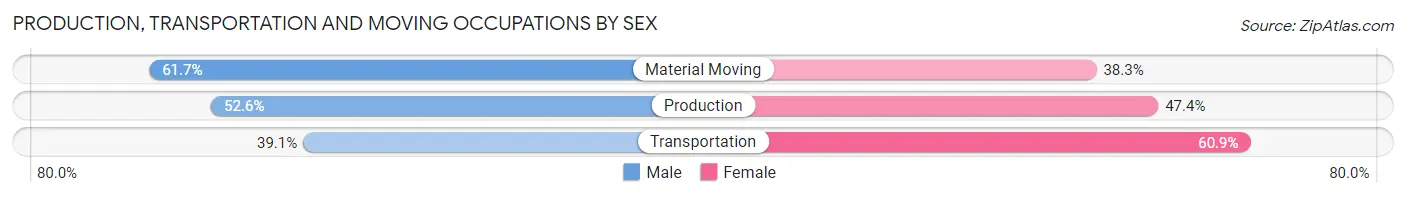
| Occupation | Male | Female |
| Production | 20 (52.6%) | 18 (47.4%) |
| Transportation | 9 (39.1%) | 14 (60.9%) |
| Material Moving | 29 (61.7%) | 18 (38.3%) |
| Total (Category) | 58 (53.7%) | 50 (46.3%) |
| Total (Overall) | 884 (54.9%) | 726 (45.1%) |
Employment Industries by Sex in Maple Heights Lake Desire
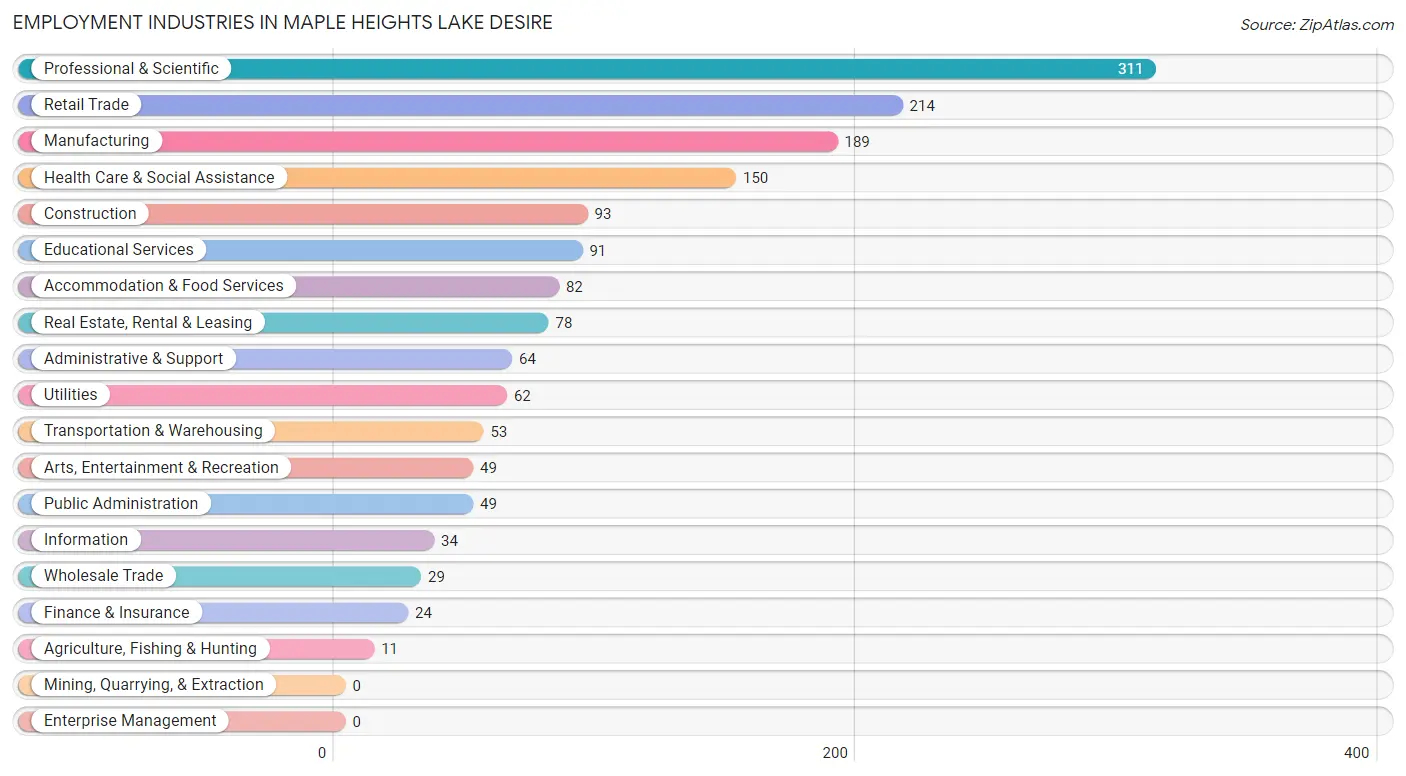
Employment Industries in Maple Heights Lake Desire
The major employment industries in Maple Heights Lake Desire include Professional & Scientific (311 | 19.3%), Retail Trade (214 | 13.3%), Manufacturing (189 | 11.7%), Health Care & Social Assistance (150 | 9.3%), and Construction (93 | 5.8%).
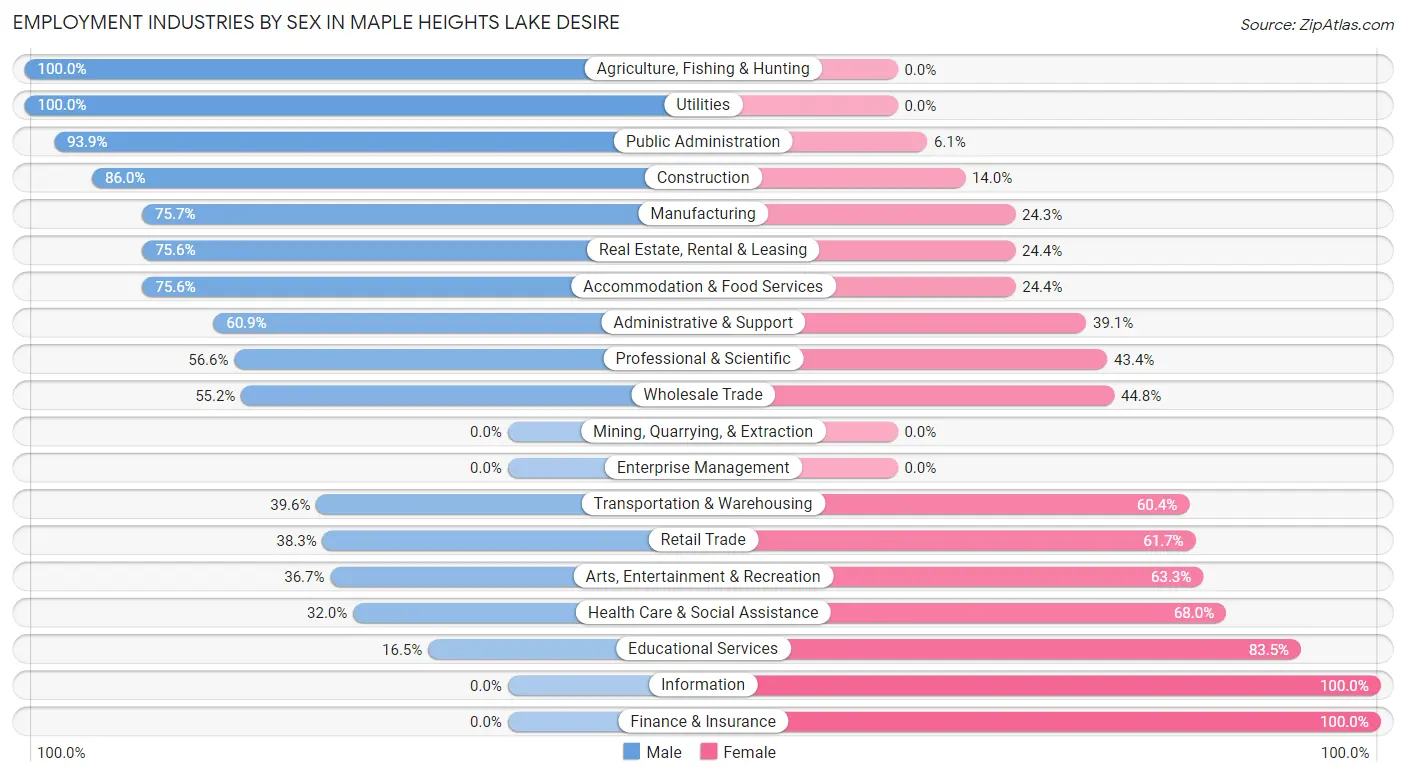
Employment Industries by Sex in Maple Heights Lake Desire
The Maple Heights Lake Desire industries that see more men than women are Agriculture, Fishing & Hunting (100.0%), Utilities (100.0%), and Public Administration (93.9%), whereas the industries that tend to have a higher number of women are Information (100.0%), Finance & Insurance (100.0%), and Educational Services (83.5%).
| Industry | Male | Female |
| Agriculture, Fishing & Hunting | 11 (100.0%) | 0 (0.0%) |
| Mining, Quarrying, & Extraction | 0 (0.0%) | 0 (0.0%) |
| Construction | 80 (86.0%) | 13 (14.0%) |
| Manufacturing | 143 (75.7%) | 46 (24.3%) |
| Wholesale Trade | 16 (55.2%) | 13 (44.8%) |
| Retail Trade | 82 (38.3%) | 132 (61.7%) |
| Transportation & Warehousing | 21 (39.6%) | 32 (60.4%) |
| Utilities | 62 (100.0%) | 0 (0.0%) |
| Information | 0 (0.0%) | 34 (100.0%) |
| Finance & Insurance | 0 (0.0%) | 24 (100.0%) |
| Real Estate, Rental & Leasing | 59 (75.6%) | 19 (24.4%) |
| Professional & Scientific | 176 (56.6%) | 135 (43.4%) |
| Enterprise Management | 0 (0.0%) | 0 (0.0%) |
| Administrative & Support | 39 (60.9%) | 25 (39.1%) |
| Educational Services | 15 (16.5%) | 76 (83.5%) |
| Health Care & Social Assistance | 48 (32.0%) | 102 (68.0%) |
| Arts, Entertainment & Recreation | 18 (36.7%) | 31 (63.3%) |
| Accommodation & Food Services | 62 (75.6%) | 20 (24.4%) |
| Public Administration | 46 (93.9%) | 3 (6.1%) |
| Total | 884 (54.9%) | 726 (45.1%) |
Education in Maple Heights Lake Desire
School Enrollment in Maple Heights Lake Desire
The most common levels of schooling among the 818 students in Maple Heights Lake Desire are high school (223 | 27.3%), middle school (219 | 26.8%), and elementary school (166 | 20.3%).
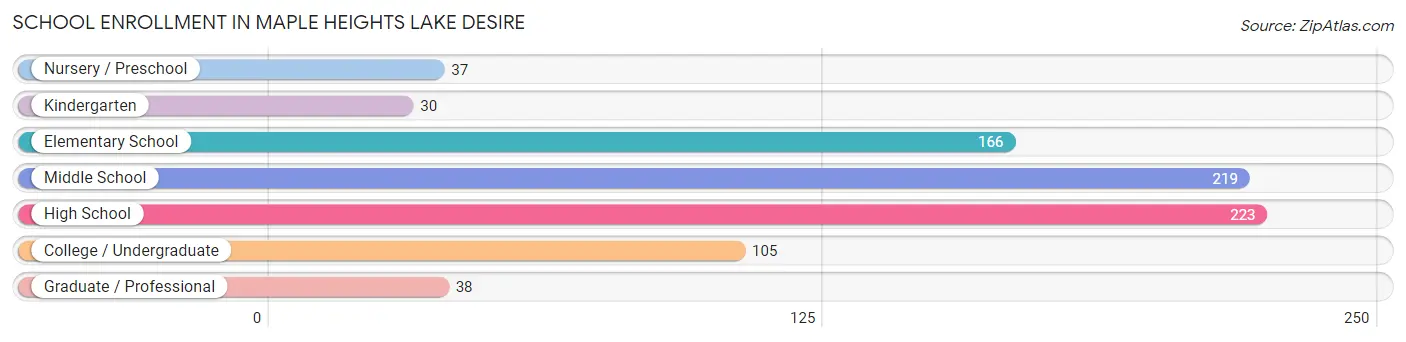
| School Level | # Students | % Students |
| Nursery / Preschool | 37 | 4.5% |
| Kindergarten | 30 | 3.7% |
| Elementary School | 166 | 20.3% |
| Middle School | 219 | 26.8% |
| High School | 223 | 27.3% |
| College / Undergraduate | 105 | 12.8% |
| Graduate / Professional | 38 | 4.6% |
| Total | 818 | 100.0% |
School Enrollment by Age by Funding Source in Maple Heights Lake Desire
Out of a total of 818 students who are enrolled in schools in Maple Heights Lake Desire, 139 (17.0%) attend a private institution, while the remaining 679 (83.0%) are enrolled in public schools. The age group of 3 to 4 year olds has the highest likelihood of being enrolled in private schools, with 37 (100.0% in the age bracket) enrolled. Conversely, the age group of 20 to 24 year olds has the lowest likelihood of being enrolled in a private school, with 42 (97.7% in the age bracket) attending a public institution.
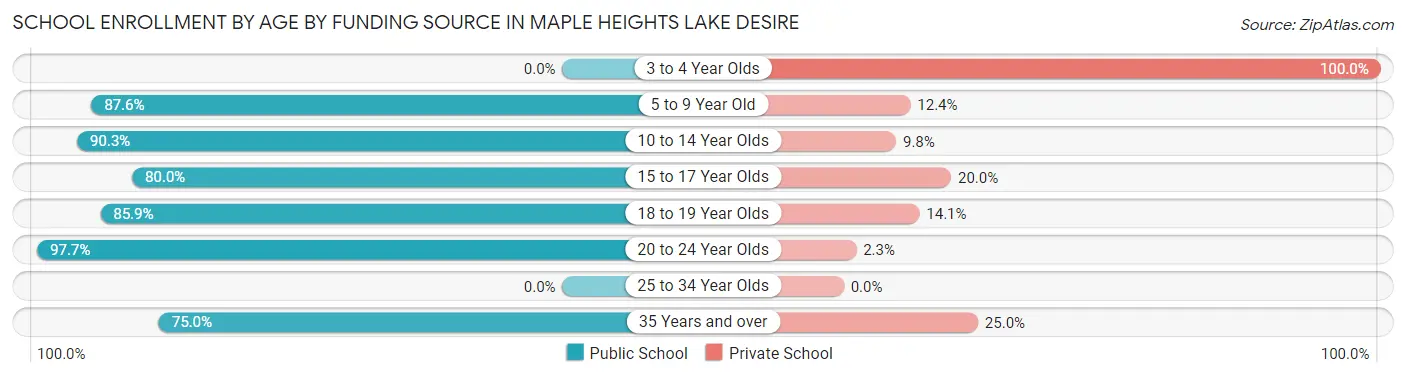
| Age Bracket | Public School | Private School |
| 3 to 4 Year Olds | 0 (0.0%) | 37 (100.0%) |
| 5 to 9 Year Old | 141 (87.6%) | 20 (12.4%) |
| 10 to 14 Year Olds | 287 (90.2%) | 31 (9.8%) |
| 15 to 17 Year Olds | 100 (80.0%) | 25 (20.0%) |
| 18 to 19 Year Olds | 67 (85.9%) | 11 (14.1%) |
| 20 to 24 Year Olds | 42 (97.7%) | 1 (2.3%) |
| 25 to 34 Year Olds | 0 (0.0%) | 0 (0.0%) |
| 35 Years and over | 42 (75.0%) | 14 (25.0%) |
| Total | 679 (83.0%) | 139 (17.0%) |
Educational Attainment by Field of Study in Maple Heights Lake Desire
Business (244 | 20.6%), social sciences (133 | 11.2%), engineering (109 | 9.2%), science & technology (105 | 8.8%), and arts & humanities (85 | 7.2%) are the most common fields of study among 1,187 individuals in Maple Heights Lake Desire who have obtained a bachelor's degree or higher.
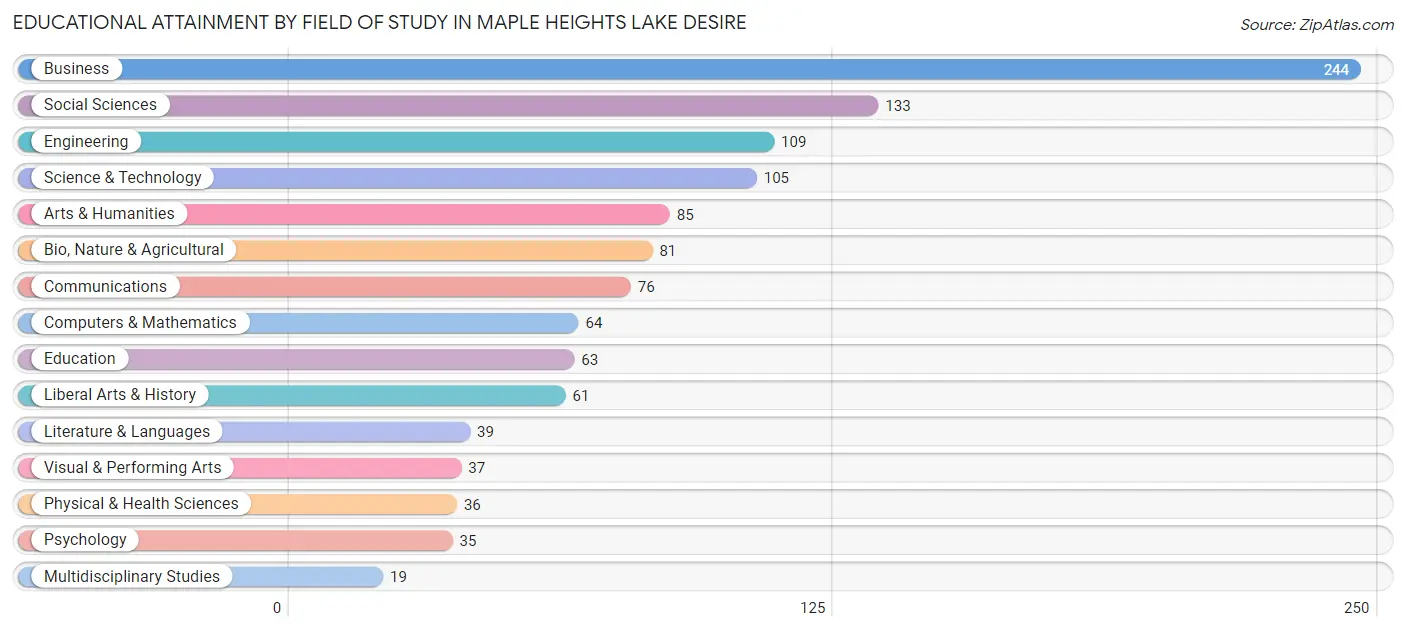
| Field of Study | # Graduates | % Graduates |
| Computers & Mathematics | 64 | 5.4% |
| Bio, Nature & Agricultural | 81 | 6.8% |
| Physical & Health Sciences | 36 | 3.0% |
| Psychology | 35 | 2.9% |
| Social Sciences | 133 | 11.2% |
| Engineering | 109 | 9.2% |
| Multidisciplinary Studies | 19 | 1.6% |
| Science & Technology | 105 | 8.8% |
| Business | 244 | 20.6% |
| Education | 63 | 5.3% |
| Literature & Languages | 39 | 3.3% |
| Liberal Arts & History | 61 | 5.1% |
| Visual & Performing Arts | 37 | 3.1% |
| Communications | 76 | 6.4% |
| Arts & Humanities | 85 | 7.2% |
| Total | 1,187 | 100.0% |
Transportation & Commute in Maple Heights Lake Desire
Vehicle Availability by Sex in Maple Heights Lake Desire
The most prevalent vehicle ownership categories in Maple Heights Lake Desire are males with 2 vehicles (392, accounting for 44.4%) and females with 2 vehicles (333, making up 54.4%).
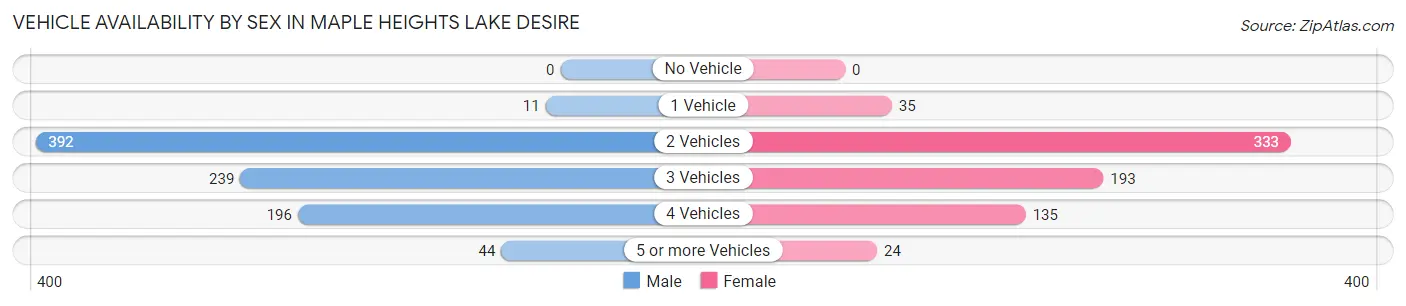
| Vehicles Available | Male | Female |
| No Vehicle | 0 (0.0%) | 0 (0.0%) |
| 1 Vehicle | 11 (1.3%) | 35 (4.9%) |
| 2 Vehicles | 392 (44.4%) | 333 (46.3%) |
| 3 Vehicles | 239 (27.1%) | 193 (26.8%) |
| 4 Vehicles | 196 (22.2%) | 135 (18.8%) |
| 5 or more Vehicles | 44 (5.0%) | 24 (3.3%) |
| Total | 882 (100.0%) | 720 (100.0%) |
Commute Time in Maple Heights Lake Desire
The most frequently occuring commute durations in Maple Heights Lake Desire are 30 to 34 minutes (331 commuters, 24.4%), 45 to 59 minutes (239 commuters, 17.6%), and 20 to 24 minutes (214 commuters, 15.8%).
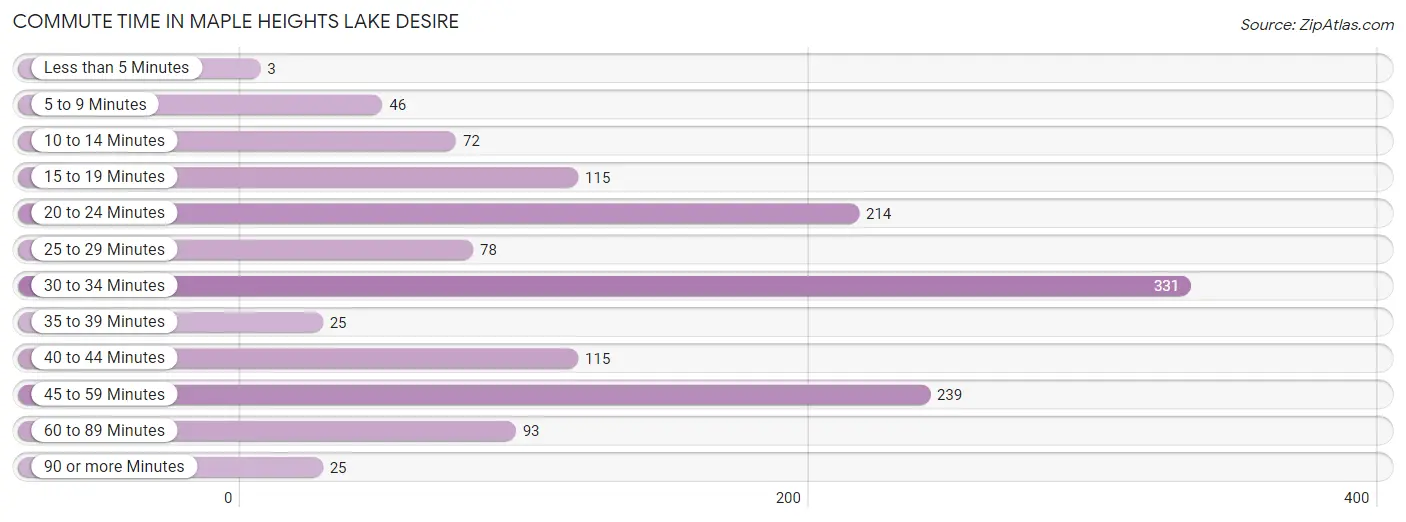
| Commute Time | # Commuters | % Commuters |
| Less than 5 Minutes | 3 | 0.2% |
| 5 to 9 Minutes | 46 | 3.4% |
| 10 to 14 Minutes | 72 | 5.3% |
| 15 to 19 Minutes | 115 | 8.5% |
| 20 to 24 Minutes | 214 | 15.8% |
| 25 to 29 Minutes | 78 | 5.8% |
| 30 to 34 Minutes | 331 | 24.4% |
| 35 to 39 Minutes | 25 | 1.8% |
| 40 to 44 Minutes | 115 | 8.5% |
| 45 to 59 Minutes | 239 | 17.6% |
| 60 to 89 Minutes | 93 | 6.9% |
| 90 or more Minutes | 25 | 1.8% |
Commute Time by Sex in Maple Heights Lake Desire
The most common commute times in Maple Heights Lake Desire are 30 to 34 minutes (213 commuters, 27.8%) for males and 20 to 24 minutes (118 commuters, 20.0%) for females.
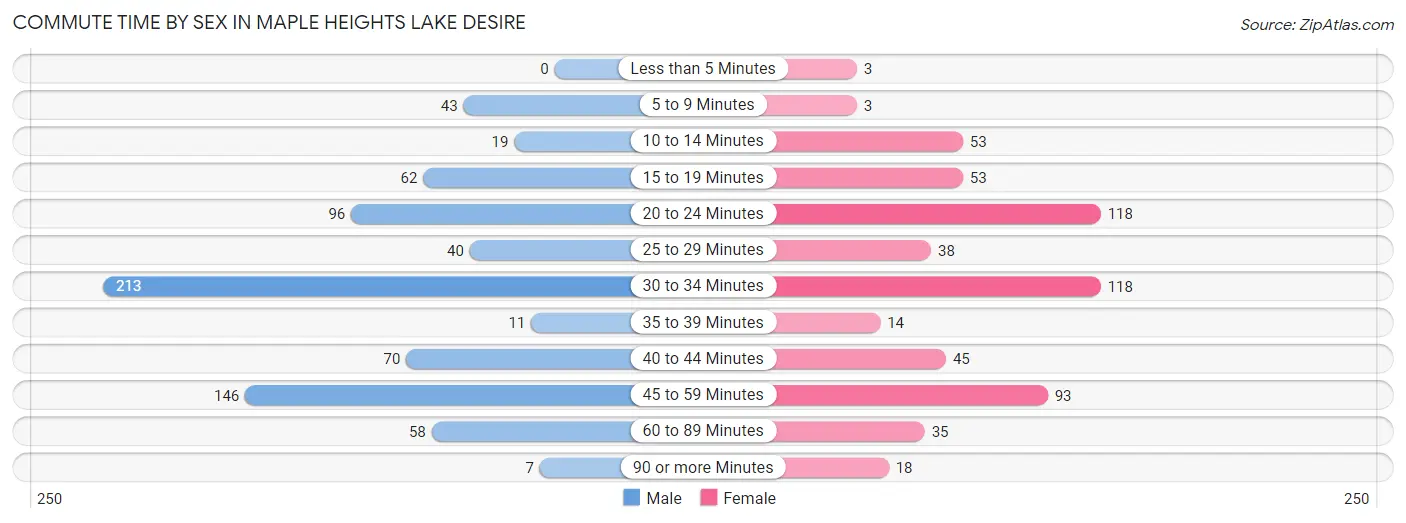
| Commute Time | Male | Female |
| Less than 5 Minutes | 0 (0.0%) | 3 (0.5%) |
| 5 to 9 Minutes | 43 (5.6%) | 3 (0.5%) |
| 10 to 14 Minutes | 19 (2.5%) | 53 (9.0%) |
| 15 to 19 Minutes | 62 (8.1%) | 53 (9.0%) |
| 20 to 24 Minutes | 96 (12.6%) | 118 (20.0%) |
| 25 to 29 Minutes | 40 (5.2%) | 38 (6.4%) |
| 30 to 34 Minutes | 213 (27.8%) | 118 (20.0%) |
| 35 to 39 Minutes | 11 (1.4%) | 14 (2.4%) |
| 40 to 44 Minutes | 70 (9.1%) | 45 (7.6%) |
| 45 to 59 Minutes | 146 (19.1%) | 93 (15.7%) |
| 60 to 89 Minutes | 58 (7.6%) | 35 (5.9%) |
| 90 or more Minutes | 7 (0.9%) | 18 (3.0%) |
Time of Departure to Work by Sex in Maple Heights Lake Desire
The most frequent times of departure to work in Maple Heights Lake Desire are 6:00 AM to 6:29 AM (122, 16.0%) for males and 6:00 AM to 6:29 AM (166, 28.1%) for females.
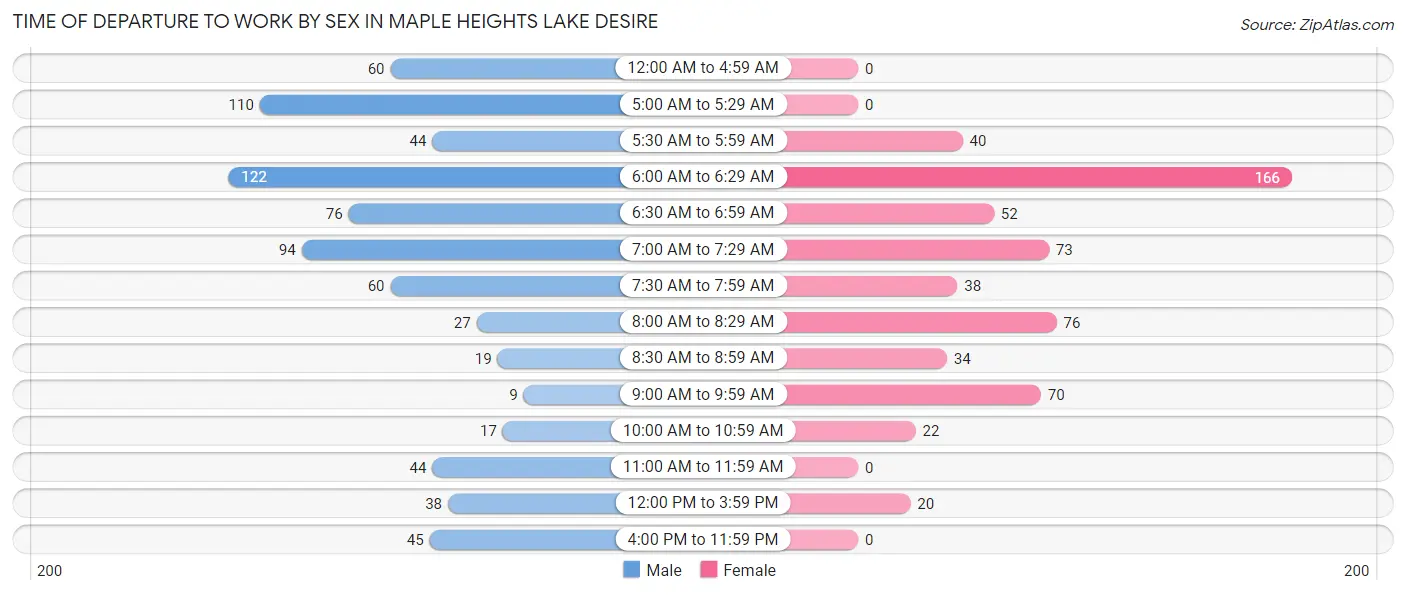
| Time of Departure | Male | Female |
| 12:00 AM to 4:59 AM | 60 (7.8%) | 0 (0.0%) |
| 5:00 AM to 5:29 AM | 110 (14.4%) | 0 (0.0%) |
| 5:30 AM to 5:59 AM | 44 (5.8%) | 40 (6.8%) |
| 6:00 AM to 6:29 AM | 122 (16.0%) | 166 (28.1%) |
| 6:30 AM to 6:59 AM | 76 (9.9%) | 52 (8.8%) |
| 7:00 AM to 7:29 AM | 94 (12.3%) | 73 (12.3%) |
| 7:30 AM to 7:59 AM | 60 (7.8%) | 38 (6.4%) |
| 8:00 AM to 8:29 AM | 27 (3.5%) | 76 (12.9%) |
| 8:30 AM to 8:59 AM | 19 (2.5%) | 34 (5.8%) |
| 9:00 AM to 9:59 AM | 9 (1.2%) | 70 (11.8%) |
| 10:00 AM to 10:59 AM | 17 (2.2%) | 22 (3.7%) |
| 11:00 AM to 11:59 AM | 44 (5.8%) | 0 (0.0%) |
| 12:00 PM to 3:59 PM | 38 (5.0%) | 20 (3.4%) |
| 4:00 PM to 11:59 PM | 45 (5.9%) | 0 (0.0%) |
| Total | 765 (100.0%) | 591 (100.0%) |
Housing Occupancy in Maple Heights Lake Desire
Occupancy by Ownership in Maple Heights Lake Desire
Of the total 1,206 dwellings in Maple Heights Lake Desire, owner-occupied units account for 1,088 (90.2%), while renter-occupied units make up 118 (9.8%).
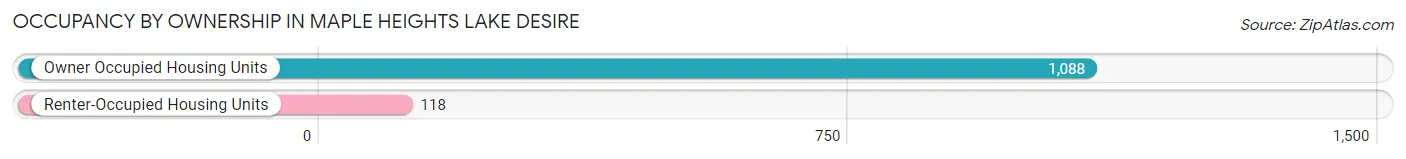
| Occupancy | # Housing Units | % Housing Units |
| Owner Occupied Housing Units | 1,088 | 90.2% |
| Renter-Occupied Housing Units | 118 | 9.8% |
| Total Occupied Housing Units | 1,206 | 100.0% |
Occupancy by Household Size in Maple Heights Lake Desire
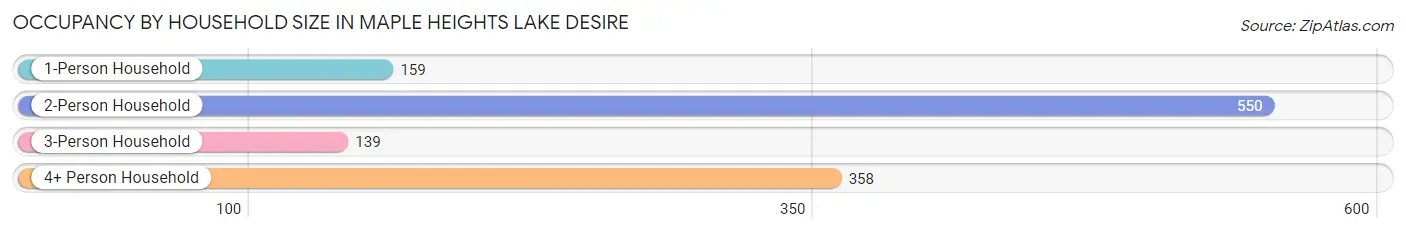
| Household Size | # Housing Units | % Housing Units |
| 1-Person Household | 159 | 13.2% |
| 2-Person Household | 550 | 45.6% |
| 3-Person Household | 139 | 11.5% |
| 4+ Person Household | 358 | 29.7% |
| Total Housing Units | 1,206 | 100.0% |
Occupancy by Ownership by Household Size in Maple Heights Lake Desire
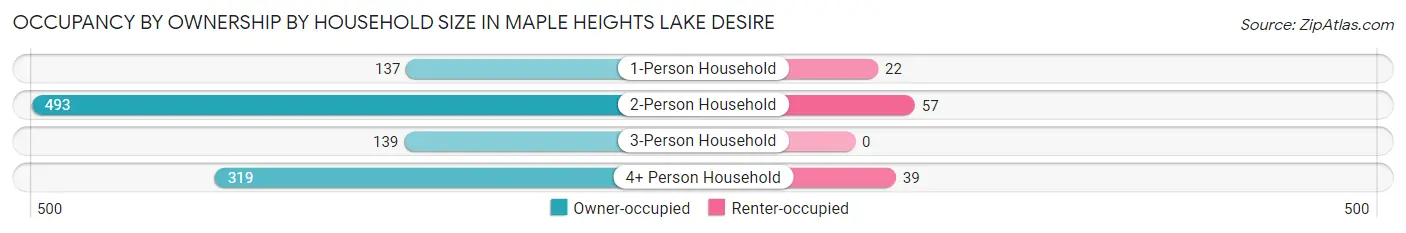
| Household Size | Owner-occupied | Renter-occupied |
| 1-Person Household | 137 (86.2%) | 22 (13.8%) |
| 2-Person Household | 493 (89.6%) | 57 (10.4%) |
| 3-Person Household | 139 (100.0%) | 0 (0.0%) |
| 4+ Person Household | 319 (89.1%) | 39 (10.9%) |
| Total Housing Units | 1,088 (90.2%) | 118 (9.8%) |
Occupancy by Educational Attainment in Maple Heights Lake Desire
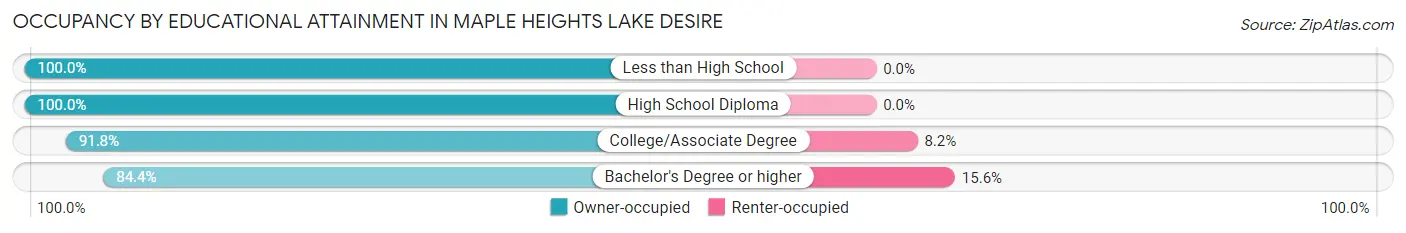
| Household Size | Owner-occupied | Renter-occupied |
| Less than High School | 38 (100.0%) | 0 (0.0%) |
| High School Diploma | 215 (100.0%) | 0 (0.0%) |
| College/Associate Degree | 381 (91.8%) | 34 (8.2%) |
| Bachelor's Degree or higher | 454 (84.4%) | 84 (15.6%) |
Occupancy by Age of Householder in Maple Heights Lake Desire
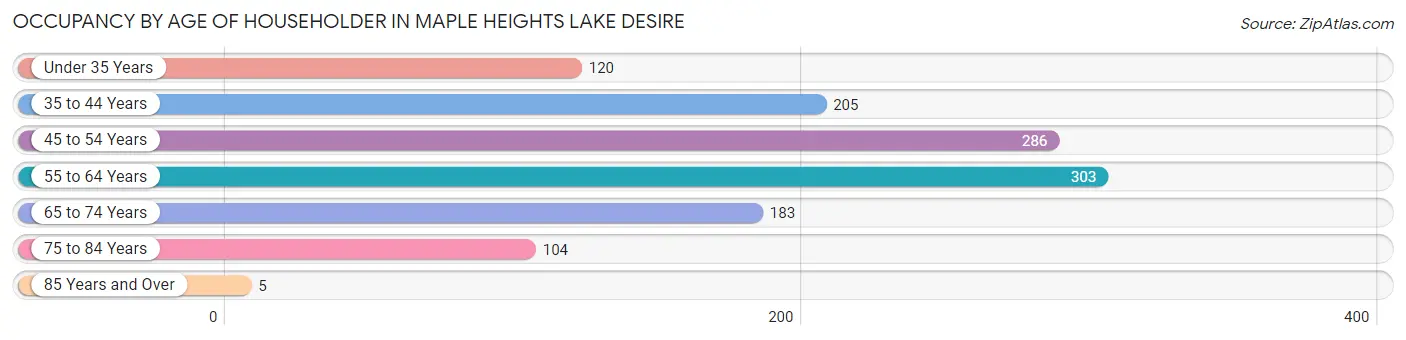
| Age Bracket | # Households | % Households |
| Under 35 Years | 120 | 10.0% |
| 35 to 44 Years | 205 | 17.0% |
| 45 to 54 Years | 286 | 23.7% |
| 55 to 64 Years | 303 | 25.1% |
| 65 to 74 Years | 183 | 15.2% |
| 75 to 84 Years | 104 | 8.6% |
| 85 Years and Over | 5 | 0.4% |
| Total | 1,206 | 100.0% |
Housing Finances in Maple Heights Lake Desire
Median Income by Occupancy in Maple Heights Lake Desire
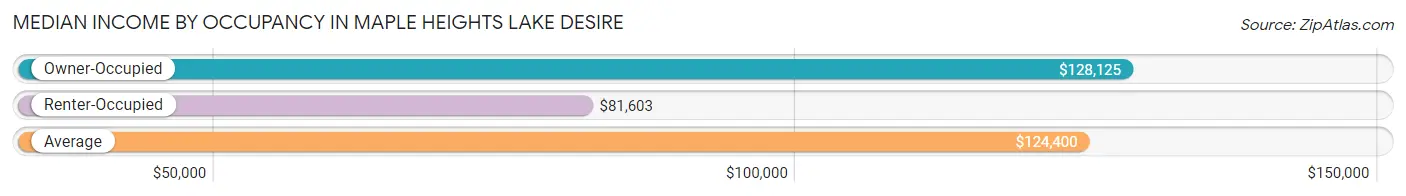
| Occupancy Type | # Households | Median Income |
| Owner-Occupied | 1,088 (90.2%) | $128,125 |
| Renter-Occupied | 118 (9.8%) | $81,603 |
| Average | 1,206 (100.0%) | $124,400 |
Occupancy by Householder Income Bracket in Maple Heights Lake Desire
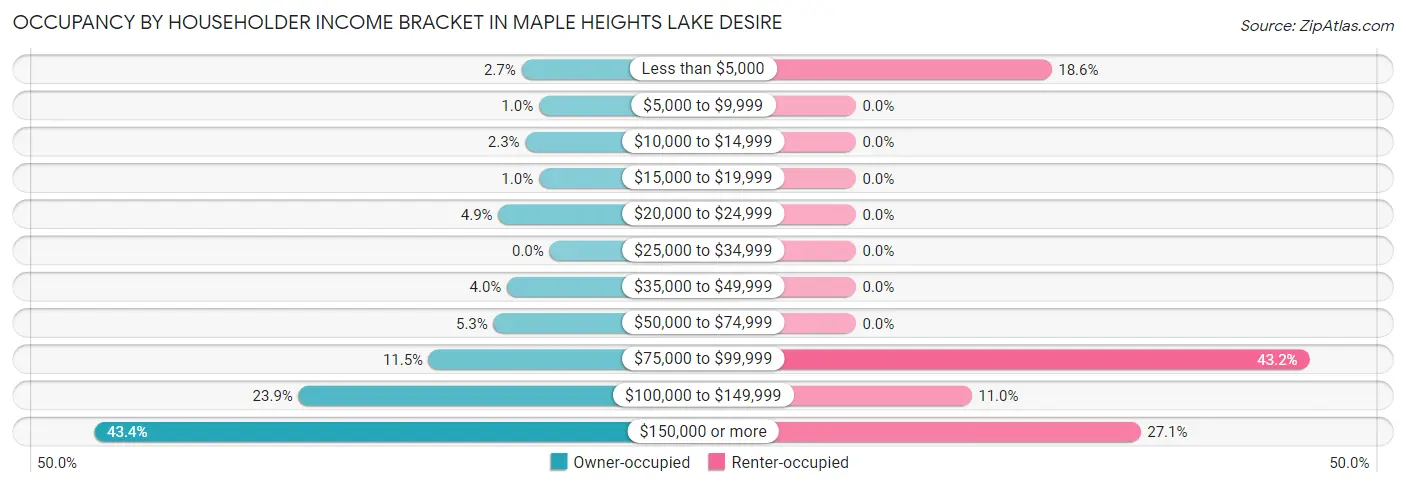
| Income Bracket | Owner-occupied | Renter-occupied |
| Less than $5,000 | 29 (2.7%) | 22 (18.6%) |
| $5,000 to $9,999 | 11 (1.0%) | 0 (0.0%) |
| $10,000 to $14,999 | 25 (2.3%) | 0 (0.0%) |
| $15,000 to $19,999 | 11 (1.0%) | 0 (0.0%) |
| $20,000 to $24,999 | 53 (4.9%) | 0 (0.0%) |
| $25,000 to $34,999 | 0 (0.0%) | 0 (0.0%) |
| $35,000 to $49,999 | 44 (4.0%) | 0 (0.0%) |
| $50,000 to $74,999 | 58 (5.3%) | 0 (0.0%) |
| $75,000 to $99,999 | 125 (11.5%) | 51 (43.2%) |
| $100,000 to $149,999 | 260 (23.9%) | 13 (11.0%) |
| $150,000 or more | 472 (43.4%) | 32 (27.1%) |
| Total | 1,088 (100.0%) | 118 (100.0%) |
Monthly Housing Cost Tiers in Maple Heights Lake Desire
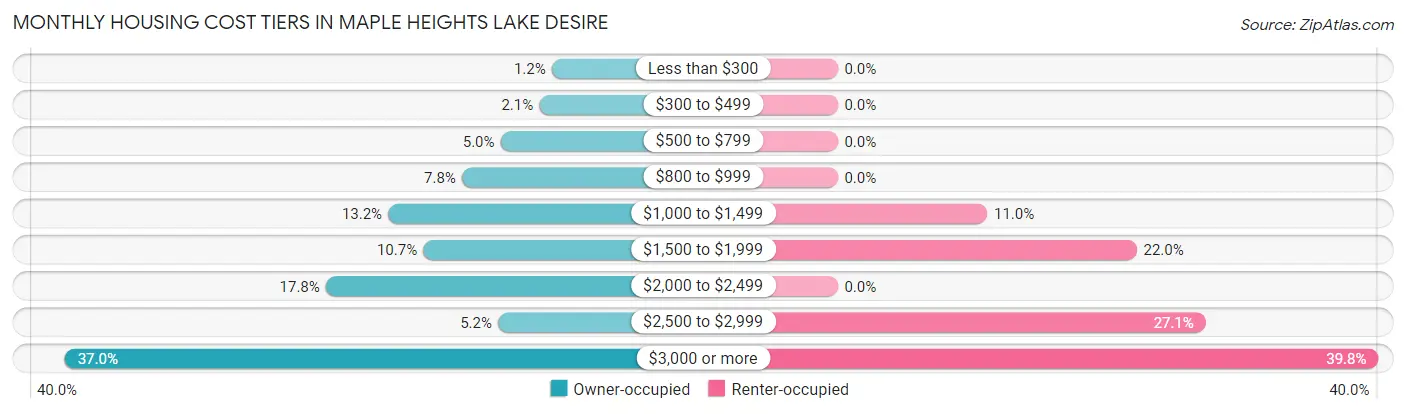
| Monthly Cost | Owner-occupied | Renter-occupied |
| Less than $300 | 13 (1.2%) | 0 (0.0%) |
| $300 to $499 | 23 (2.1%) | 0 (0.0%) |
| $500 to $799 | 54 (5.0%) | 0 (0.0%) |
| $800 to $999 | 85 (7.8%) | 0 (0.0%) |
| $1,000 to $1,499 | 144 (13.2%) | 13 (11.0%) |
| $1,500 to $1,999 | 116 (10.7%) | 26 (22.0%) |
| $2,000 to $2,499 | 194 (17.8%) | 0 (0.0%) |
| $2,500 to $2,999 | 56 (5.1%) | 32 (27.1%) |
| $3,000 or more | 403 (37.0%) | 47 (39.8%) |
| Total | 1,088 (100.0%) | 118 (100.0%) |
Physical Housing Characteristics in Maple Heights Lake Desire
Housing Structures in Maple Heights Lake Desire
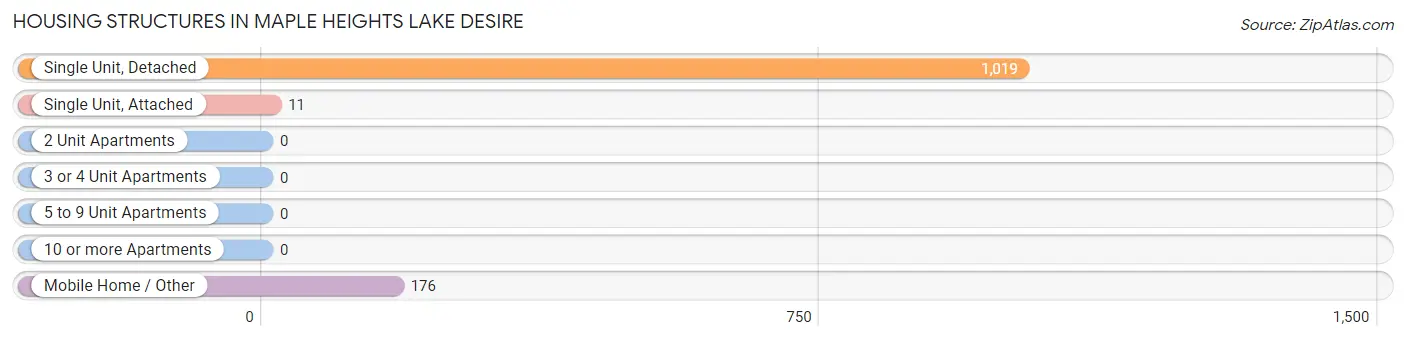
| Structure Type | # Housing Units | % Housing Units |
| Single Unit, Detached | 1,019 | 84.5% |
| Single Unit, Attached | 11 | 0.9% |
| 2 Unit Apartments | 0 | 0.0% |
| 3 or 4 Unit Apartments | 0 | 0.0% |
| 5 to 9 Unit Apartments | 0 | 0.0% |
| 10 or more Apartments | 0 | 0.0% |
| Mobile Home / Other | 176 | 14.6% |
| Total | 1,206 | 100.0% |
Housing Structures by Occupancy in Maple Heights Lake Desire
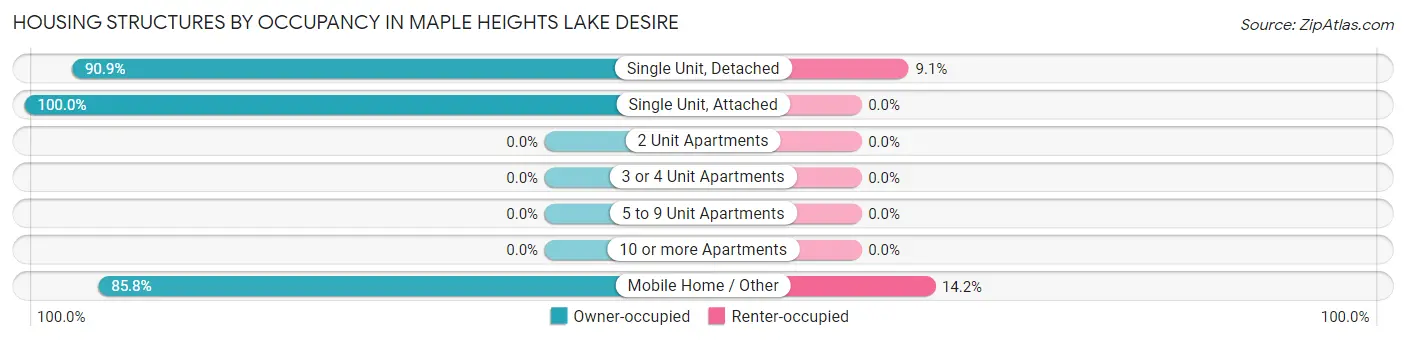
| Structure Type | Owner-occupied | Renter-occupied |
| Single Unit, Detached | 926 (90.9%) | 93 (9.1%) |
| Single Unit, Attached | 11 (100.0%) | 0 (0.0%) |
| 2 Unit Apartments | 0 (0.0%) | 0 (0.0%) |
| 3 or 4 Unit Apartments | 0 (0.0%) | 0 (0.0%) |
| 5 to 9 Unit Apartments | 0 (0.0%) | 0 (0.0%) |
| 10 or more Apartments | 0 (0.0%) | 0 (0.0%) |
| Mobile Home / Other | 151 (85.8%) | 25 (14.2%) |
| Total | 1,088 (90.2%) | 118 (9.8%) |
Housing Structures by Number of Rooms in Maple Heights Lake Desire
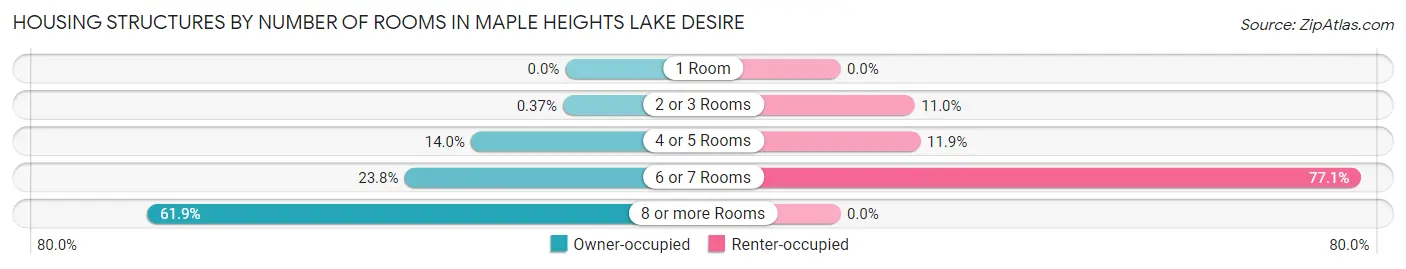
| Number of Rooms | Owner-occupied | Renter-occupied |
| 1 Room | 0 (0.0%) | 0 (0.0%) |
| 2 or 3 Rooms | 4 (0.4%) | 13 (11.0%) |
| 4 or 5 Rooms | 152 (14.0%) | 14 (11.9%) |
| 6 or 7 Rooms | 259 (23.8%) | 91 (77.1%) |
| 8 or more Rooms | 673 (61.9%) | 0 (0.0%) |
| Total | 1,088 (100.0%) | 118 (100.0%) |
Housing Structure by Heating Type in Maple Heights Lake Desire
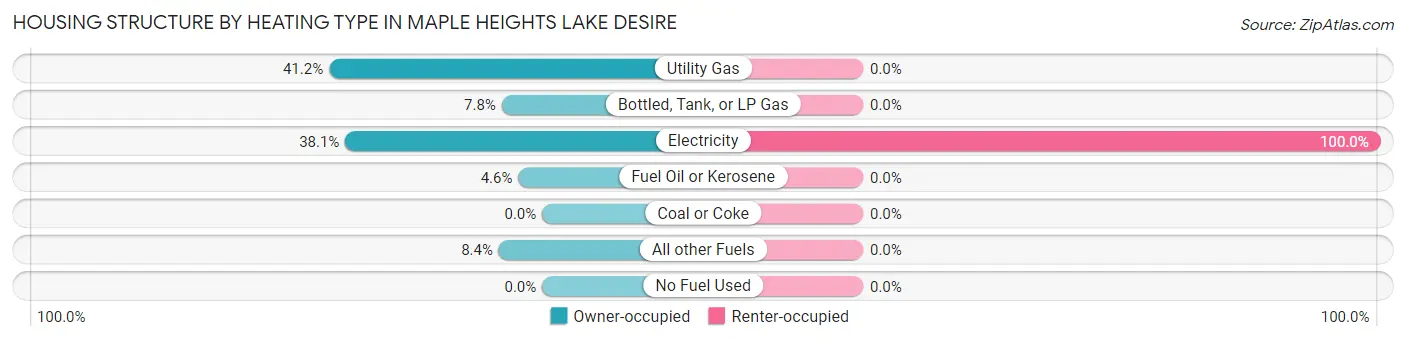
| Heating Type | Owner-occupied | Renter-occupied |
| Utility Gas | 448 (41.2%) | 0 (0.0%) |
| Bottled, Tank, or LP Gas | 85 (7.8%) | 0 (0.0%) |
| Electricity | 414 (38.1%) | 118 (100.0%) |
| Fuel Oil or Kerosene | 50 (4.6%) | 0 (0.0%) |
| Coal or Coke | 0 (0.0%) | 0 (0.0%) |
| All other Fuels | 91 (8.4%) | 0 (0.0%) |
| No Fuel Used | 0 (0.0%) | 0 (0.0%) |
| Total | 1,088 (100.0%) | 118 (100.0%) |
Household Vehicle Usage in Maple Heights Lake Desire
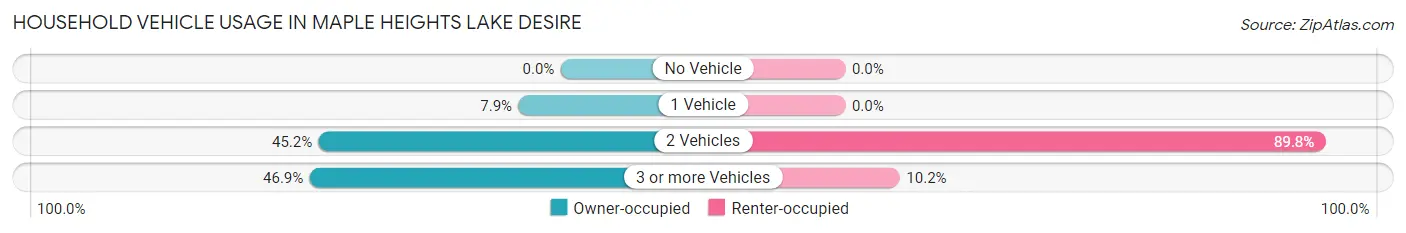
| Vehicles per Household | Owner-occupied | Renter-occupied |
| No Vehicle | 0 (0.0%) | 0 (0.0%) |
| 1 Vehicle | 86 (7.9%) | 0 (0.0%) |
| 2 Vehicles | 492 (45.2%) | 106 (89.8%) |
| 3 or more Vehicles | 510 (46.9%) | 12 (10.2%) |
| Total | 1,088 (100.0%) | 118 (100.0%) |
Real Estate & Mortgages in Maple Heights Lake Desire
Real Estate and Mortgage Overview in Maple Heights Lake Desire
| Characteristic | Without Mortgage | With Mortgage |
| Housing Units | 334 | 754 |
| Median Property Value | $676,700 | $714,600 |
| Median Household Income | $115,000 | $345 |
| Monthly Housing Costs | $974 | $403 |
| Real Estate Taxes | $7,522 | $11 |
Property Value by Mortgage Status in Maple Heights Lake Desire
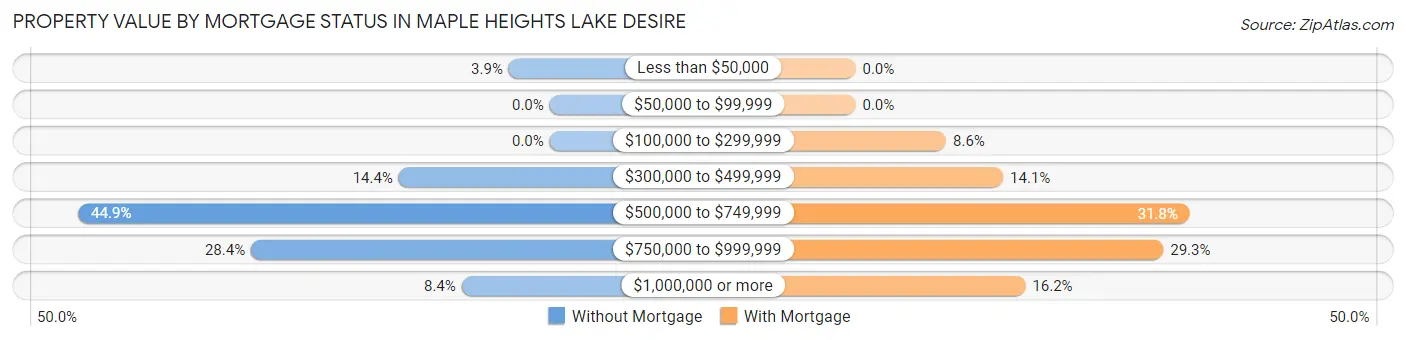
| Property Value | Without Mortgage | With Mortgage |
| Less than $50,000 | 13 (3.9%) | 0 (0.0%) |
| $50,000 to $99,999 | 0 (0.0%) | 0 (0.0%) |
| $100,000 to $299,999 | 0 (0.0%) | 65 (8.6%) |
| $300,000 to $499,999 | 48 (14.4%) | 106 (14.1%) |
| $500,000 to $749,999 | 150 (44.9%) | 240 (31.8%) |
| $750,000 to $999,999 | 95 (28.4%) | 221 (29.3%) |
| $1,000,000 or more | 28 (8.4%) | 122 (16.2%) |
| Total | 334 (100.0%) | 754 (100.0%) |
Household Income by Mortgage Status in Maple Heights Lake Desire
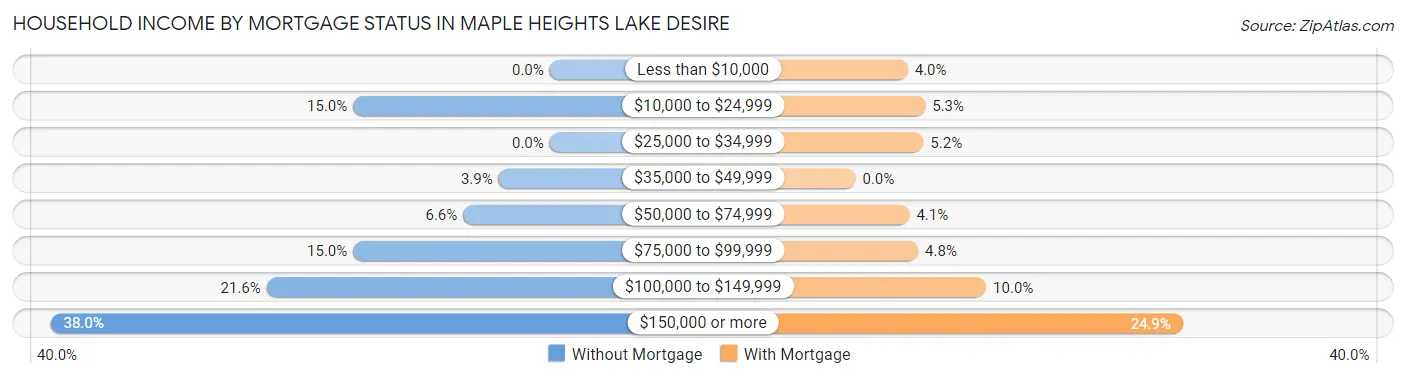
| Household Income | Without Mortgage | With Mortgage |
| Less than $10,000 | 0 (0.0%) | 30 (4.0%) |
| $10,000 to $24,999 | 50 (15.0%) | 40 (5.3%) |
| $25,000 to $34,999 | 0 (0.0%) | 39 (5.2%) |
| $35,000 to $49,999 | 13 (3.9%) | 0 (0.0%) |
| $50,000 to $74,999 | 22 (6.6%) | 31 (4.1%) |
| $75,000 to $99,999 | 50 (15.0%) | 36 (4.8%) |
| $100,000 to $149,999 | 72 (21.6%) | 75 (10.0%) |
| $150,000 or more | 127 (38.0%) | 188 (24.9%) |
| Total | 334 (100.0%) | 754 (100.0%) |
Property Value to Household Income Ratio in Maple Heights Lake Desire
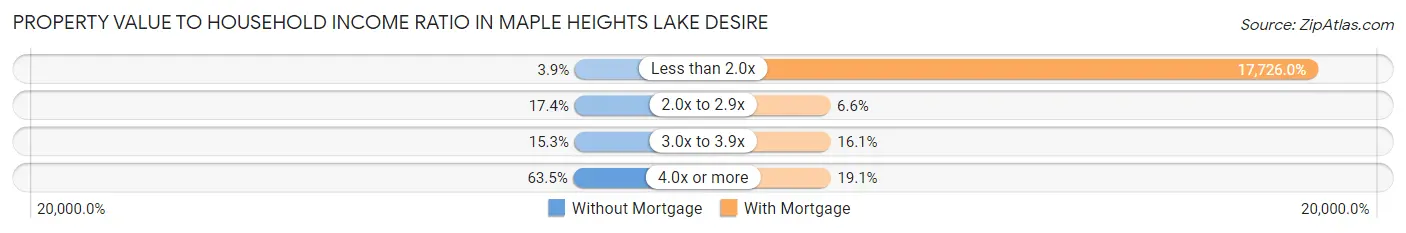
| Value-to-Income Ratio | Without Mortgage | With Mortgage |
| Less than 2.0x | 13 (3.9%) | 133,654 (17,726.0%) |
| 2.0x to 2.9x | 58 (17.4%) | 50 (6.6%) |
| 3.0x to 3.9x | 51 (15.3%) | 121 (16.1%) |
| 4.0x or more | 212 (63.5%) | 144 (19.1%) |
| Total | 334 (100.0%) | 754 (100.0%) |
Real Estate Taxes by Mortgage Status in Maple Heights Lake Desire
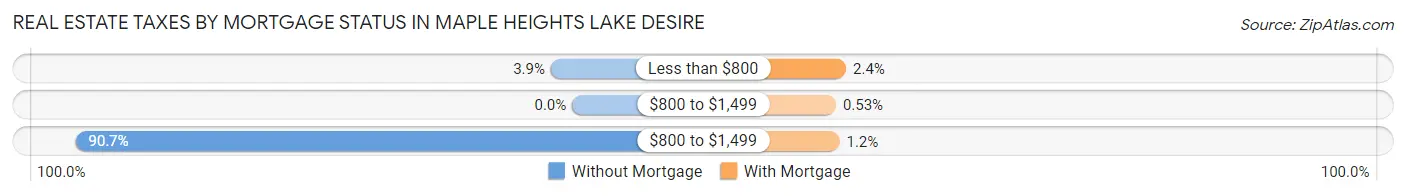
| Property Taxes | Without Mortgage | With Mortgage |
| Less than $800 | 13 (3.9%) | 18 (2.4%) |
| $800 to $1,499 | 0 (0.0%) | 4 (0.5%) |
| $800 to $1,499 | 303 (90.7%) | 9 (1.2%) |
| Total | 334 (100.0%) | 754 (100.0%) |
Health & Disability in Maple Heights Lake Desire
Health Insurance Coverage by Age in Maple Heights Lake Desire
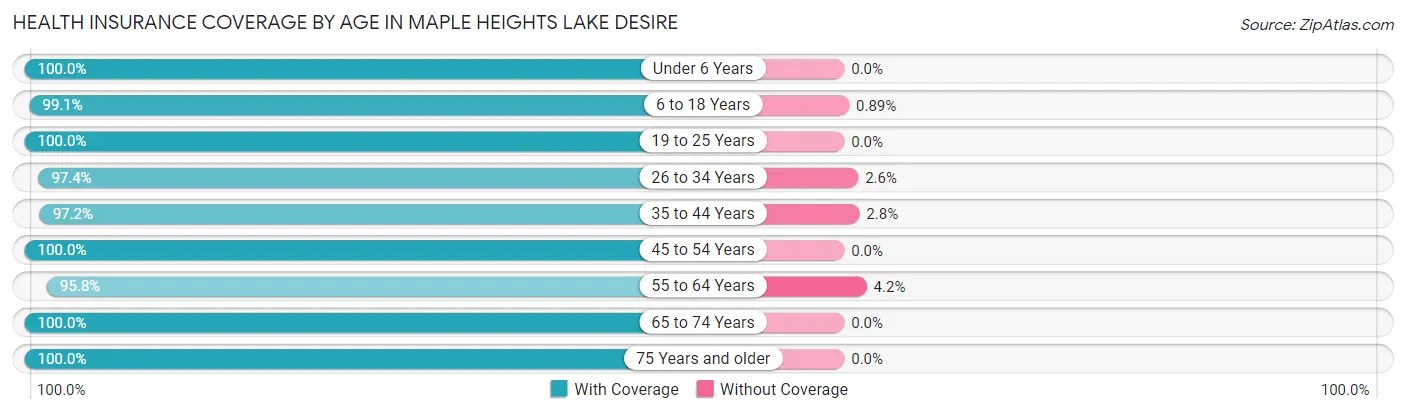
| Age Bracket | With Coverage | Without Coverage |
| Under 6 Years | 164 (100.0%) | 0 (0.0%) |
| 6 to 18 Years | 666 (99.1%) | 6 (0.9%) |
| 19 to 25 Years | 91 (100.0%) | 0 (0.0%) |
| 26 to 34 Years | 226 (97.4%) | 6 (2.6%) |
| 35 to 44 Years | 482 (97.2%) | 14 (2.8%) |
| 45 to 54 Years | 637 (100.0%) | 0 (0.0%) |
| 55 to 64 Years | 575 (95.8%) | 25 (4.2%) |
| 65 to 74 Years | 333 (100.0%) | 0 (0.0%) |
| 75 Years and older | 195 (100.0%) | 0 (0.0%) |
| Total | 3,369 (98.5%) | 51 (1.5%) |
Health Insurance Coverage by Citizenship Status in Maple Heights Lake Desire
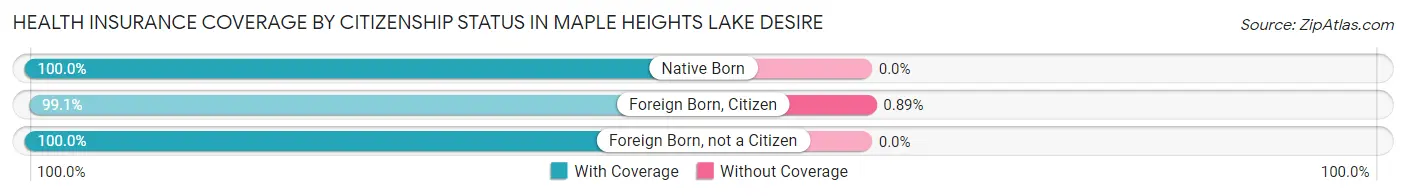
| Citizenship Status | With Coverage | Without Coverage |
| Native Born | 164 (100.0%) | 0 (0.0%) |
| Foreign Born, Citizen | 666 (99.1%) | 6 (0.9%) |
| Foreign Born, not a Citizen | 91 (100.0%) | 0 (0.0%) |
Health Insurance Coverage by Household Income in Maple Heights Lake Desire
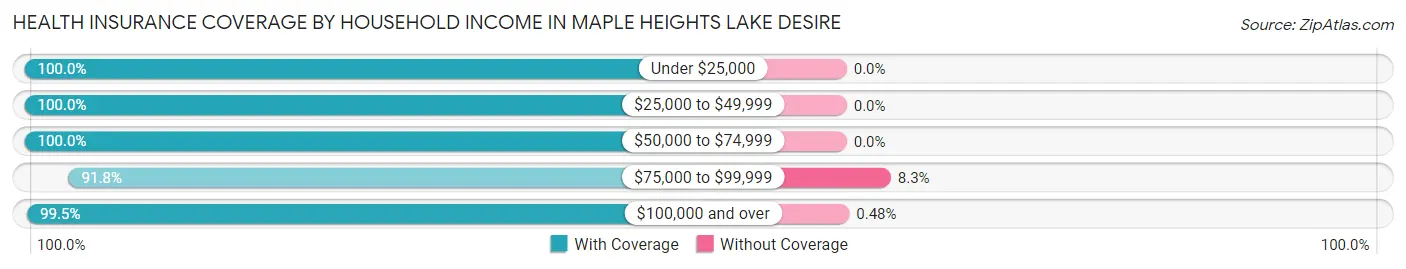
| Household Income | With Coverage | Without Coverage |
| Under $25,000 | 225 (100.0%) | 0 (0.0%) |
| $25,000 to $49,999 | 119 (100.0%) | 0 (0.0%) |
| $50,000 to $74,999 | 86 (100.0%) | 0 (0.0%) |
| $75,000 to $99,999 | 434 (91.7%) | 39 (8.3%) |
| $100,000 and over | 2,499 (99.5%) | 12 (0.5%) |
Public vs Private Health Insurance Coverage by Age in Maple Heights Lake Desire
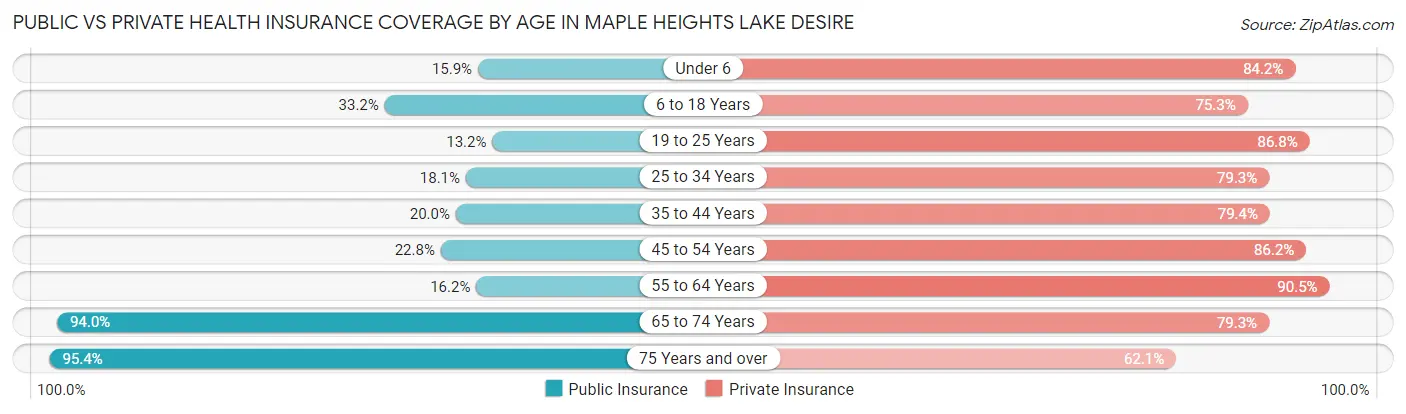
| Age Bracket | Public Insurance | Private Insurance |
| Under 6 | 26 (15.9%) | 138 (84.2%) |
| 6 to 18 Years | 223 (33.2%) | 506 (75.3%) |
| 19 to 25 Years | 12 (13.2%) | 79 (86.8%) |
| 25 to 34 Years | 42 (18.1%) | 184 (79.3%) |
| 35 to 44 Years | 99 (20.0%) | 394 (79.4%) |
| 45 to 54 Years | 145 (22.8%) | 549 (86.2%) |
| 55 to 64 Years | 97 (16.2%) | 543 (90.5%) |
| 65 to 74 Years | 313 (94.0%) | 264 (79.3%) |
| 75 Years and over | 186 (95.4%) | 121 (62.1%) |
| Total | 1,143 (33.4%) | 2,778 (81.2%) |
Disability Status by Sex by Age in Maple Heights Lake Desire
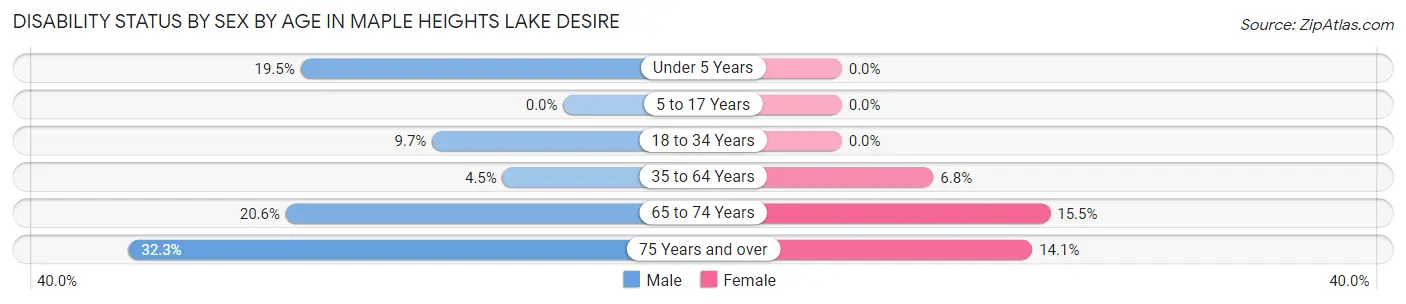
| Age Bracket | Male | Female |
| Under 5 Years | 16 (19.5%) | 0 (0.0%) |
| 5 to 17 Years | 0 (0.0%) | 0 (0.0%) |
| 18 to 34 Years | 19 (9.7%) | 0 (0.0%) |
| 35 to 64 Years | 41 (4.5%) | 56 (6.8%) |
| 65 to 74 Years | 34 (20.6%) | 26 (15.5%) |
| 75 Years and over | 31 (32.3%) | 14 (14.1%) |
Disability Class by Sex by Age in Maple Heights Lake Desire
Disability Class: Hearing Difficulty
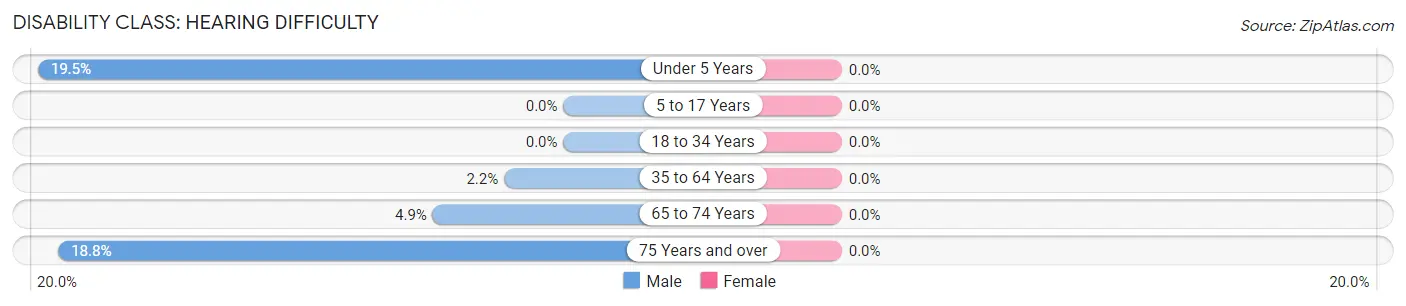
| Age Bracket | Male | Female |
| Under 5 Years | 16 (19.5%) | 0 (0.0%) |
| 5 to 17 Years | 0 (0.0%) | 0 (0.0%) |
| 18 to 34 Years | 0 (0.0%) | 0 (0.0%) |
| 35 to 64 Years | 20 (2.2%) | 0 (0.0%) |
| 65 to 74 Years | 8 (4.9%) | 0 (0.0%) |
| 75 Years and over | 18 (18.8%) | 0 (0.0%) |
Disability Class: Vision Difficulty
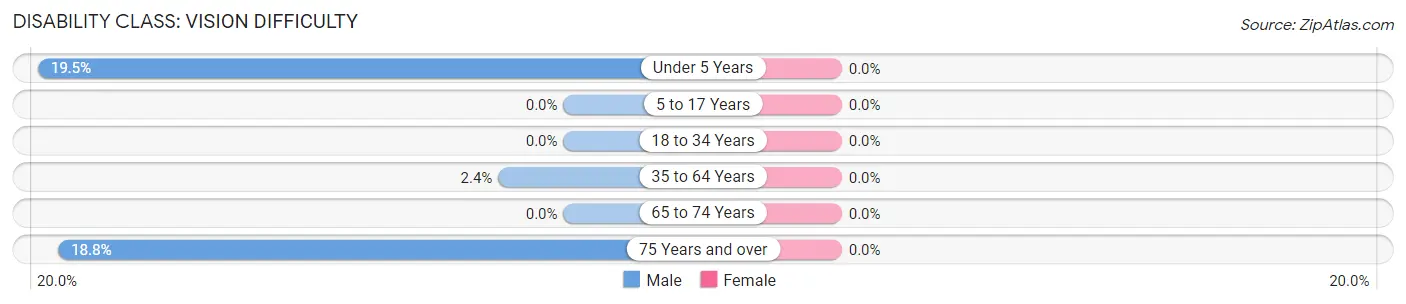
| Age Bracket | Male | Female |
| Under 5 Years | 16 (19.5%) | 0 (0.0%) |
| 5 to 17 Years | 0 (0.0%) | 0 (0.0%) |
| 18 to 34 Years | 0 (0.0%) | 0 (0.0%) |
| 35 to 64 Years | 22 (2.4%) | 0 (0.0%) |
| 65 to 74 Years | 0 (0.0%) | 0 (0.0%) |
| 75 Years and over | 18 (18.8%) | 0 (0.0%) |
Disability Class: Cognitive Difficulty
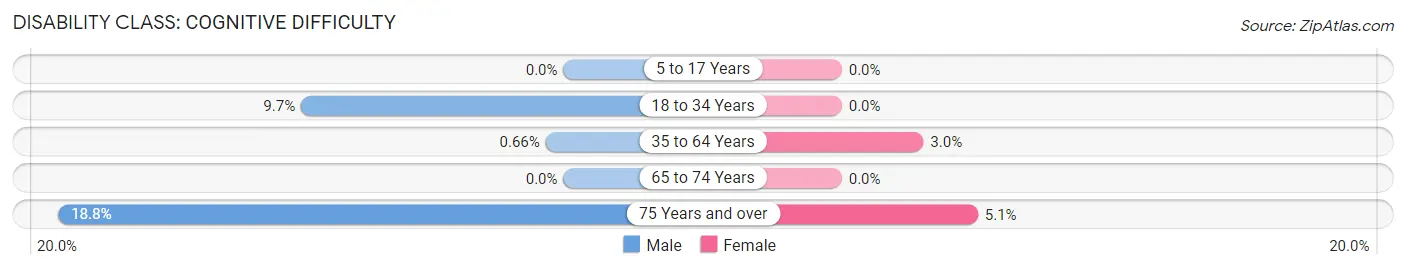
| Age Bracket | Male | Female |
| 5 to 17 Years | 0 (0.0%) | 0 (0.0%) |
| 18 to 34 Years | 19 (9.7%) | 0 (0.0%) |
| 35 to 64 Years | 6 (0.7%) | 25 (3.0%) |
| 65 to 74 Years | 0 (0.0%) | 0 (0.0%) |
| 75 Years and over | 18 (18.8%) | 5 (5.1%) |
Disability Class: Ambulatory Difficulty
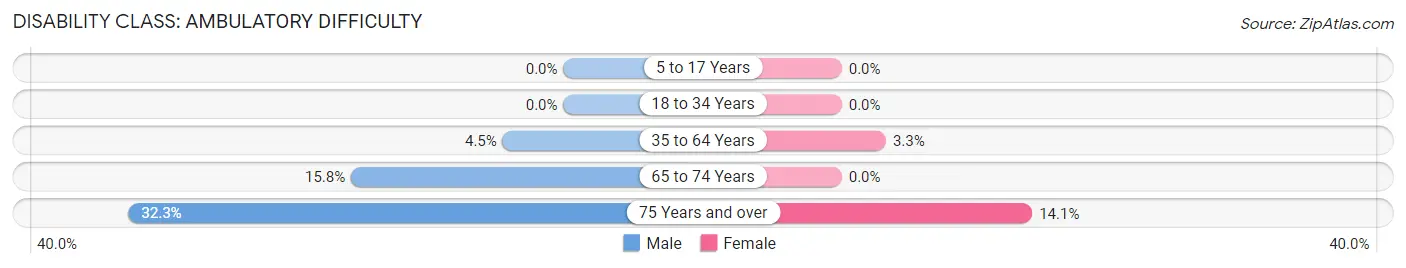
| Age Bracket | Male | Female |
| 5 to 17 Years | 0 (0.0%) | 0 (0.0%) |
| 18 to 34 Years | 0 (0.0%) | 0 (0.0%) |
| 35 to 64 Years | 41 (4.5%) | 27 (3.3%) |
| 65 to 74 Years | 26 (15.8%) | 0 (0.0%) |
| 75 Years and over | 31 (32.3%) | 14 (14.1%) |
Disability Class: Self-Care Difficulty
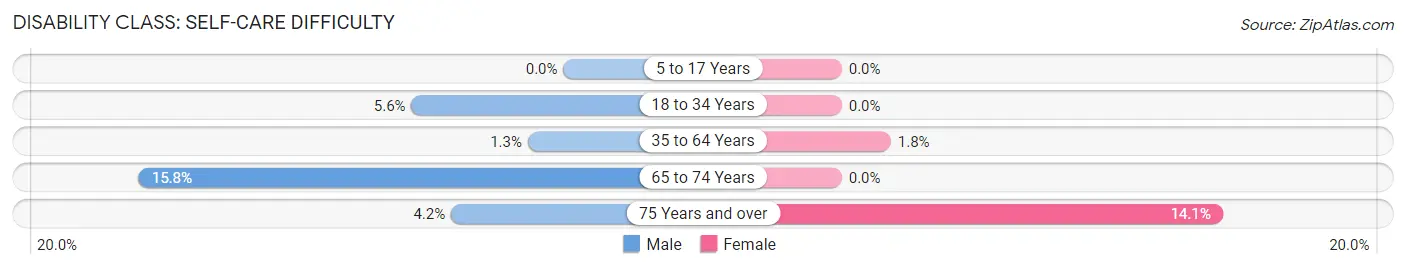
| Age Bracket | Male | Female |
| 5 to 17 Years | 0 (0.0%) | 0 (0.0%) |
| 18 to 34 Years | 11 (5.6%) | 0 (0.0%) |
| 35 to 64 Years | 12 (1.3%) | 15 (1.8%) |
| 65 to 74 Years | 26 (15.8%) | 0 (0.0%) |
| 75 Years and over | 4 (4.2%) | 14 (14.1%) |
Technology Access in Maple Heights Lake Desire
Computing Device Access in Maple Heights Lake Desire
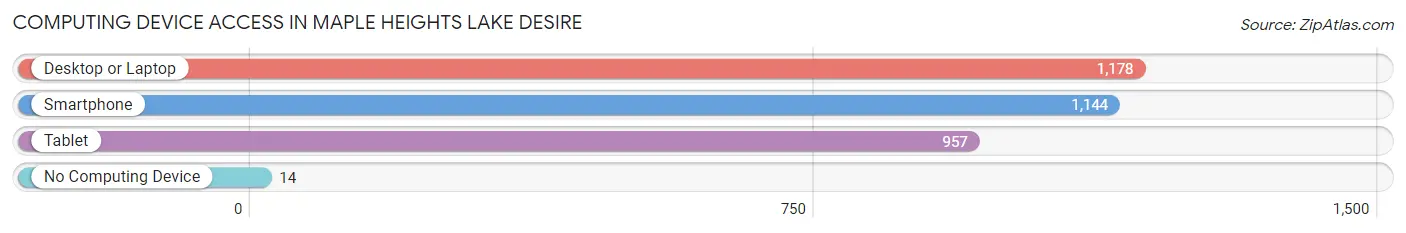
| Device Type | # Households | % Households |
| Desktop or Laptop | 1,178 | 97.7% |
| Smartphone | 1,144 | 94.9% |
| Tablet | 957 | 79.3% |
| No Computing Device | 14 | 1.2% |
| Total | 1,206 | 100.0% |
Internet Access in Maple Heights Lake Desire
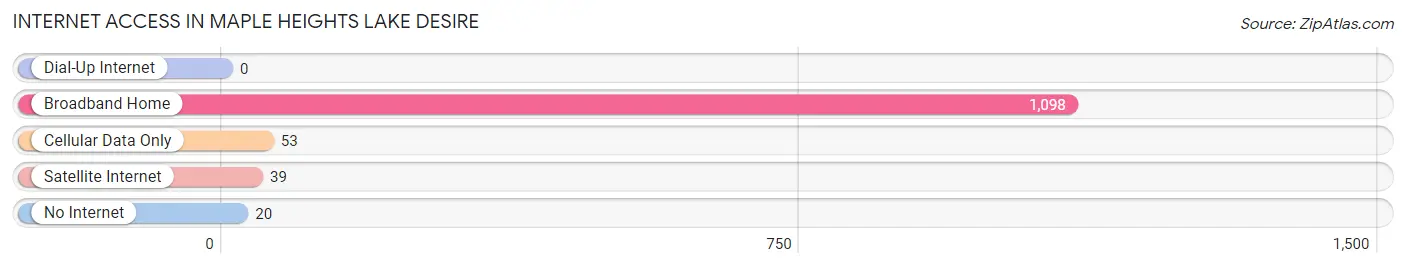
| Internet Type | # Households | % Households |
| Dial-Up Internet | 0 | 0.0% |
| Broadband Home | 1,098 | 91.0% |
| Cellular Data Only | 53 | 4.4% |
| Satellite Internet | 39 | 3.2% |
| No Internet | 20 | 1.7% |
| Total | 1,206 | 100.0% |
Maple Heights Lake Desire Summary
Maple Heights Lake Desire, WA is a small unincorporated community located in the Cascade Mountains of Washington State. It is situated in the foothills of the Cascade Range, approximately 25 miles east of Seattle. The community is surrounded by lush forests, rolling hills, and a beautiful lake.
History
The area around Maple Heights Lake Desire was first settled in the late 1800s by homesteaders and loggers. The first settlers were mostly of Scandinavian descent, and the area was known as “Little Norway”. The community was officially established in the early 1900s, and the name “Maple Heights” was chosen to reflect the abundance of maple trees in the area.
The community grew slowly over the years, and by the 1950s, it had become a popular destination for outdoor recreation. The lake was stocked with trout, and the surrounding forests were filled with game. The area was also known for its excellent hiking and camping opportunities.
In the late 1970s, the area was designated as a National Forest, and the community was incorporated as a town. The town was named “Lake Desire” in honor of the lake that was the centerpiece of the community.
Geography
Maple Heights Lake Desire is located in the foothills of the Cascade Mountains, approximately 25 miles east of Seattle. The community is surrounded by lush forests, rolling hills, and a beautiful lake. The lake is the centerpiece of the community, and it is a popular destination for fishing, swimming, and boating.
The area is also home to a variety of wildlife, including deer, elk, bear, and cougars. The forests are filled with a variety of trees, including maple, fir, and cedar.
Economy
The economy of Maple Heights Lake Desire is largely based on tourism and outdoor recreation. The area is a popular destination for fishing, camping, hiking, and other outdoor activities. The lake is stocked with trout, and the surrounding forests are filled with game.
The area is also home to a variety of small businesses, including restaurants, lodging, and retail stores. The town is also home to a small airport, which serves as a hub for private and commercial flights.
Demographics
As of the 2010 census, the population of Maple Heights Lake Desire was 1,845. The population is largely white (94.3%), with a small percentage of African Americans (2.2%) and Native Americans (1.2%). The median household income is $50,000, and the median age is 44.
The town is served by a variety of public schools, including Maple Heights Elementary School, Lake Desire Middle School, and Maple Heights High School. The town is also home to a small community college, which offers a variety of courses and programs.
Conclusion
Maple Heights Lake Desire, WA is a small unincorporated community located in the Cascade Mountains of Washington State. It is situated in the foothills of the Cascade Range, approximately 25 miles east of Seattle. The community is surrounded by lush forests, rolling hills, and a beautiful lake. The economy of the town is largely based on tourism and outdoor recreation, and the population is largely white. The town is served by a variety of public schools, and it is home to a small community college.
Common Questions
What is Per Capita Income in Maple Heights Lake Desire?
Per Capita income in Maple Heights Lake Desire is $54,918.
What is the Median Family Income in Maple Heights Lake Desire?
Median Family Income in Maple Heights Lake Desire is $134,423.
What is the Median Household income in Maple Heights Lake Desire?
Median Household Income in Maple Heights Lake Desire is $124,400.
What is Income or Wage Gap in Maple Heights Lake Desire?
Income or Wage Gap in Maple Heights Lake Desire is 34.3%.
Women in Maple Heights Lake Desire earn 65.7 cents for every dollar earned by a man.
What is Inequality or Gini Index in Maple Heights Lake Desire?
Inequality or Gini Index in Maple Heights Lake Desire is 0.39.
What is the Total Population of Maple Heights Lake Desire?
Total Population of Maple Heights Lake Desire is 3,436.
What is the Total Male Population of Maple Heights Lake Desire?
Total Male Population of Maple Heights Lake Desire is 1,831.
What is the Total Female Population of Maple Heights Lake Desire?
Total Female Population of Maple Heights Lake Desire is 1,605.
What is the Ratio of Males per 100 Females in Maple Heights Lake Desire?
There are 114.08 Males per 100 Females in Maple Heights Lake Desire.
What is the Ratio of Females per 100 Males in Maple Heights Lake Desire?
There are 87.66 Females per 100 Males in Maple Heights Lake Desire.
What is the Median Population Age in Maple Heights Lake Desire?
Median Population Age in Maple Heights Lake Desire is 46.0 Years.
What is the Average Family Size in Maple Heights Lake Desire
Average Family Size in Maple Heights Lake Desire is 2.9 People.
What is the Average Household Size in Maple Heights Lake Desire
Average Household Size in Maple Heights Lake Desire is 2.8 People.
How Large is the Labor Force in Maple Heights Lake Desire?
There are 1,626 People in the Labor Forcein in Maple Heights Lake Desire.
What is the Percentage of People in the Labor Force in Maple Heights Lake Desire?
59.4% of People are in the Labor Force in Maple Heights Lake Desire.
What is the Unemployment Rate in Maple Heights Lake Desire?
Unemployment Rate in Maple Heights Lake Desire is 1.0%.