Bunk Foss, WA Map & Demographics
Bunk Foss Map
Bunk Foss Overview
$48,061
PER CAPITA INCOME
$142,778
AVG FAMILY INCOME
$145,647
AVG HOUSEHOLD INCOME
46.4%
WAGE / INCOME GAP [ % ]
53.6¢/ $1
WAGE / INCOME GAP [ $ ]
0.30
INEQUALITY / GINI INDEX
3,639
TOTAL POPULATION
1,853
MALE POPULATION
1,786
FEMALE POPULATION
103.75
MALES / 100 FEMALES
96.38
FEMALES / 100 MALES
44.5
MEDIAN AGE
3.2
AVG FAMILY SIZE
3.0
AVG HOUSEHOLD SIZE
1,893
LABOR FORCE [ PEOPLE ]
63.9%
PERCENT IN LABOR FORCE
6.2%
UNEMPLOYMENT RATE
Income in Bunk Foss
Income Overview in Bunk Foss
Per Capita Income in Bunk Foss is $48,061, while median incomes of families and households are $142,778 and $145,647 respectively.
| Characteristic | Number | Measure |
| Per Capita Income | 3,639 | $48,061 |
| Median Family Income | 1,028 | $142,778 |
| Mean Family Income | 1,028 | $146,718 |
| Median Household Income | 1,211 | $145,647 |
| Mean Household Income | 1,211 | $143,425 |
| Income Deficit | 1,028 | $0 |
| Wage / Income Gap (%) | 3,639 | 46.41% |
| Wage / Income Gap ($) | 3,639 | 53.59¢ per $1 |
| Gini / Inequality Index | 3,639 | 0.30 |
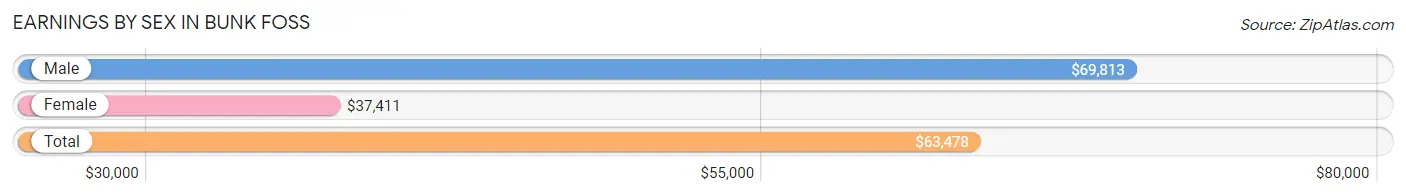
Earnings by Sex in Bunk Foss
Average Earnings in Bunk Foss are $63,478, $69,813 for men and $37,411 for women, a difference of 46.4%.
| Sex | Number | Average Earnings |
| Male | 1,118 (57.6%) | $69,813 |
| Female | 822 (42.4%) | $37,411 |
| Total | 1,940 (100.0%) | $63,478 |
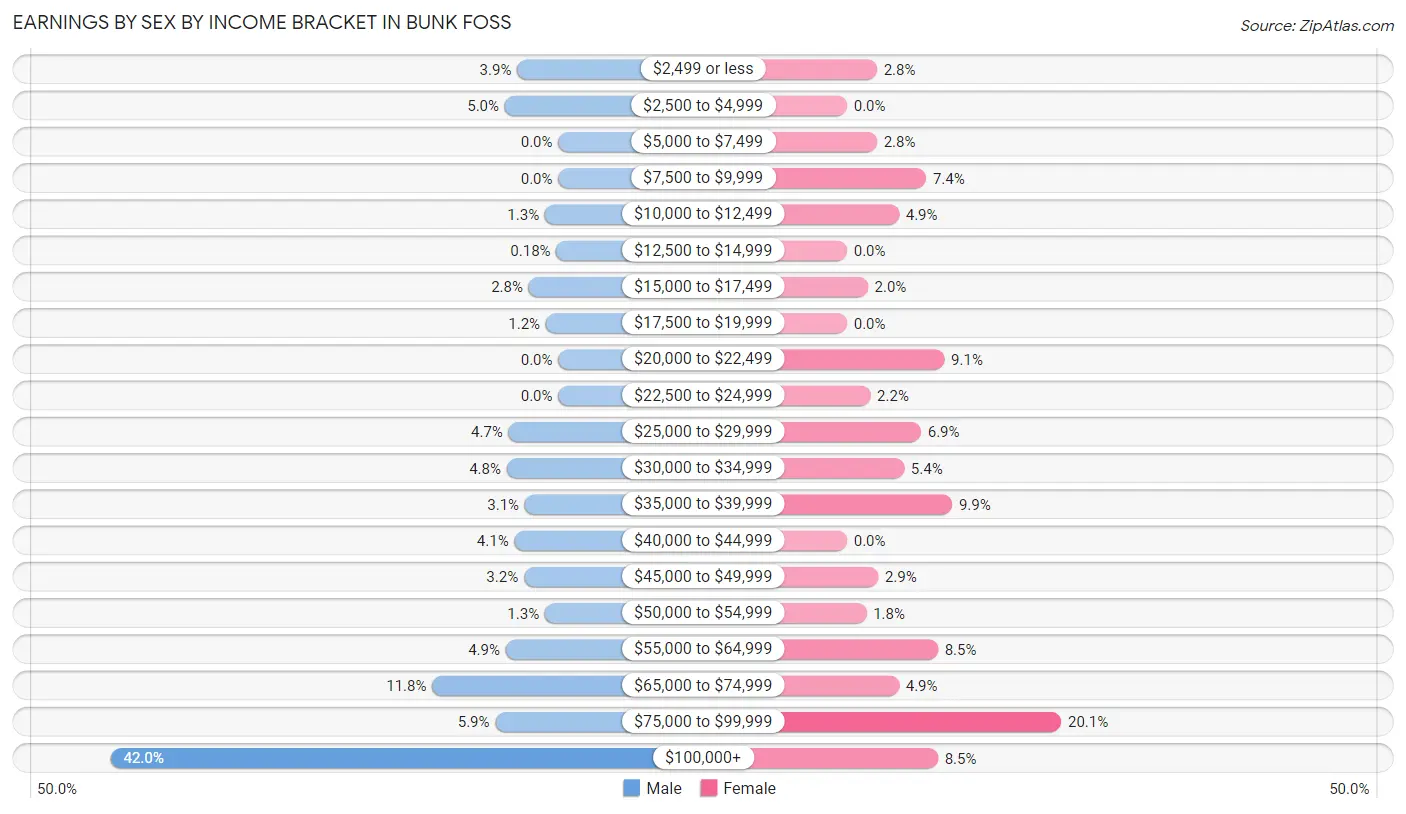
Earnings by Sex by Income Bracket in Bunk Foss
The most common earnings brackets in Bunk Foss are $100,000+ for men (469 | 41.9%) and $75,000 to $99,999 for women (165 | 20.1%).
| Income | Male | Female |
| $2,499 or less | 43 (3.8%) | 23 (2.8%) |
| $2,500 to $4,999 | 56 (5.0%) | 0 (0.0%) |
| $5,000 to $7,499 | 0 (0.0%) | 23 (2.8%) |
| $7,500 to $9,999 | 0 (0.0%) | 61 (7.4%) |
| $10,000 to $12,499 | 14 (1.3%) | 40 (4.9%) |
| $12,500 to $14,999 | 2 (0.2%) | 0 (0.0%) |
| $15,000 to $17,499 | 31 (2.8%) | 16 (1.9%) |
| $17,500 to $19,999 | 13 (1.2%) | 0 (0.0%) |
| $20,000 to $22,499 | 0 (0.0%) | 75 (9.1%) |
| $22,500 to $24,999 | 0 (0.0%) | 18 (2.2%) |
| $25,000 to $29,999 | 52 (4.6%) | 57 (6.9%) |
| $30,000 to $34,999 | 54 (4.8%) | 44 (5.3%) |
| $35,000 to $39,999 | 35 (3.1%) | 81 (9.9%) |
| $40,000 to $44,999 | 46 (4.1%) | 0 (0.0%) |
| $45,000 to $49,999 | 36 (3.2%) | 24 (2.9%) |
| $50,000 to $54,999 | 14 (1.3%) | 15 (1.8%) |
| $55,000 to $64,999 | 55 (4.9%) | 70 (8.5%) |
| $65,000 to $74,999 | 132 (11.8%) | 40 (4.9%) |
| $75,000 to $99,999 | 66 (5.9%) | 165 (20.1%) |
| $100,000+ | 469 (41.9%) | 70 (8.5%) |
| Total | 1,118 (100.0%) | 822 (100.0%) |
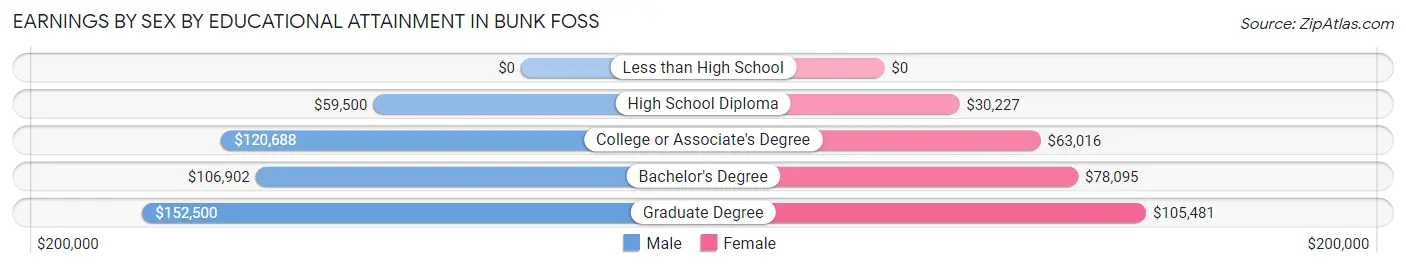
Earnings by Sex by Educational Attainment in Bunk Foss
Average earnings in Bunk Foss are $93,864 for men and $59,115 for women, a difference of 37.0%. Men with an educational attainment of graduate degree enjoy the highest average annual earnings of $152,500, while those with high school diploma education earn the least with $59,500. Women with an educational attainment of graduate degree earn the most with the average annual earnings of $105,481, while those with high school diploma education have the smallest earnings of $30,227.
| Educational Attainment | Male Income | Female Income |
| Less than High School | - | - |
| High School Diploma | $59,500 | $30,227 |
| College or Associate's Degree | $120,688 | $63,016 |
| Bachelor's Degree | $106,902 | $78,095 |
| Graduate Degree | $152,500 | $105,481 |
| Total | $93,864 | $59,115 |
Family Income in Bunk Foss
Family Income Brackets in Bunk Foss
According to the Bunk Foss family income data, there are 322 families falling into the $100,000 to $149,999 income range, which is the most common income bracket and makes up 31.3% of all families.
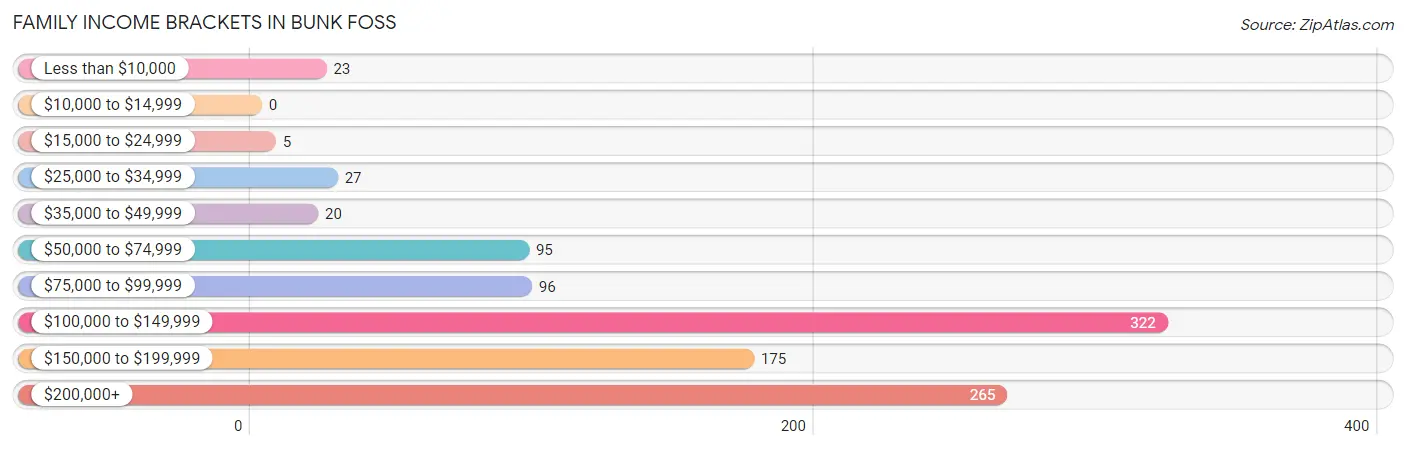
| Income Bracket | # Families | % Families |
| Less than $10,000 | 23 | 2.2% |
| $10,000 to $14,999 | 0 | 0.0% |
| $15,000 to $24,999 | 5 | 0.5% |
| $25,000 to $34,999 | 27 | 2.6% |
| $35,000 to $49,999 | 20 | 1.9% |
| $50,000 to $74,999 | 95 | 9.2% |
| $75,000 to $99,999 | 96 | 9.3% |
| $100,000 to $149,999 | 322 | 31.3% |
| $150,000 to $199,999 | 175 | 17.0% |
| $200,000+ | 265 | 25.8% |
Family Income by Famaliy Size in Bunk Foss
4-person families (243 | 23.6%) account for the highest median family income in Bunk Foss with $179,479 per family, while 2-person families (371 | 36.1%) have the highest median income of $56,054 per family member.
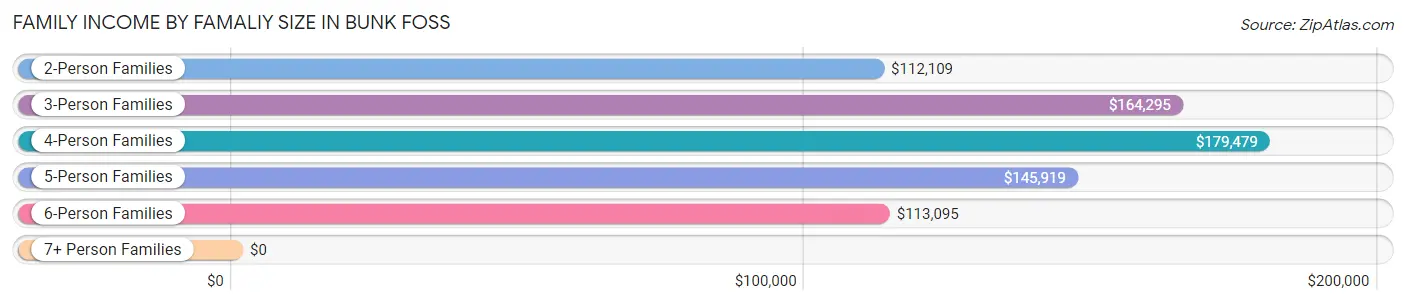
| Income Bracket | # Families | Median Income |
| 2-Person Families | 371 (36.1%) | $112,109 |
| 3-Person Families | 304 (29.6%) | $164,295 |
| 4-Person Families | 243 (23.6%) | $179,479 |
| 5-Person Families | 51 (5.0%) | $145,919 |
| 6-Person Families | 38 (3.7%) | $113,095 |
| 7+ Person Families | 21 (2.0%) | $0 |
| Total | 1,028 (100.0%) | $142,778 |
Family Income by Number of Earners in Bunk Foss
The median family income in Bunk Foss is $142,778, with families comprising 2 earners (421) having the highest median family income of $172,574, while families with no earners (208) have the lowest median family income of $90,185, accounting for 40.9% and 20.2% of families, respectively.
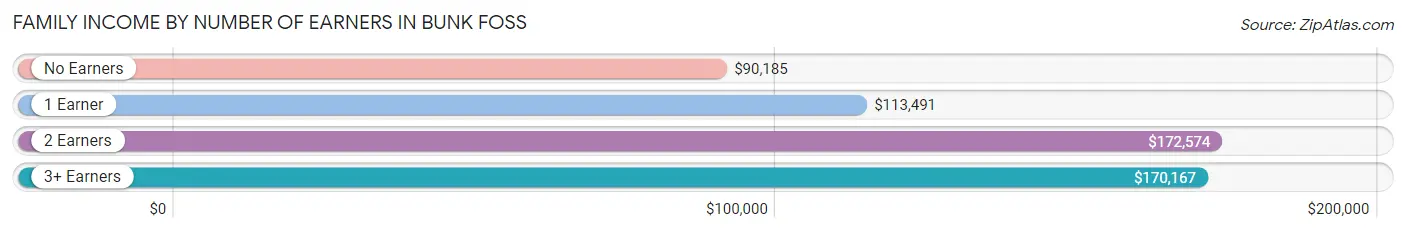
| Number of Earners | # Families | Median Income |
| No Earners | 208 (20.2%) | $90,185 |
| 1 Earner | 217 (21.1%) | $113,491 |
| 2 Earners | 421 (40.9%) | $172,574 |
| 3+ Earners | 182 (17.7%) | $170,167 |
| Total | 1,028 (100.0%) | $142,778 |
Household Income in Bunk Foss
Household Income Brackets in Bunk Foss
With 328 households falling in the category, the $100,000 to $149,999 income range is the most frequent in Bunk Foss, accounting for 27.1% of all households. In contrast, only 5 households (0.4%) fall into the $15,000 to $24,999 income bracket, making it the least populous group.
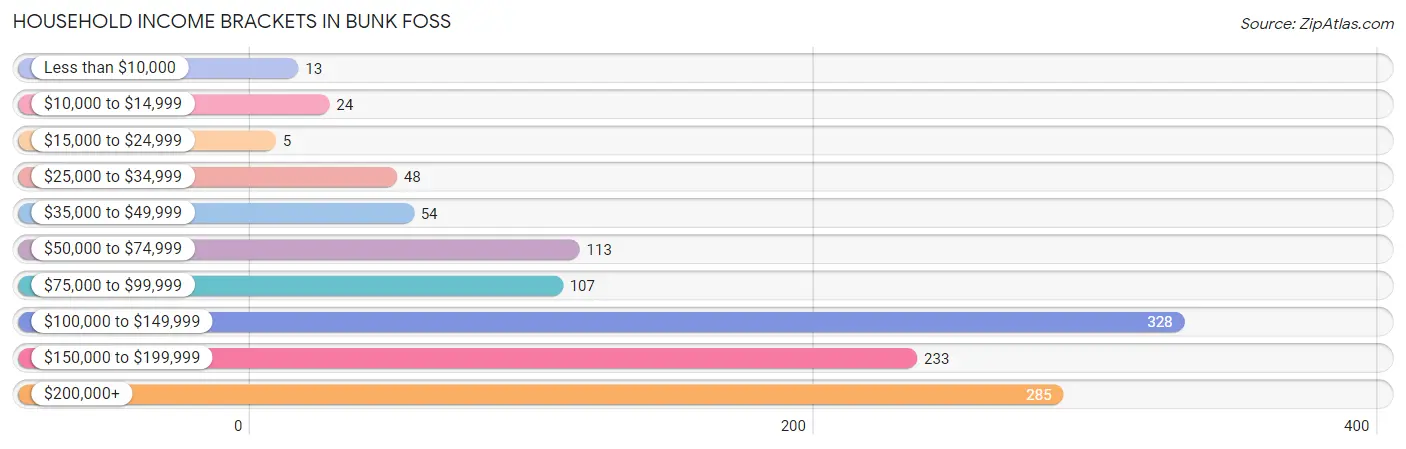
| Income Bracket | # Households | % Households |
| Less than $10,000 | 13 | 1.1% |
| $10,000 to $14,999 | 24 | 2.0% |
| $15,000 to $24,999 | 5 | 0.4% |
| $25,000 to $34,999 | 48 | 4.0% |
| $35,000 to $49,999 | 54 | 4.5% |
| $50,000 to $74,999 | 113 | 9.3% |
| $75,000 to $99,999 | 107 | 8.8% |
| $100,000 to $149,999 | 328 | 27.1% |
| $150,000 to $199,999 | 233 | 19.2% |
| $200,000+ | 285 | 23.5% |
Household Income by Householder Age in Bunk Foss
The median household income in Bunk Foss is $145,647, with the highest median household income of $169,583 found in the 45 to 64 years age bracket for the primary householder. A total of 553 households (45.7%) fall into this category.
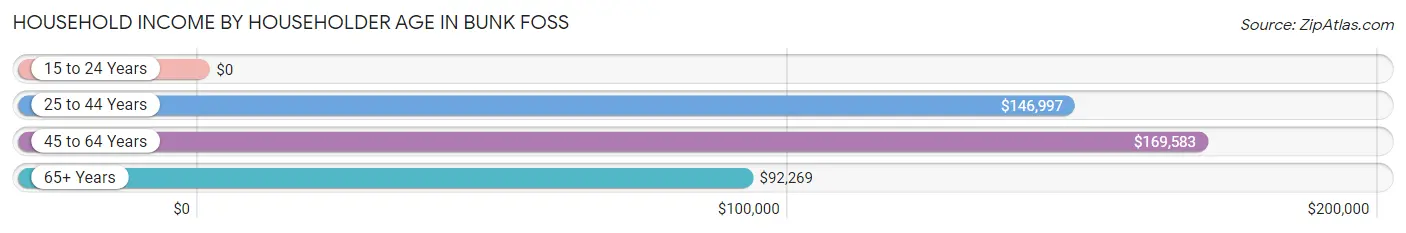
| Income Bracket | # Households | Median Income |
| 15 to 24 Years | 0 (0.0%) | $0 |
| 25 to 44 Years | 311 (25.7%) | $146,997 |
| 45 to 64 Years | 553 (45.7%) | $169,583 |
| 65+ Years | 347 (28.6%) | $92,269 |
| Total | 1,211 (100.0%) | $145,647 |
Poverty in Bunk Foss
Income Below Poverty by Sex and Age in Bunk Foss
With 2.6% poverty level for males and 5.0% for females among the residents of Bunk Foss, 55 to 64 year old males and 65 to 74 year old females are the most vulnerable to poverty, with 23 males (10.4%) and 21 females (12.8%) in their respective age groups living below the poverty level.
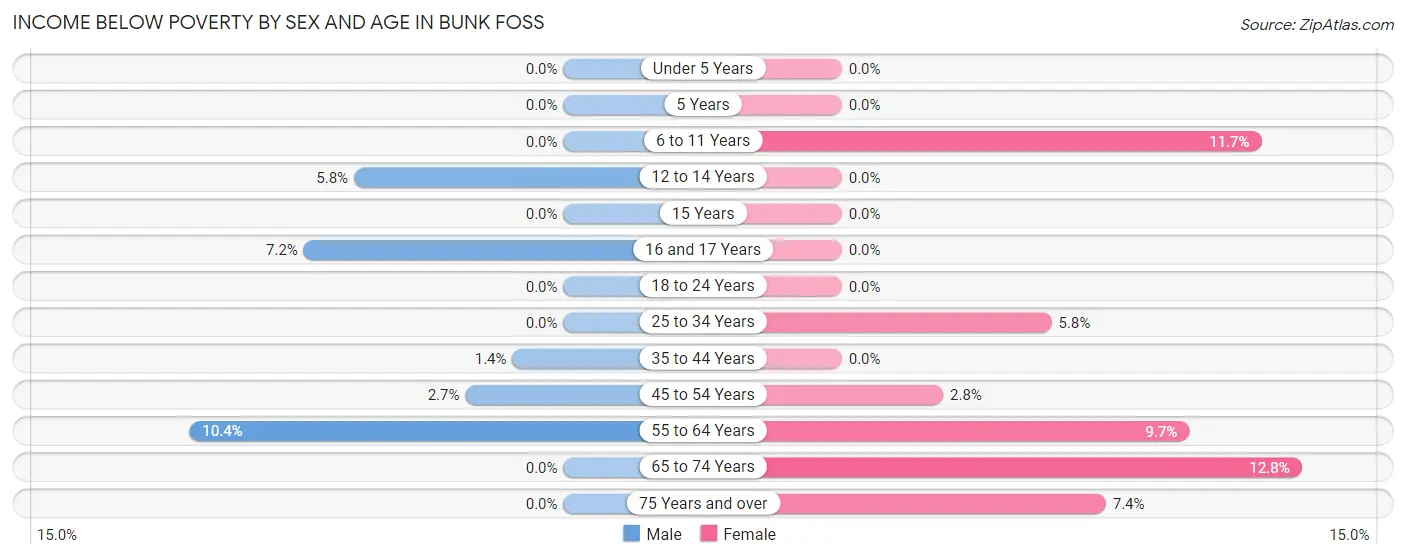
| Age Bracket | Male | Female |
| Under 5 Years | 0 (0.0%) | 0 (0.0%) |
| 5 Years | 0 (0.0%) | 0 (0.0%) |
| 6 to 11 Years | 0 (0.0%) | 16 (11.7%) |
| 12 to 14 Years | 7 (5.8%) | 0 (0.0%) |
| 15 Years | 0 (0.0%) | 0 (0.0%) |
| 16 and 17 Years | 6 (7.2%) | 0 (0.0%) |
| 18 to 24 Years | 0 (0.0%) | 0 (0.0%) |
| 25 to 34 Years | 0 (0.0%) | 8 (5.8%) |
| 35 to 44 Years | 3 (1.4%) | 0 (0.0%) |
| 45 to 54 Years | 9 (2.7%) | 9 (2.8%) |
| 55 to 64 Years | 23 (10.4%) | 26 (9.7%) |
| 65 to 74 Years | 0 (0.0%) | 21 (12.8%) |
| 75 Years and over | 0 (0.0%) | 10 (7.3%) |
| Total | 48 (2.6%) | 90 (5.0%) |
Income Above Poverty by Sex and Age in Bunk Foss
According to the poverty statistics in Bunk Foss, males aged under 5 years and females aged under 5 years are the age groups that are most secure financially, with 100.0% of males and 100.0% of females in these age groups living above the poverty line.
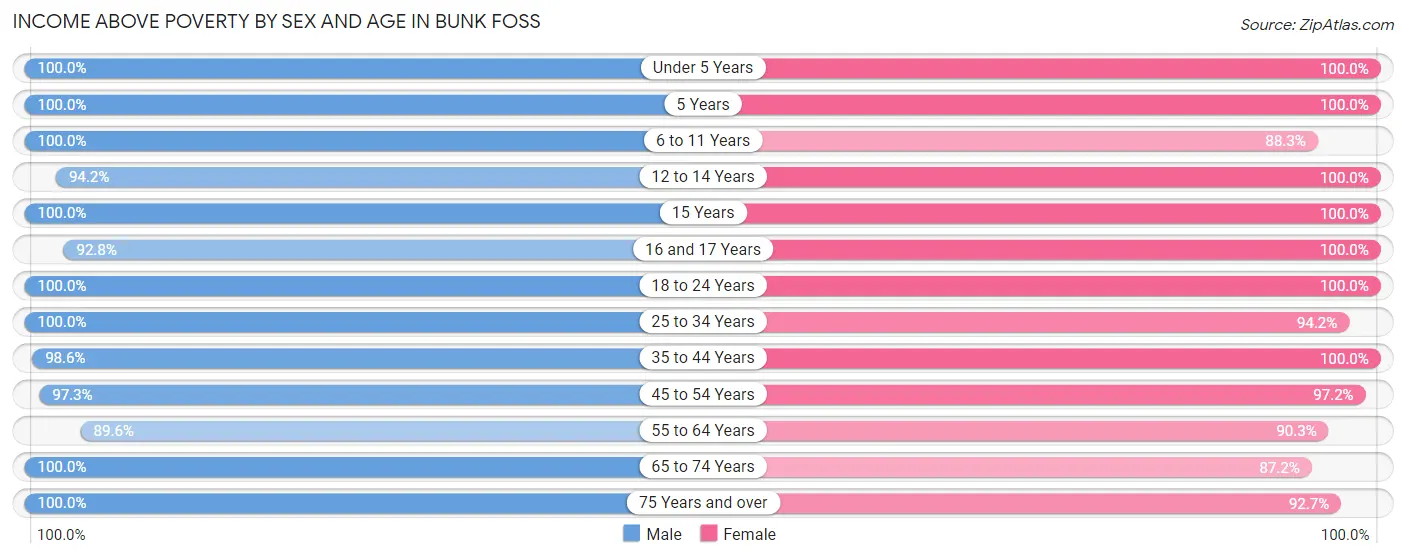
| Age Bracket | Male | Female |
| Under 5 Years | 36 (100.0%) | 110 (100.0%) |
| 5 Years | 9 (100.0%) | 28 (100.0%) |
| 6 to 11 Years | 150 (100.0%) | 121 (88.3%) |
| 12 to 14 Years | 113 (94.2%) | 50 (100.0%) |
| 15 Years | 21 (100.0%) | 4 (100.0%) |
| 16 and 17 Years | 77 (92.8%) | 20 (100.0%) |
| 18 to 24 Years | 169 (100.0%) | 240 (100.0%) |
| 25 to 34 Years | 162 (100.0%) | 129 (94.2%) |
| 35 to 44 Years | 208 (98.6%) | 172 (100.0%) |
| 45 to 54 Years | 321 (97.3%) | 310 (97.2%) |
| 55 to 64 Years | 198 (89.6%) | 243 (90.3%) |
| 65 to 74 Years | 211 (100.0%) | 143 (87.2%) |
| 75 Years and over | 119 (100.0%) | 126 (92.6%) |
| Total | 1,794 (97.4%) | 1,696 (95.0%) |
Income Below Poverty Among Married-Couple Families in Bunk Foss
The poverty statistics for married-couple families in Bunk Foss show that 1.2% or 10 of the total 806 families live below the poverty line. Families with no children have the highest poverty rate of 2.2%, comprising of 10 families. On the other hand, families with 1 or 2 children have the lowest poverty rate of 0.0%, which includes 0 families.
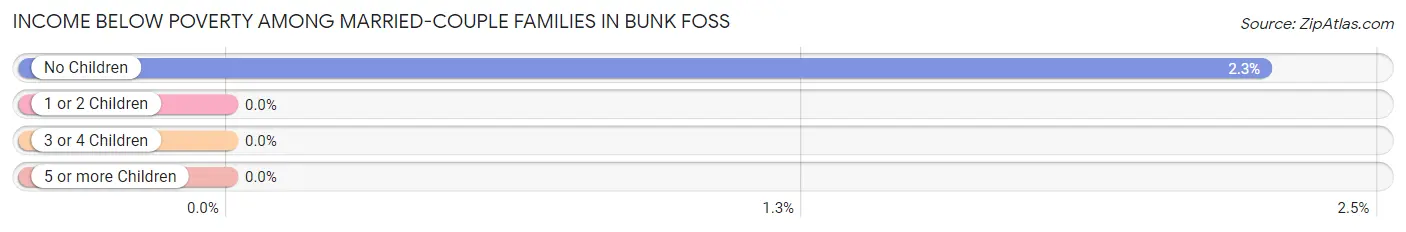
| Children | Above Poverty | Below Poverty |
| No Children | 435 (97.8%) | 10 (2.2%) |
| 1 or 2 Children | 300 (100.0%) | 0 (0.0%) |
| 3 or 4 Children | 61 (100.0%) | 0 (0.0%) |
| 5 or more Children | 0 (0.0%) | 0 (0.0%) |
| Total | 796 (98.8%) | 10 (1.2%) |
Income Below Poverty Among Single-Parent Households in Bunk Foss
According to the poverty data in Bunk Foss, 10.3% or 9 single-father households and 6.7% or 9 single-mother households are living below the poverty line. Among single-father households, those with 3 or 4 children have the highest poverty rate, with 9 households (90.0%) experiencing poverty. Likewise, among single-mother households, those with no children have the highest poverty rate, with 5 households (7.3%) falling below the poverty line.
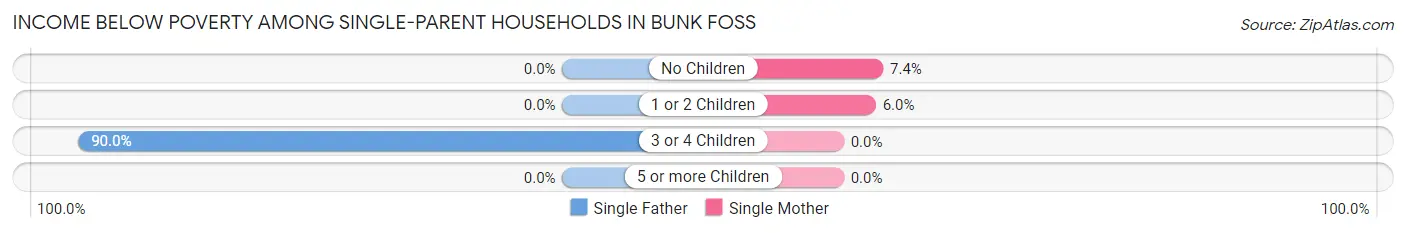
| Children | Single Father | Single Mother |
| No Children | 0 (0.0%) | 5 (7.3%) |
| 1 or 2 Children | 0 (0.0%) | 4 (6.0%) |
| 3 or 4 Children | 9 (90.0%) | 0 (0.0%) |
| 5 or more Children | 0 (0.0%) | 0 (0.0%) |
| Total | 9 (10.3%) | 9 (6.7%) |
Income Below Poverty Among Married-Couple vs Single-Parent Households in Bunk Foss
The poverty data for Bunk Foss shows that 10 of the married-couple family households (1.2%) and 18 of the single-parent households (8.1%) are living below the poverty level. Within the married-couple family households, those with no children have the highest poverty rate, with 10 households (2.2%) falling below the poverty line. Among the single-parent households, those with 3 or 4 children have the highest poverty rate, with 9 household (90.0%) living below poverty.
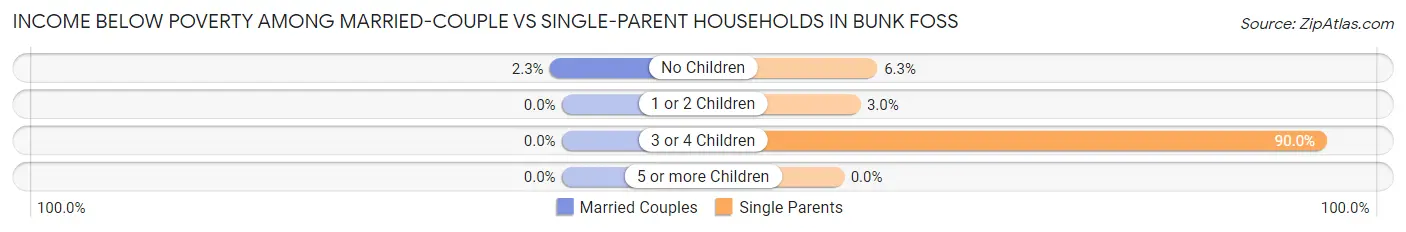
| Children | Married-Couple Families | Single-Parent Households |
| No Children | 10 (2.2%) | 5 (6.2%) |
| 1 or 2 Children | 0 (0.0%) | 4 (3.0%) |
| 3 or 4 Children | 0 (0.0%) | 9 (90.0%) |
| 5 or more Children | 0 (0.0%) | 0 (0.0%) |
| Total | 10 (1.2%) | 18 (8.1%) |
Race in Bunk Foss
The most populous races in Bunk Foss are White / Caucasian (3,093 | 85.0%), Hispanic or Latino (390 | 10.7%), and Two or more Races (350 | 9.6%).
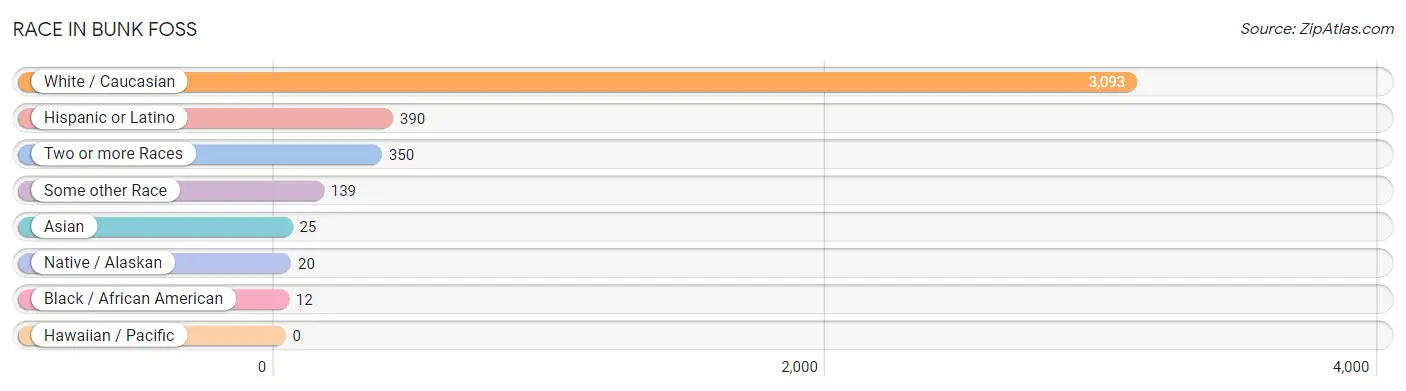
| Race | # Population | % Population |
| Asian | 25 | 0.7% |
| Black / African American | 12 | 0.3% |
| Hawaiian / Pacific | 0 | 0.0% |
| Hispanic or Latino | 390 | 10.7% |
| Native / Alaskan | 20 | 0.5% |
| White / Caucasian | 3,093 | 85.0% |
| Two or more Races | 350 | 9.6% |
| Some other Race | 139 | 3.8% |
| Total | 3,639 | 100.0% |
Ancestry in Bunk Foss
The most populous ancestries reported in Bunk Foss are German (702 | 19.3%), English (582 | 16.0%), Norwegian (393 | 10.8%), Mexican (346 | 9.5%), and Irish (341 | 9.4%), together accounting for 65.0% of all Bunk Foss residents.
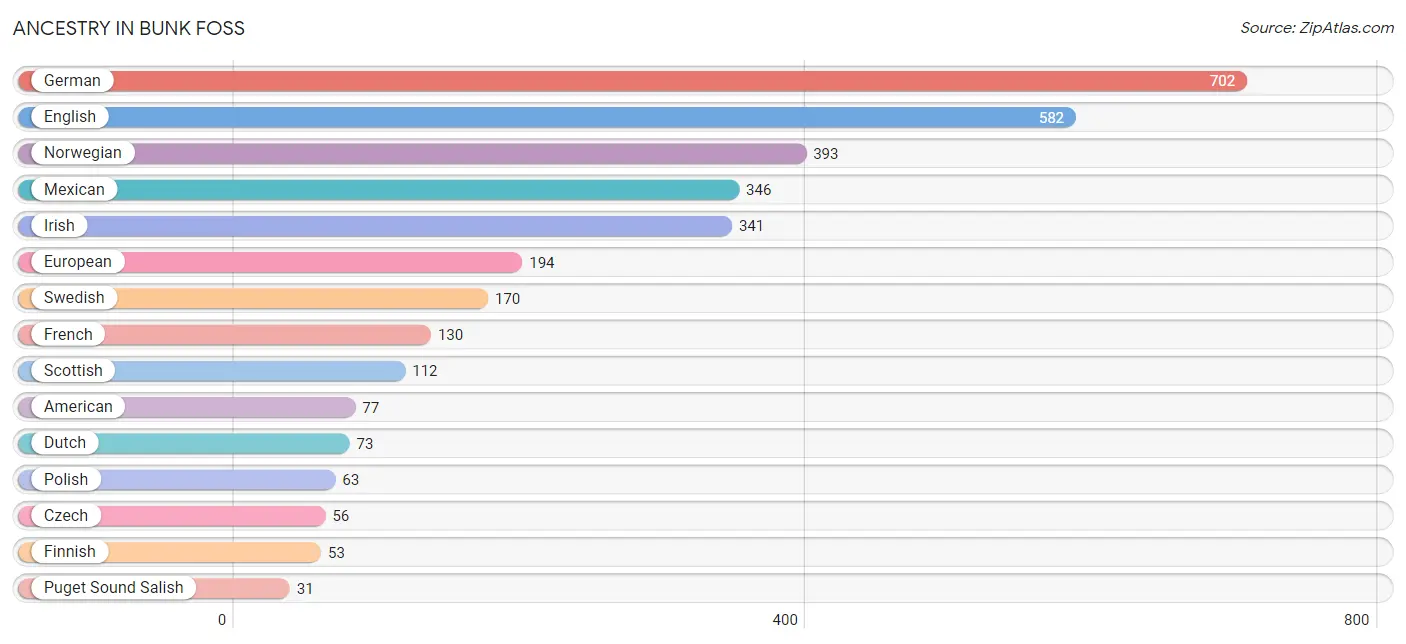
| Ancestry | # Population | % Population |
| African | 2 | 0.1% |
| Aleut | 7 | 0.2% |
| American | 77 | 2.1% |
| Armenian | 3 | 0.1% |
| Austrian | 9 | 0.3% |
| Barbadian | 10 | 0.3% |
| Belgian | 9 | 0.3% |
| British | 28 | 0.8% |
| Burmese | 10 | 0.3% |
| Canadian | 12 | 0.3% |
| Cherokee | 12 | 0.3% |
| Colville | 8 | 0.2% |
| Czech | 56 | 1.5% |
| Dutch | 73 | 2.0% |
| Eastern European | 19 | 0.5% |
| English | 582 | 16.0% |
| European | 194 | 5.3% |
| Finnish | 53 | 1.5% |
| French | 130 | 3.6% |
| German | 702 | 19.3% |
| Irish | 341 | 9.4% |
| Italian | 15 | 0.4% |
| Korean | 26 | 0.7% |
| Mexican | 346 | 9.5% |
| Mexican American Indian | 21 | 0.6% |
| New Zealander | 12 | 0.3% |
| Norwegian | 393 | 10.8% |
| Polish | 63 | 1.7% |
| Puget Sound Salish | 31 | 0.9% |
| Russian | 25 | 0.7% |
| Scandinavian | 22 | 0.6% |
| Scottish | 112 | 3.1% |
| Slovak | 10 | 0.3% |
| Spaniard | 18 | 0.5% |
| Spanish | 20 | 0.5% |
| Sri Lankan | 23 | 0.6% |
| Subsaharan African | 2 | 0.1% |
| Swedish | 170 | 4.7% |
| Welsh | 6 | 0.2% | View All 39 Rows |
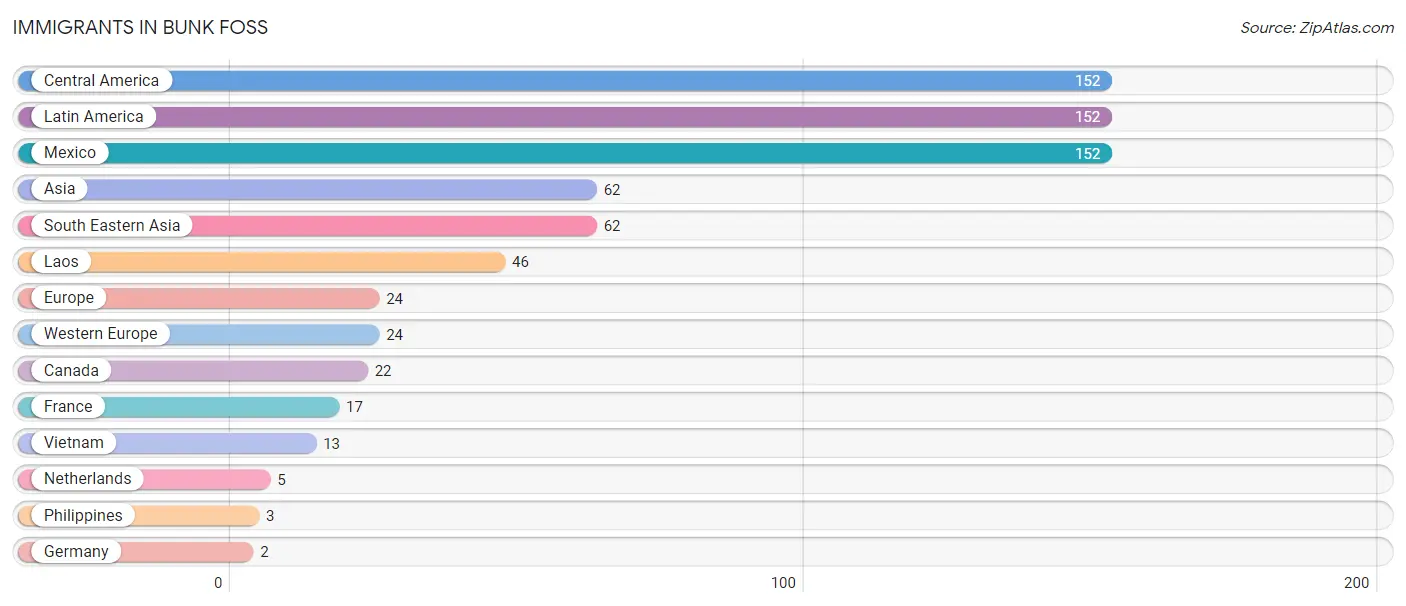
Immigrants in Bunk Foss
The most numerous immigrant groups reported in Bunk Foss came from Central America (152 | 4.2%), Latin America (152 | 4.2%), Mexico (152 | 4.2%), Asia (62 | 1.7%), and South Eastern Asia (62 | 1.7%), together accounting for 15.9% of all Bunk Foss residents.
| Immigration Origin | # Population | % Population |
| Asia | 62 | 1.7% |
| Canada | 22 | 0.6% |
| Central America | 152 | 4.2% |
| Europe | 24 | 0.7% |
| France | 17 | 0.5% |
| Germany | 2 | 0.1% |
| Laos | 46 | 1.3% |
| Latin America | 152 | 4.2% |
| Mexico | 152 | 4.2% |
| Netherlands | 5 | 0.1% |
| Philippines | 3 | 0.1% |
| South Eastern Asia | 62 | 1.7% |
| Vietnam | 13 | 0.4% |
| Western Europe | 24 | 0.7% | View All 14 Rows |
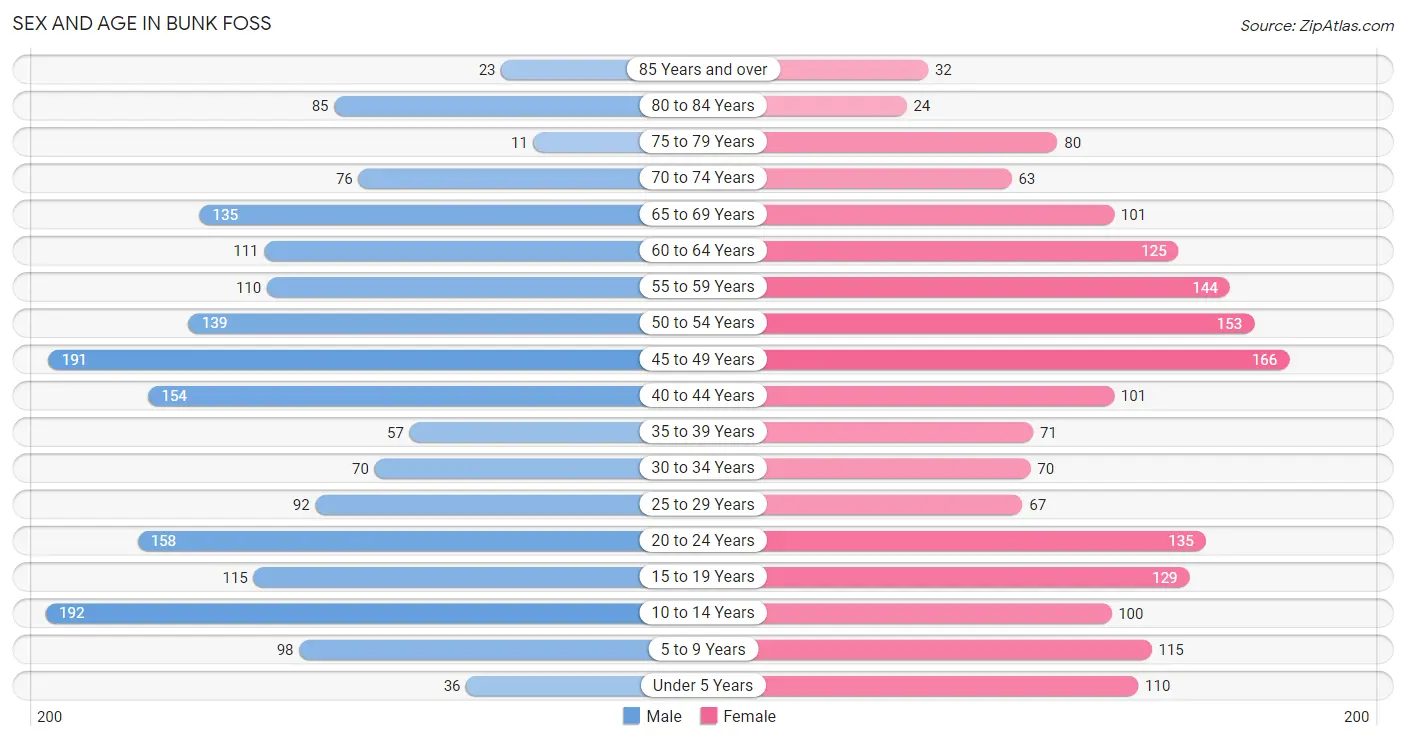
Sex and Age in Bunk Foss
Sex and Age in Bunk Foss
The most populous age groups in Bunk Foss are 10 to 14 Years (192 | 10.4%) for men and 45 to 49 Years (166 | 9.3%) for women.
| Age Bracket | Male | Female |
| Under 5 Years | 36 (1.9%) | 110 (6.2%) |
| 5 to 9 Years | 98 (5.3%) | 115 (6.4%) |
| 10 to 14 Years | 192 (10.4%) | 100 (5.6%) |
| 15 to 19 Years | 115 (6.2%) | 129 (7.2%) |
| 20 to 24 Years | 158 (8.5%) | 135 (7.6%) |
| 25 to 29 Years | 92 (5.0%) | 67 (3.7%) |
| 30 to 34 Years | 70 (3.8%) | 70 (3.9%) |
| 35 to 39 Years | 57 (3.1%) | 71 (4.0%) |
| 40 to 44 Years | 154 (8.3%) | 101 (5.7%) |
| 45 to 49 Years | 191 (10.3%) | 166 (9.3%) |
| 50 to 54 Years | 139 (7.5%) | 153 (8.6%) |
| 55 to 59 Years | 110 (5.9%) | 144 (8.1%) |
| 60 to 64 Years | 111 (6.0%) | 125 (7.0%) |
| 65 to 69 Years | 135 (7.3%) | 101 (5.7%) |
| 70 to 74 Years | 76 (4.1%) | 63 (3.5%) |
| 75 to 79 Years | 11 (0.6%) | 80 (4.5%) |
| 80 to 84 Years | 85 (4.6%) | 24 (1.3%) |
| 85 Years and over | 23 (1.2%) | 32 (1.8%) |
| Total | 1,853 (100.0%) | 1,786 (100.0%) |
Families and Households in Bunk Foss
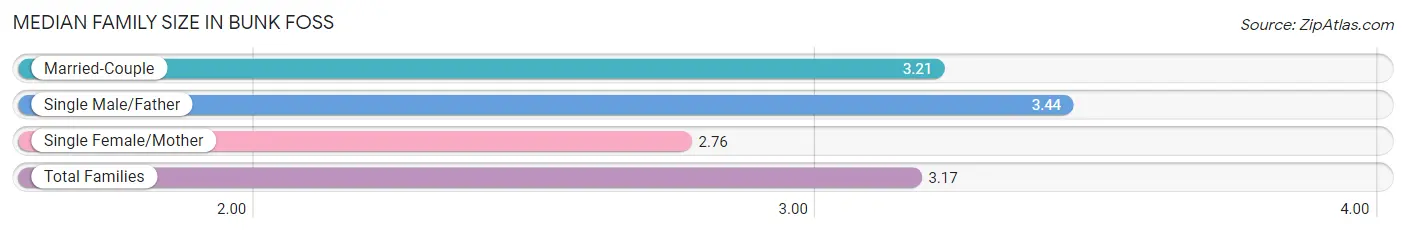
Median Family Size in Bunk Foss
The median family size in Bunk Foss is 3.17 persons per family, with single male/father families (87 | 8.5%) accounting for the largest median family size of 3.44 persons per family. On the other hand, single female/mother families (135 | 13.1%) represent the smallest median family size with 2.76 persons per family.
| Family Type | # Families | Family Size |
| Married-Couple | 806 (78.4%) | 3.21 |
| Single Male/Father | 87 (8.5%) | 3.44 |
| Single Female/Mother | 135 (13.1%) | 2.76 |
| Total Families | 1,028 (100.0%) | 3.17 |
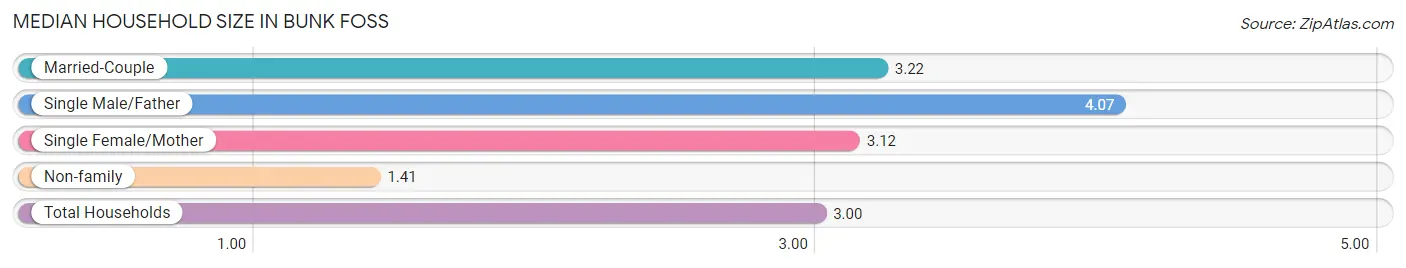
Median Household Size in Bunk Foss
The median household size in Bunk Foss is 3.00 persons per household, with single male/father households (87 | 7.2%) accounting for the largest median household size of 4.07 persons per household. non-family households (183 | 15.1%) represent the smallest median household size with 1.41 persons per household.
| Household Type | # Households | Household Size |
| Married-Couple | 806 (66.6%) | 3.22 |
| Single Male/Father | 87 (7.2%) | 4.07 |
| Single Female/Mother | 135 (11.2%) | 3.12 |
| Non-family | 183 (15.1%) | 1.41 |
| Total Households | 1,211 (100.0%) | 3.00 |
Household Size by Marriage Status in Bunk Foss
Out of a total of 1,211 households in Bunk Foss, 1,028 (84.9%) are family households, while 183 (15.1%) are nonfamily households. The most numerous type of family households are 2-person households, comprising 361, and the most common type of nonfamily households are 1-person households, comprising 133.
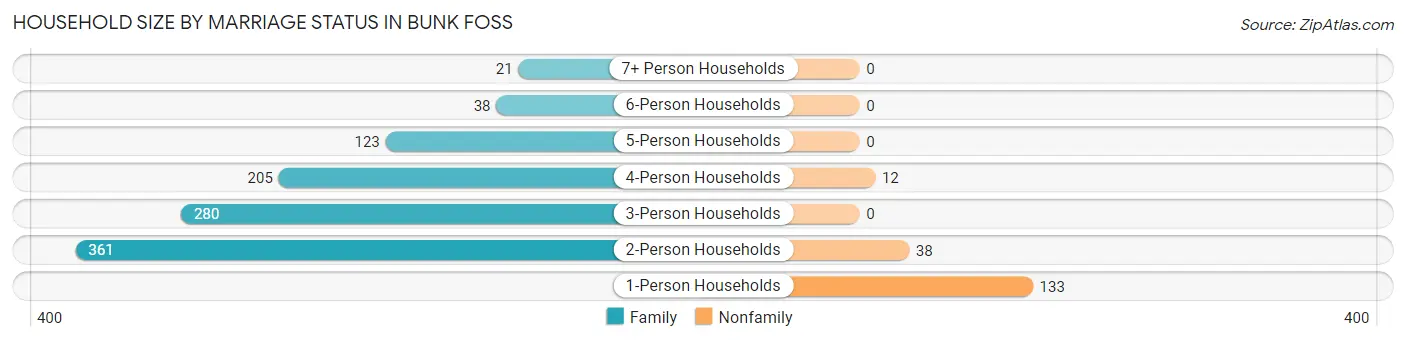
| Household Size | Family Households | Nonfamily Households |
| 1-Person Households | - | 133 (11.0%) |
| 2-Person Households | 361 (29.8%) | 38 (3.1%) |
| 3-Person Households | 280 (23.1%) | 0 (0.0%) |
| 4-Person Households | 205 (16.9%) | 12 (1.0%) |
| 5-Person Households | 123 (10.2%) | 0 (0.0%) |
| 6-Person Households | 38 (3.1%) | 0 (0.0%) |
| 7+ Person Households | 21 (1.7%) | 0 (0.0%) |
| Total | 1,028 (84.9%) | 183 (15.1%) |
Female Fertility in Bunk Foss
Fertility by Age in Bunk Foss
Average fertility rate in Bunk Foss is 55.0 births per 1,000 women. Women in the age bracket of 20 to 34 years have the highest fertility rate with 154.0 births per 1,000 women. Women in the age bracket of 20 to 34 years acount for 100.0% of all women with births.
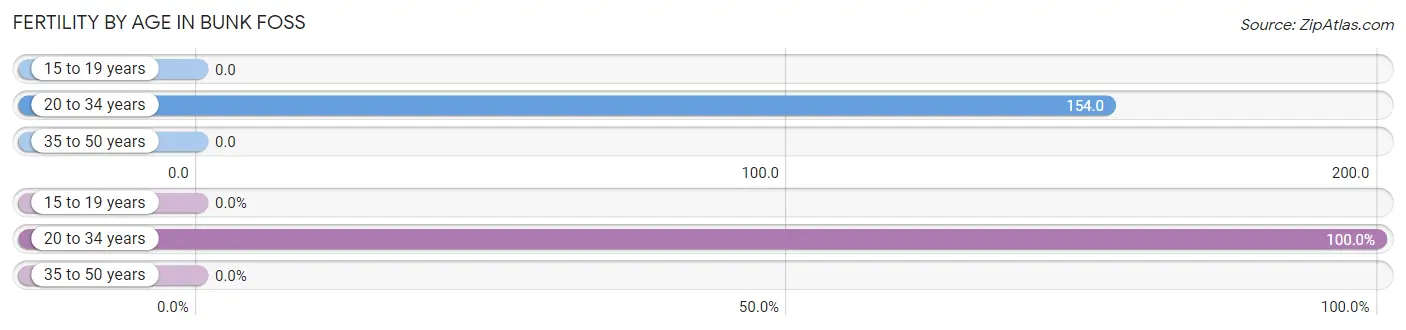
| Age Bracket | Women with Births | Births / 1,000 Women |
| 15 to 19 years | 0 (0.0%) | 0.0 |
| 20 to 34 years | 42 (100.0%) | 154.0 |
| 35 to 50 years | 0 (0.0%) | 0.0 |
| Total | 42 (100.0%) | 55.0 |
Fertility by Age by Marriage Status in Bunk Foss
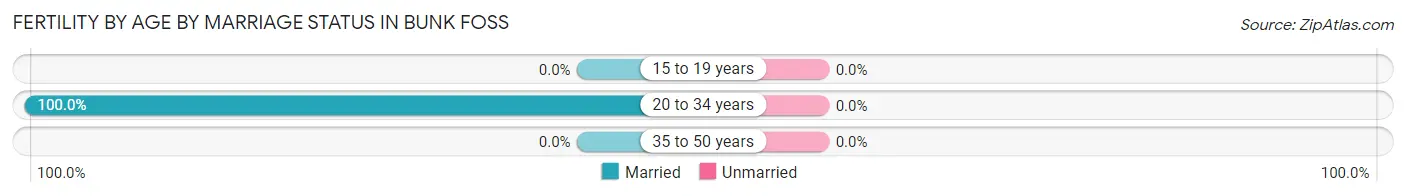
| Age Bracket | Married | Unmarried |
| 15 to 19 years | 0 (0.0%) | 0 (0.0%) |
| 20 to 34 years | 42 (100.0%) | 0 (0.0%) |
| 35 to 50 years | 0 (0.0%) | 0 (0.0%) |
| Total | 42 (100.0%) | 0 (0.0%) |
Fertility by Education in Bunk Foss
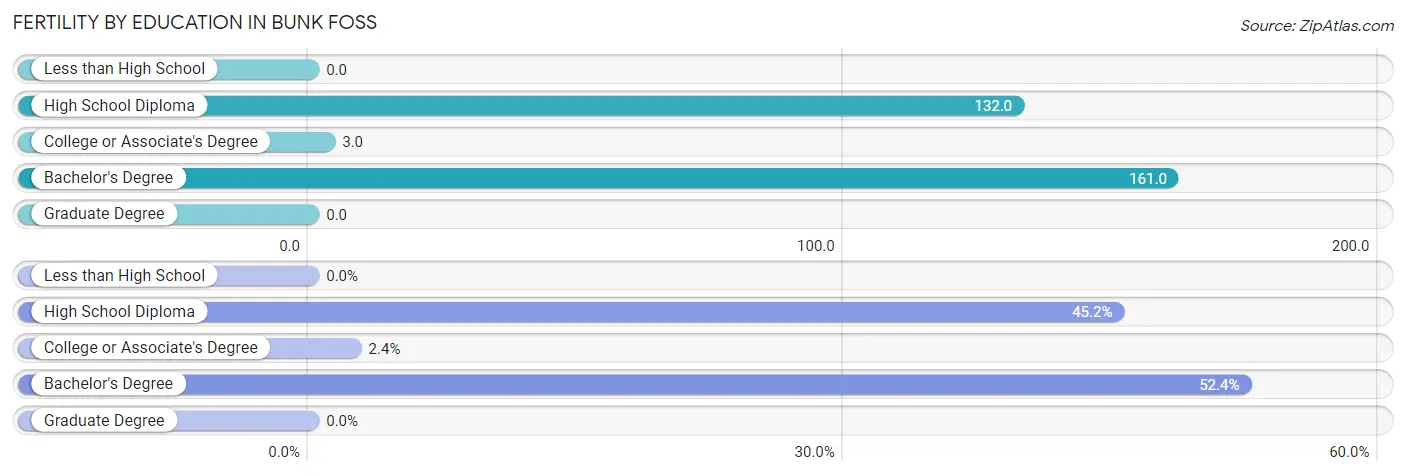
| Educational Attainment | Women with Births | Births / 1,000 Women |
| Less than High School | 0 (0.0%) | 0.0 |
| High School Diploma | 19 (45.2%) | 132.0 |
| College or Associate's Degree | 1 (2.4%) | 3.0 |
| Bachelor's Degree | 22 (52.4%) | 161.0 |
| Graduate Degree | 0 (0.0%) | 0.0 |
| Total | 42 (100.0%) | 55.0 |
Fertility by Education by Marriage Status in Bunk Foss
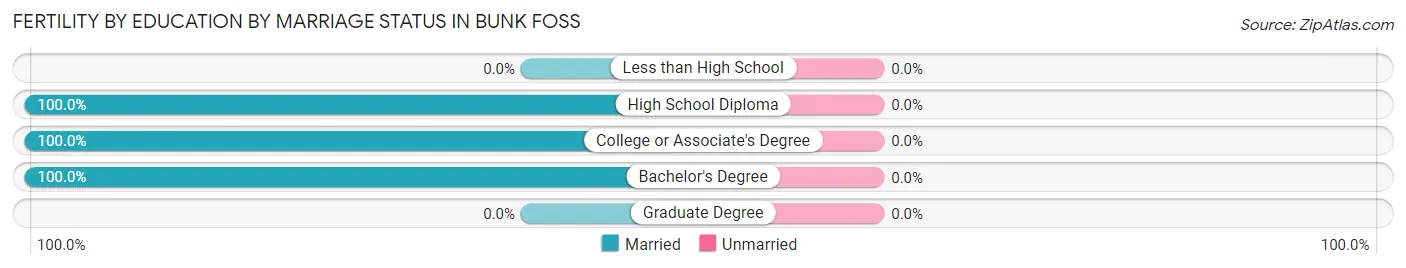
| Educational Attainment | Married | Unmarried |
| Less than High School | 0 (0.0%) | 0 (0.0%) |
| High School Diploma | 19 (100.0%) | 0 (0.0%) |
| College or Associate's Degree | 1 (100.0%) | 0 (0.0%) |
| Bachelor's Degree | 22 (100.0%) | 0 (0.0%) |
| Graduate Degree | 0 (0.0%) | 0 (0.0%) |
| Total | 42 (100.0%) | 0 (0.0%) |
Employment Characteristics in Bunk Foss
Employment by Class of Employer in Bunk Foss
Among the 1,768 employed individuals in Bunk Foss, private company employees (1,183 | 66.9%), local government employees (301 | 17.0%), and self-employed (not incorporated) (113 | 6.4%) make up the most common classes of employment.
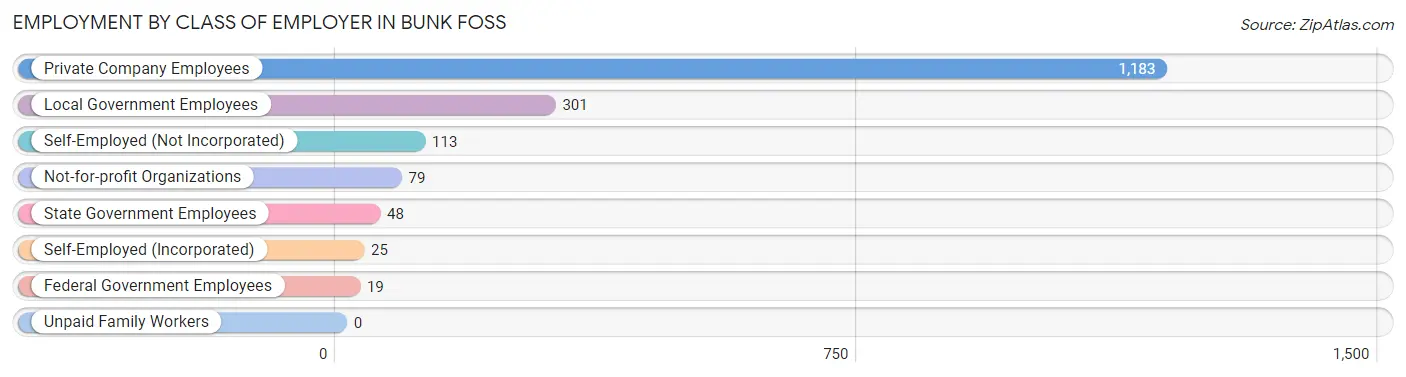
| Employer Class | # Employees | % Employees |
| Private Company Employees | 1,183 | 66.9% |
| Self-Employed (Incorporated) | 25 | 1.4% |
| Self-Employed (Not Incorporated) | 113 | 6.4% |
| Not-for-profit Organizations | 79 | 4.5% |
| Local Government Employees | 301 | 17.0% |
| State Government Employees | 48 | 2.7% |
| Federal Government Employees | 19 | 1.1% |
| Unpaid Family Workers | 0 | 0.0% |
| Total | 1,768 | 100.0% |
Employment Status by Age in Bunk Foss
According to the labor force statistics for Bunk Foss, out of the total population over 16 years of age (2,963), 63.9% or 1,893 individuals are in the labor force, with 6.2% or 117 of them unemployed. The age group with the highest labor force participation rate is 25 to 29 years, with 100.0% or 159 individuals in the labor force. Within the labor force, the 55 to 59 years age range has the highest percentage of unemployed individuals, with 26.4% or 55 of them being unemployed.
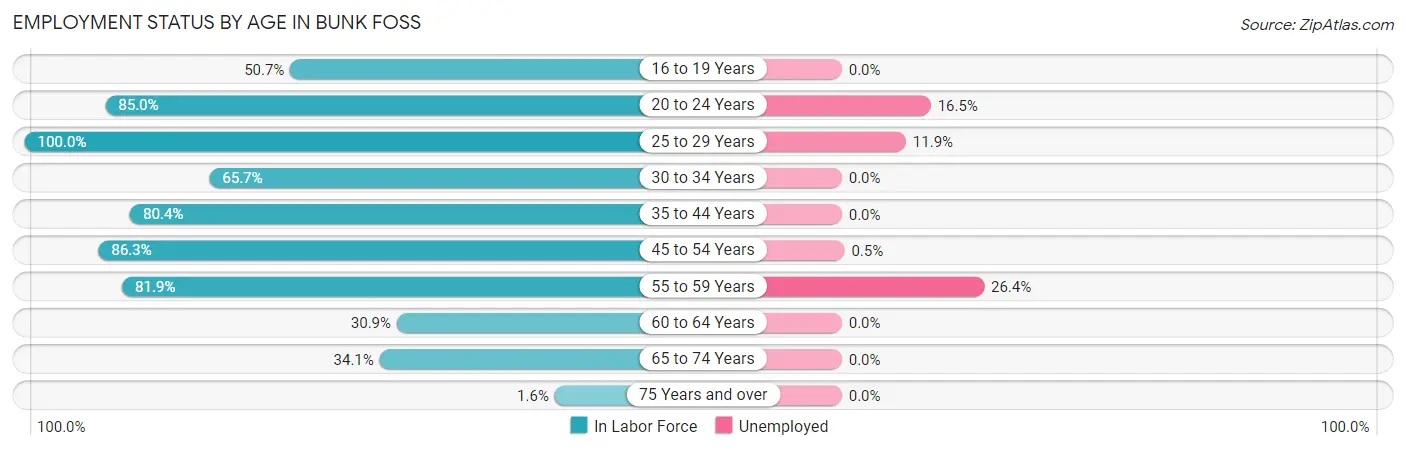
| Age Bracket | In Labor Force | Unemployed |
| 16 to 19 Years | 111 (50.7%) | 0 (0.0%) |
| 20 to 24 Years | 249 (85.0%) | 41 (16.5%) |
| 25 to 29 Years | 159 (100.0%) | 19 (11.9%) |
| 30 to 34 Years | 92 (65.7%) | 0 (0.0%) |
| 35 to 44 Years | 308 (80.4%) | 0 (0.0%) |
| 45 to 54 Years | 560 (86.3%) | 3 (0.5%) |
| 55 to 59 Years | 208 (81.9%) | 55 (26.4%) |
| 60 to 64 Years | 73 (30.9%) | 0 (0.0%) |
| 65 to 74 Years | 128 (34.1%) | 0 (0.0%) |
| 75 Years and over | 4 (1.6%) | 0 (0.0%) |
| Total | 1,893 (63.9%) | 117 (6.2%) |
Employment Status by Educational Attainment in Bunk Foss
According to labor force statistics for Bunk Foss, 76.9% of individuals (1,400) out of the total population between 25 and 64 years of age (1,821) are in the labor force, with 5.5% or 77 of them being unemployed. The group with the highest labor force participation rate are those with the educational attainment of high school diploma, with 82.6% or 502 individuals in the labor force. Within the labor force, individuals with high school diploma education have the highest percentage of unemployment, with 9.4% or 47 of them being unemployed.
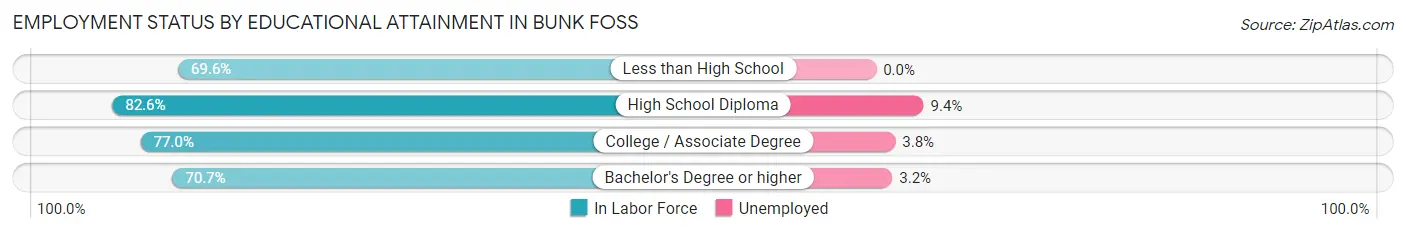
| Educational Attainment | In Labor Force | Unemployed |
| Less than High School | 48 (69.6%) | 0 (0.0%) |
| High School Diploma | 502 (82.6%) | 57 (9.4%) |
| College / Associate Degree | 503 (77.0%) | 25 (3.8%) |
| Bachelor's Degree or higher | 347 (70.7%) | 16 (3.2%) |
| Total | 1,400 (76.9%) | 100 (5.5%) |
Employment Occupations by Sex in Bunk Foss
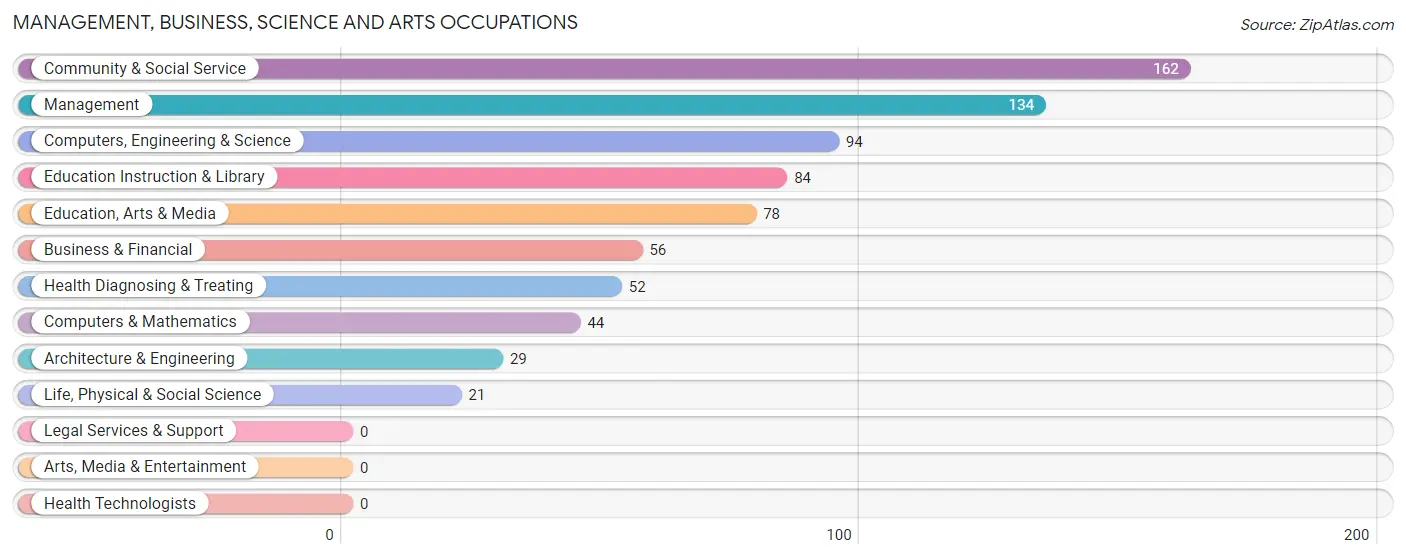
Management, Business, Science and Arts Occupations
The most common Management, Business, Science and Arts occupations in Bunk Foss are Community & Social Service (162 | 9.1%), Management (134 | 7.5%), Computers, Engineering & Science (94 | 5.3%), Education Instruction & Library (84 | 4.7%), and Education, Arts & Media (78 | 4.4%).
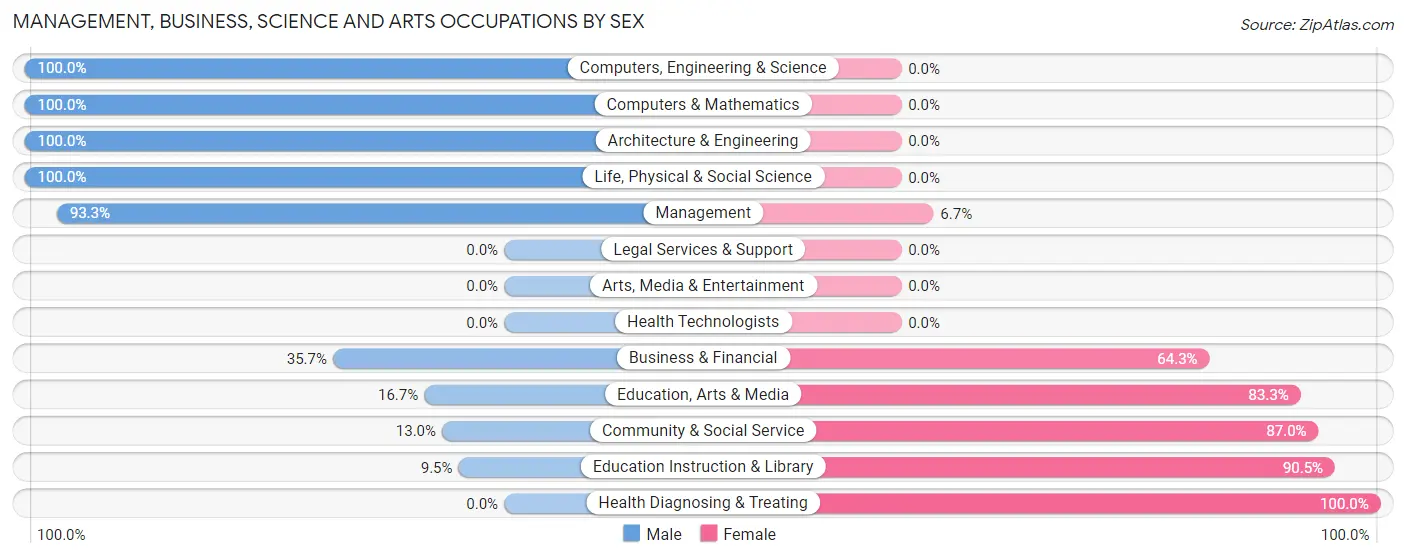
Management, Business, Science and Arts Occupations by Sex
Within the Management, Business, Science and Arts occupations in Bunk Foss, the most male-oriented occupations are Computers, Engineering & Science (100.0%), Computers & Mathematics (100.0%), and Architecture & Engineering (100.0%), while the most female-oriented occupations are Health Diagnosing & Treating (100.0%), Education Instruction & Library (90.5%), and Community & Social Service (87.0%).
| Occupation | Male | Female |
| Management | 125 (93.3%) | 9 (6.7%) |
| Business & Financial | 20 (35.7%) | 36 (64.3%) |
| Computers, Engineering & Science | 94 (100.0%) | 0 (0.0%) |
| Computers & Mathematics | 44 (100.0%) | 0 (0.0%) |
| Architecture & Engineering | 29 (100.0%) | 0 (0.0%) |
| Life, Physical & Social Science | 21 (100.0%) | 0 (0.0%) |
| Community & Social Service | 21 (13.0%) | 141 (87.0%) |
| Education, Arts & Media | 13 (16.7%) | 65 (83.3%) |
| Legal Services & Support | 0 (0.0%) | 0 (0.0%) |
| Education Instruction & Library | 8 (9.5%) | 76 (90.5%) |
| Arts, Media & Entertainment | 0 (0.0%) | 0 (0.0%) |
| Health Diagnosing & Treating | 0 (0.0%) | 52 (100.0%) |
| Health Technologists | 0 (0.0%) | 0 (0.0%) |
| Total (Category) | 260 (52.2%) | 238 (47.8%) |
| Total (Overall) | 1,082 (61.0%) | 692 (39.0%) |
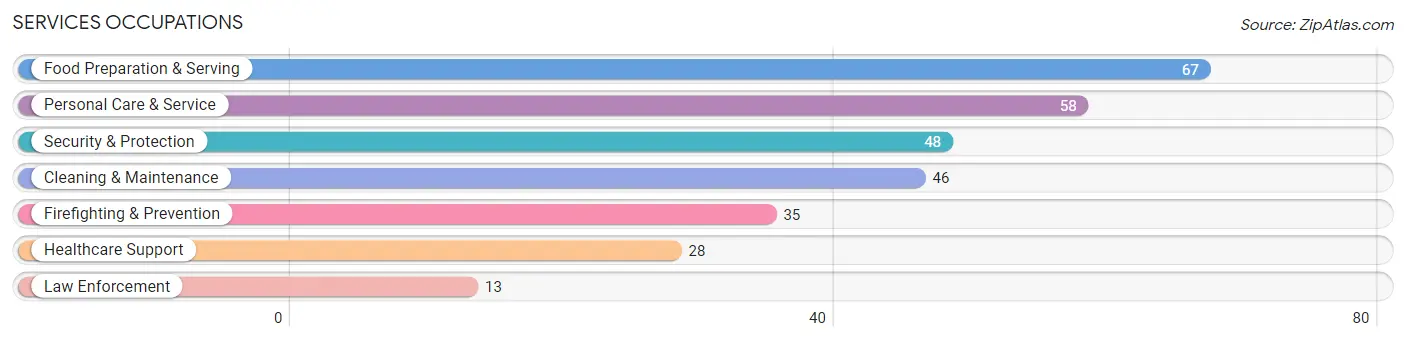
Services Occupations
The most common Services occupations in Bunk Foss are Food Preparation & Serving (67 | 3.8%), Personal Care & Service (58 | 3.3%), Security & Protection (48 | 2.7%), Cleaning & Maintenance (46 | 2.6%), and Firefighting & Prevention (35 | 2.0%).
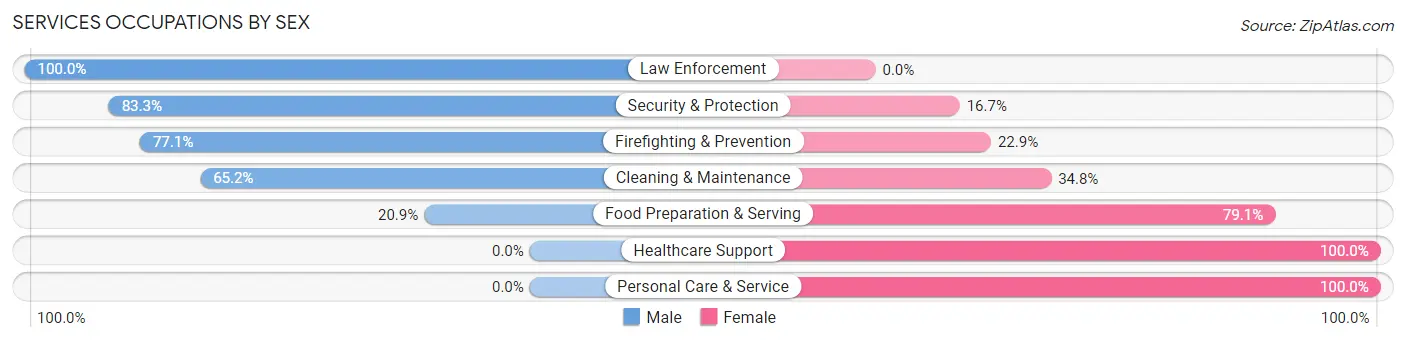
Services Occupations by Sex
Within the Services occupations in Bunk Foss, the most male-oriented occupations are Law Enforcement (100.0%), Security & Protection (83.3%), and Firefighting & Prevention (77.1%), while the most female-oriented occupations are Healthcare Support (100.0%), Personal Care & Service (100.0%), and Food Preparation & Serving (79.1%).
| Occupation | Male | Female |
| Healthcare Support | 0 (0.0%) | 28 (100.0%) |
| Security & Protection | 40 (83.3%) | 8 (16.7%) |
| Firefighting & Prevention | 27 (77.1%) | 8 (22.9%) |
| Law Enforcement | 13 (100.0%) | 0 (0.0%) |
| Food Preparation & Serving | 14 (20.9%) | 53 (79.1%) |
| Cleaning & Maintenance | 30 (65.2%) | 16 (34.8%) |
| Personal Care & Service | 0 (0.0%) | 58 (100.0%) |
| Total (Category) | 84 (34.0%) | 163 (66.0%) |
| Total (Overall) | 1,082 (61.0%) | 692 (39.0%) |
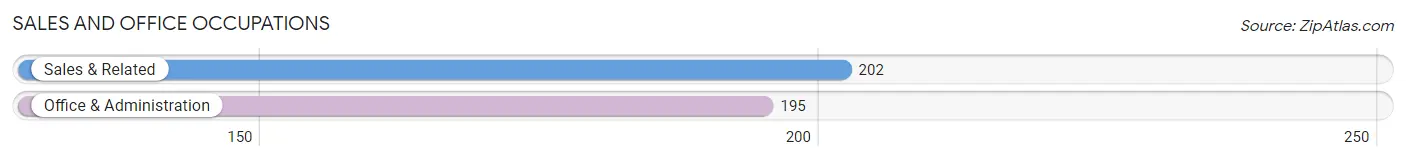
Sales and Office Occupations
The most common Sales and Office occupations in Bunk Foss are Sales & Related (202 | 11.4%), and Office & Administration (195 | 11.0%).
Sales and Office Occupations by Sex
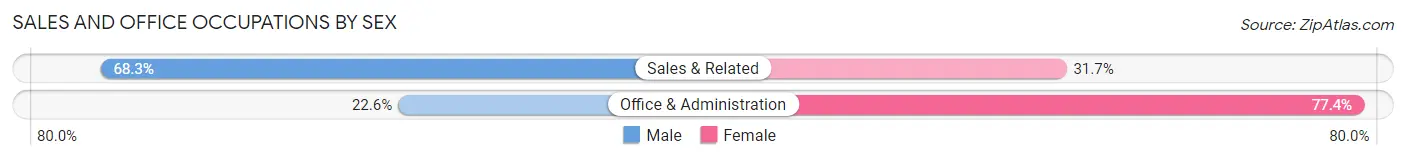
| Occupation | Male | Female |
| Sales & Related | 138 (68.3%) | 64 (31.7%) |
| Office & Administration | 44 (22.6%) | 151 (77.4%) |
| Total (Category) | 182 (45.8%) | 215 (54.2%) |
| Total (Overall) | 1,082 (61.0%) | 692 (39.0%) |
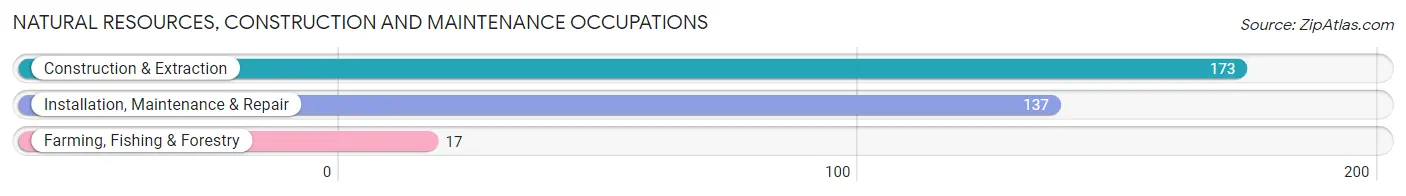
Natural Resources, Construction and Maintenance Occupations
The most common Natural Resources, Construction and Maintenance occupations in Bunk Foss are Construction & Extraction (173 | 9.8%), Installation, Maintenance & Repair (137 | 7.7%), and Farming, Fishing & Forestry (17 | 1.0%).
Natural Resources, Construction and Maintenance Occupations by Sex
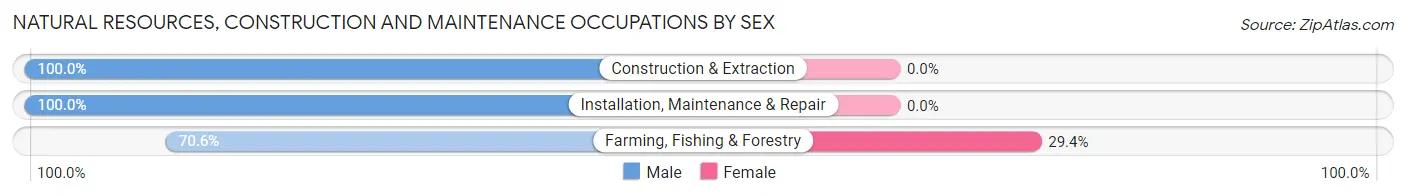
| Occupation | Male | Female |
| Farming, Fishing & Forestry | 12 (70.6%) | 5 (29.4%) |
| Construction & Extraction | 173 (100.0%) | 0 (0.0%) |
| Installation, Maintenance & Repair | 137 (100.0%) | 0 (0.0%) |
| Total (Category) | 322 (98.5%) | 5 (1.5%) |
| Total (Overall) | 1,082 (61.0%) | 692 (39.0%) |
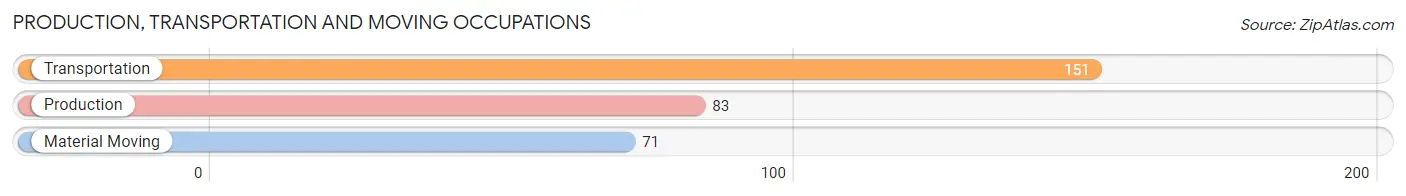
Production, Transportation and Moving Occupations
The most common Production, Transportation and Moving occupations in Bunk Foss are Transportation (151 | 8.5%), Production (83 | 4.7%), and Material Moving (71 | 4.0%).
Production, Transportation and Moving Occupations by Sex
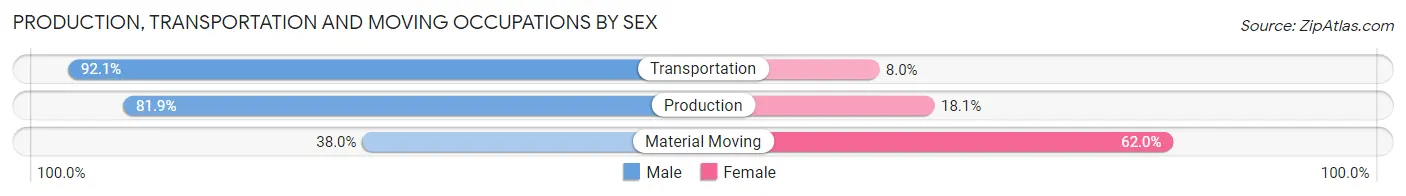
| Occupation | Male | Female |
| Production | 68 (81.9%) | 15 (18.1%) |
| Transportation | 139 (92.0%) | 12 (8.0%) |
| Material Moving | 27 (38.0%) | 44 (62.0%) |
| Total (Category) | 234 (76.7%) | 71 (23.3%) |
| Total (Overall) | 1,082 (61.0%) | 692 (39.0%) |
Employment Industries by Sex in Bunk Foss
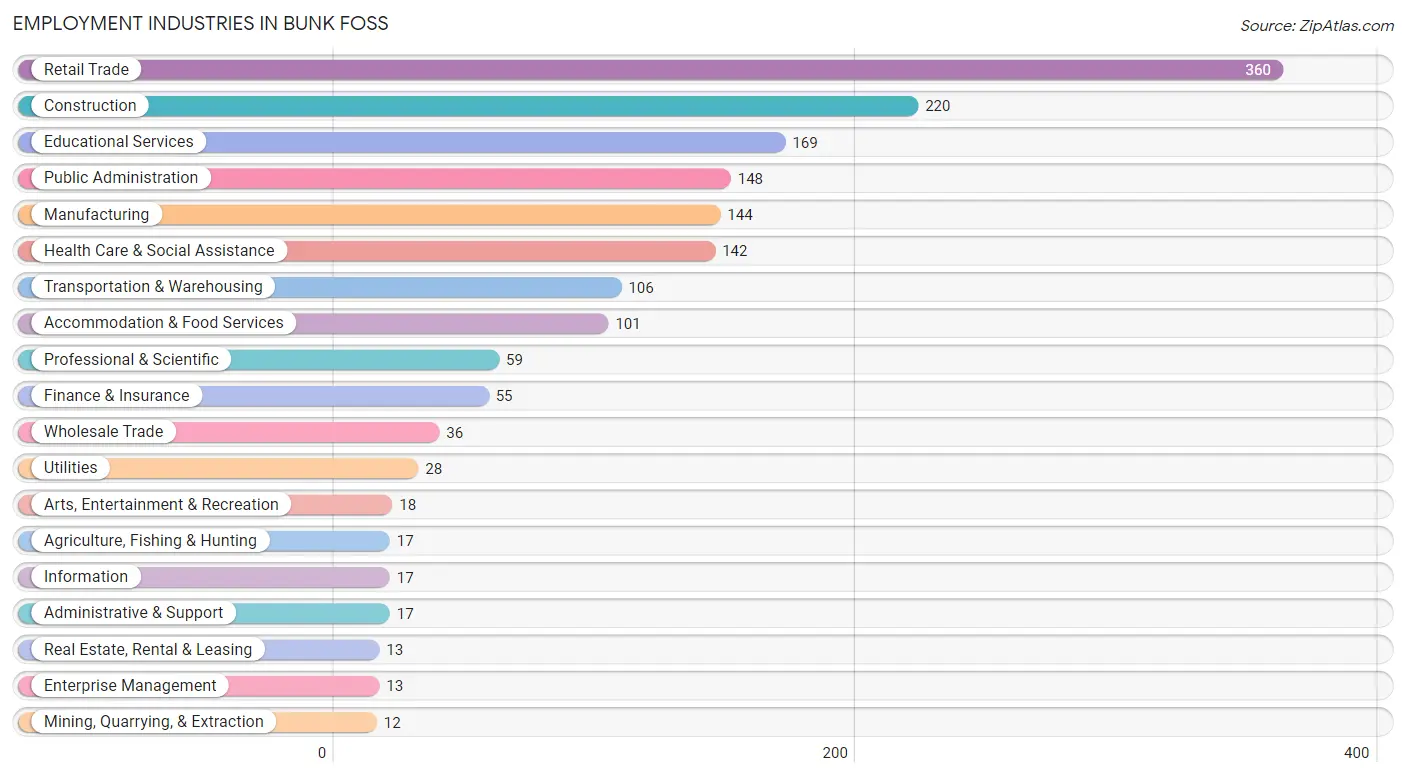
Employment Industries in Bunk Foss
The major employment industries in Bunk Foss include Retail Trade (360 | 20.3%), Construction (220 | 12.4%), Educational Services (169 | 9.5%), Public Administration (148 | 8.3%), and Manufacturing (144 | 8.1%).
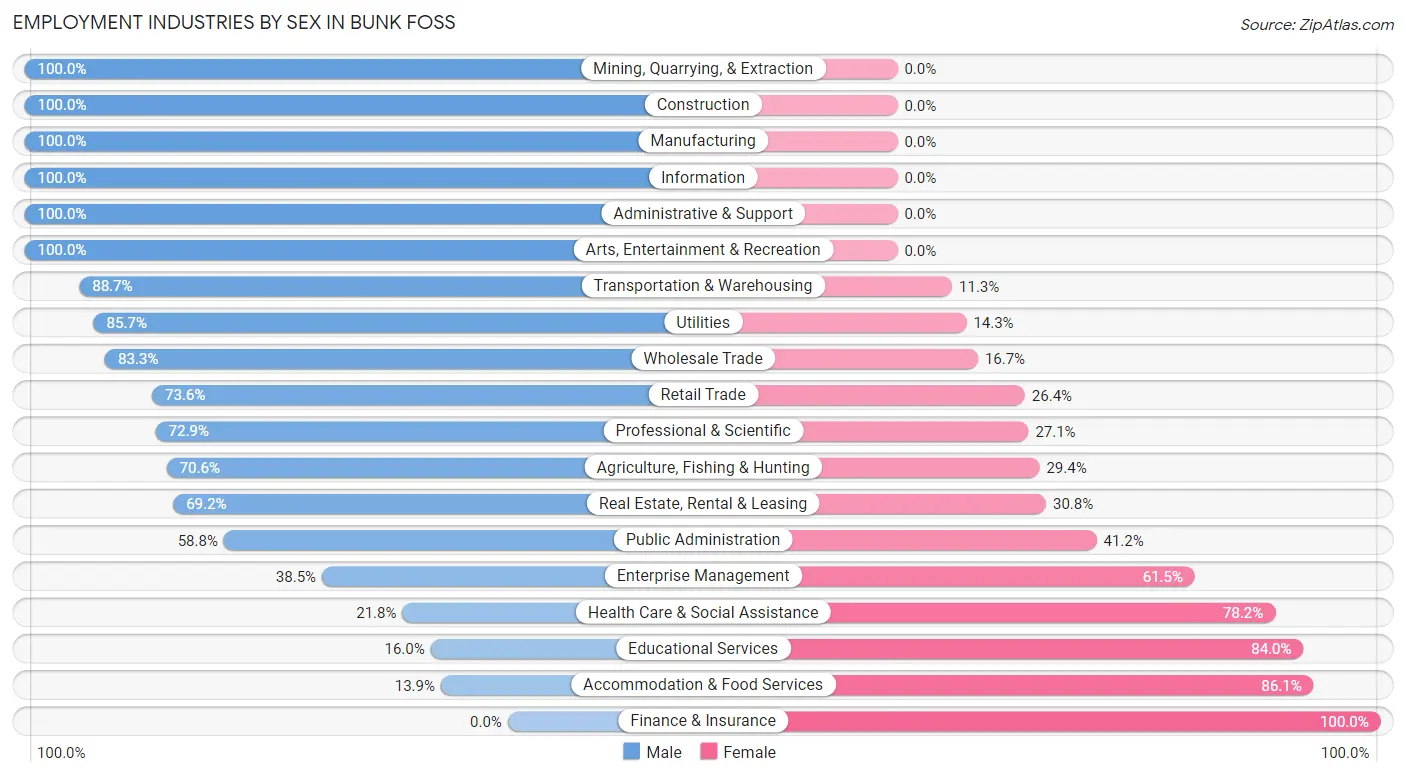
Employment Industries by Sex in Bunk Foss
The Bunk Foss industries that see more men than women are Mining, Quarrying, & Extraction (100.0%), Construction (100.0%), and Manufacturing (100.0%), whereas the industries that tend to have a higher number of women are Finance & Insurance (100.0%), Accommodation & Food Services (86.1%), and Educational Services (84.0%).
| Industry | Male | Female |
| Agriculture, Fishing & Hunting | 12 (70.6%) | 5 (29.4%) |
| Mining, Quarrying, & Extraction | 12 (100.0%) | 0 (0.0%) |
| Construction | 220 (100.0%) | 0 (0.0%) |
| Manufacturing | 144 (100.0%) | 0 (0.0%) |
| Wholesale Trade | 30 (83.3%) | 6 (16.7%) |
| Retail Trade | 265 (73.6%) | 95 (26.4%) |
| Transportation & Warehousing | 94 (88.7%) | 12 (11.3%) |
| Utilities | 24 (85.7%) | 4 (14.3%) |
| Information | 17 (100.0%) | 0 (0.0%) |
| Finance & Insurance | 0 (0.0%) | 55 (100.0%) |
| Real Estate, Rental & Leasing | 9 (69.2%) | 4 (30.8%) |
| Professional & Scientific | 43 (72.9%) | 16 (27.1%) |
| Enterprise Management | 5 (38.5%) | 8 (61.5%) |
| Administrative & Support | 17 (100.0%) | 0 (0.0%) |
| Educational Services | 27 (16.0%) | 142 (84.0%) |
| Health Care & Social Assistance | 31 (21.8%) | 111 (78.2%) |
| Arts, Entertainment & Recreation | 18 (100.0%) | 0 (0.0%) |
| Accommodation & Food Services | 14 (13.9%) | 87 (86.1%) |
| Public Administration | 87 (58.8%) | 61 (41.2%) |
| Total | 1,082 (61.0%) | 692 (39.0%) |
Education in Bunk Foss
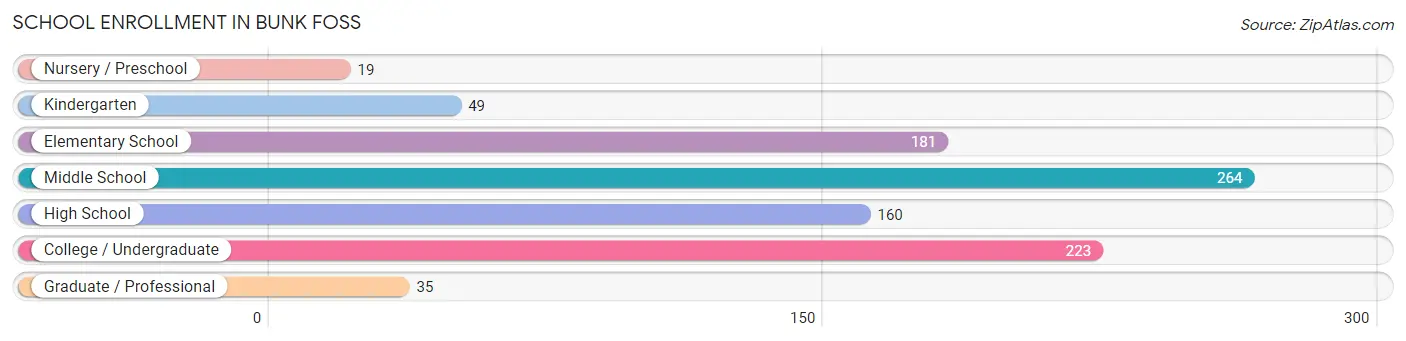
School Enrollment in Bunk Foss
The most common levels of schooling among the 931 students in Bunk Foss are middle school (264 | 28.4%), college / undergraduate (223 | 23.9%), and elementary school (181 | 19.4%).
| School Level | # Students | % Students |
| Nursery / Preschool | 19 | 2.0% |
| Kindergarten | 49 | 5.3% |
| Elementary School | 181 | 19.4% |
| Middle School | 264 | 28.4% |
| High School | 160 | 17.2% |
| College / Undergraduate | 223 | 23.9% |
| Graduate / Professional | 35 | 3.8% |
| Total | 931 | 100.0% |
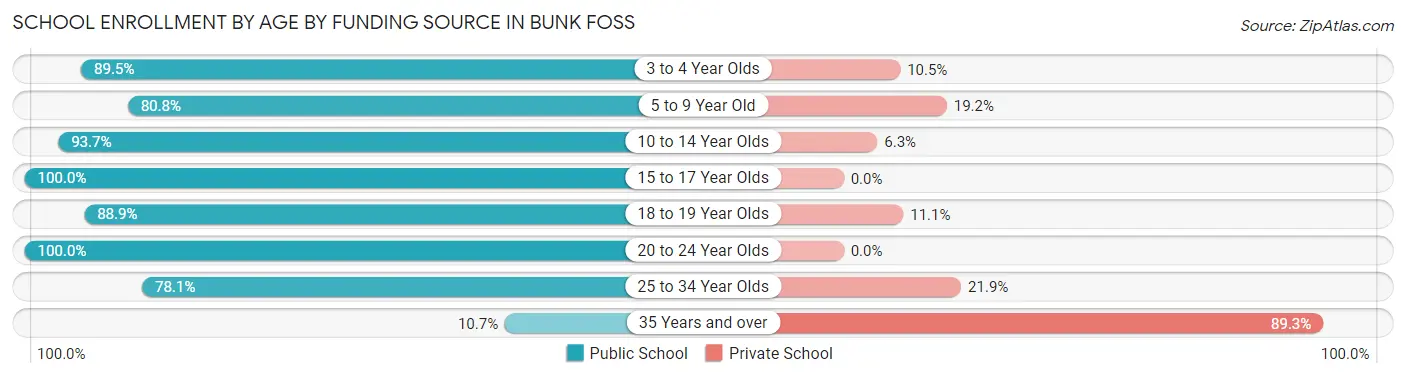
School Enrollment by Age by Funding Source in Bunk Foss
Out of a total of 931 students who are enrolled in schools in Bunk Foss, 103 (11.1%) attend a private institution, while the remaining 828 (88.9%) are enrolled in public schools. The age group of 35 years and over has the highest likelihood of being enrolled in private schools, with 25 (89.3% in the age bracket) enrolled. Conversely, the age group of 15 to 17 year olds has the lowest likelihood of being enrolled in a private school, with 128 (100.0% in the age bracket) attending a public institution.
| Age Bracket | Public School | Private School |
| 3 to 4 Year Olds | 17 (89.5%) | 2 (10.5%) |
| 5 to 9 Year Old | 164 (80.8%) | 39 (19.2%) |
| 10 to 14 Year Olds | 269 (93.7%) | 18 (6.3%) |
| 15 to 17 Year Olds | 128 (100.0%) | 0 (0.0%) |
| 18 to 19 Year Olds | 96 (88.9%) | 12 (11.1%) |
| 20 to 24 Year Olds | 126 (100.0%) | 0 (0.0%) |
| 25 to 34 Year Olds | 25 (78.1%) | 7 (21.9%) |
| 35 Years and over | 3 (10.7%) | 25 (89.3%) |
| Total | 828 (88.9%) | 103 (11.1%) |
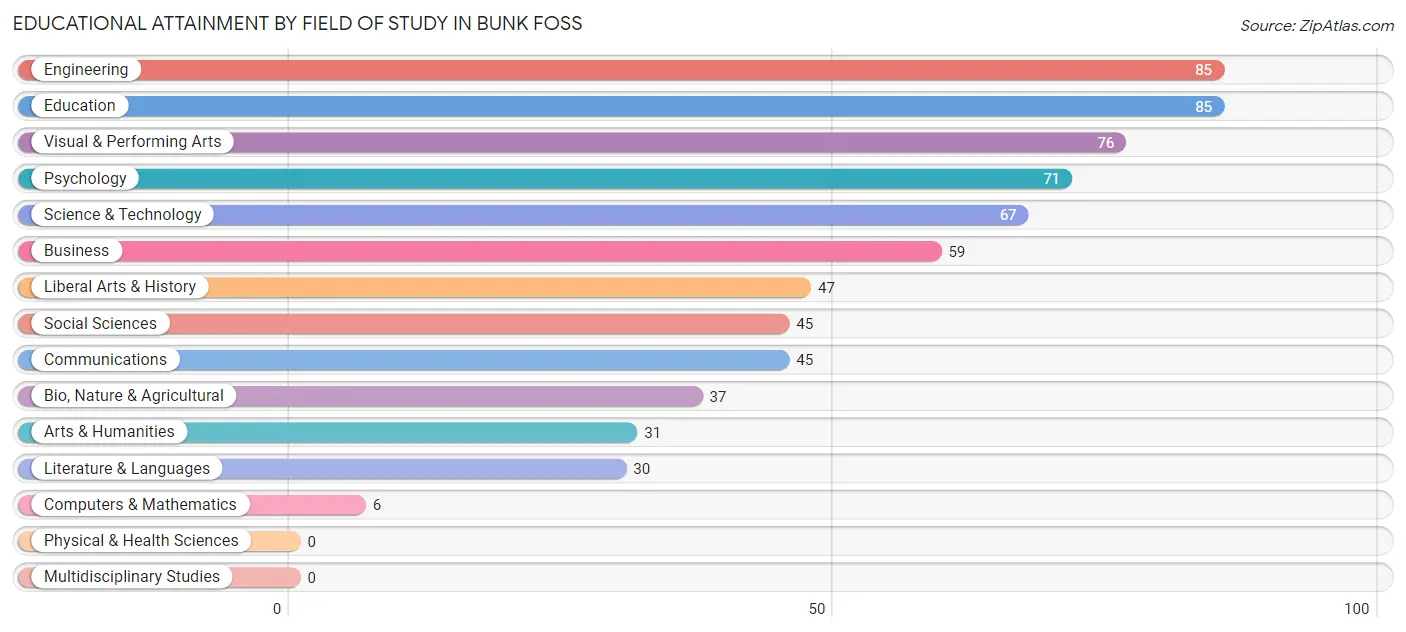
Educational Attainment by Field of Study in Bunk Foss
Engineering (85 | 12.4%), education (85 | 12.4%), visual & performing arts (76 | 11.1%), psychology (71 | 10.4%), and science & technology (67 | 9.8%) are the most common fields of study among 684 individuals in Bunk Foss who have obtained a bachelor's degree or higher.
| Field of Study | # Graduates | % Graduates |
| Computers & Mathematics | 6 | 0.9% |
| Bio, Nature & Agricultural | 37 | 5.4% |
| Physical & Health Sciences | 0 | 0.0% |
| Psychology | 71 | 10.4% |
| Social Sciences | 45 | 6.6% |
| Engineering | 85 | 12.4% |
| Multidisciplinary Studies | 0 | 0.0% |
| Science & Technology | 67 | 9.8% |
| Business | 59 | 8.6% |
| Education | 85 | 12.4% |
| Literature & Languages | 30 | 4.4% |
| Liberal Arts & History | 47 | 6.9% |
| Visual & Performing Arts | 76 | 11.1% |
| Communications | 45 | 6.6% |
| Arts & Humanities | 31 | 4.5% |
| Total | 684 | 100.0% |
Transportation & Commute in Bunk Foss
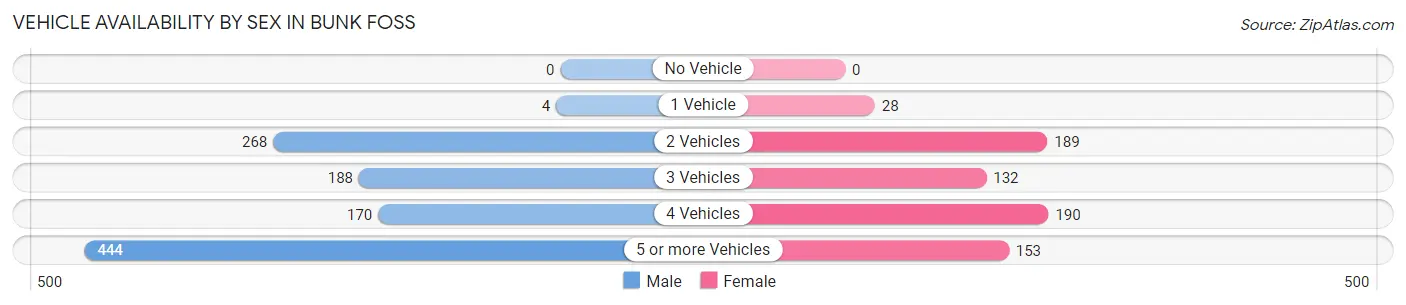
Vehicle Availability by Sex in Bunk Foss
The most prevalent vehicle ownership categories in Bunk Foss are males with 5 or more vehicles (444, accounting for 41.3%) and females with 5 or more vehicles (153, making up 64.2%).
| Vehicles Available | Male | Female |
| No Vehicle | 0 (0.0%) | 0 (0.0%) |
| 1 Vehicle | 4 (0.4%) | 28 (4.1%) |
| 2 Vehicles | 268 (24.9%) | 189 (27.3%) |
| 3 Vehicles | 188 (17.5%) | 132 (19.1%) |
| 4 Vehicles | 170 (15.8%) | 190 (27.5%) |
| 5 or more Vehicles | 444 (41.3%) | 153 (22.1%) |
| Total | 1,074 (100.0%) | 692 (100.0%) |
Commute Time in Bunk Foss
The most frequently occuring commute durations in Bunk Foss are 15 to 19 minutes (340 commuters, 22.5%), 30 to 34 minutes (272 commuters, 18.0%), and 20 to 24 minutes (264 commuters, 17.4%).
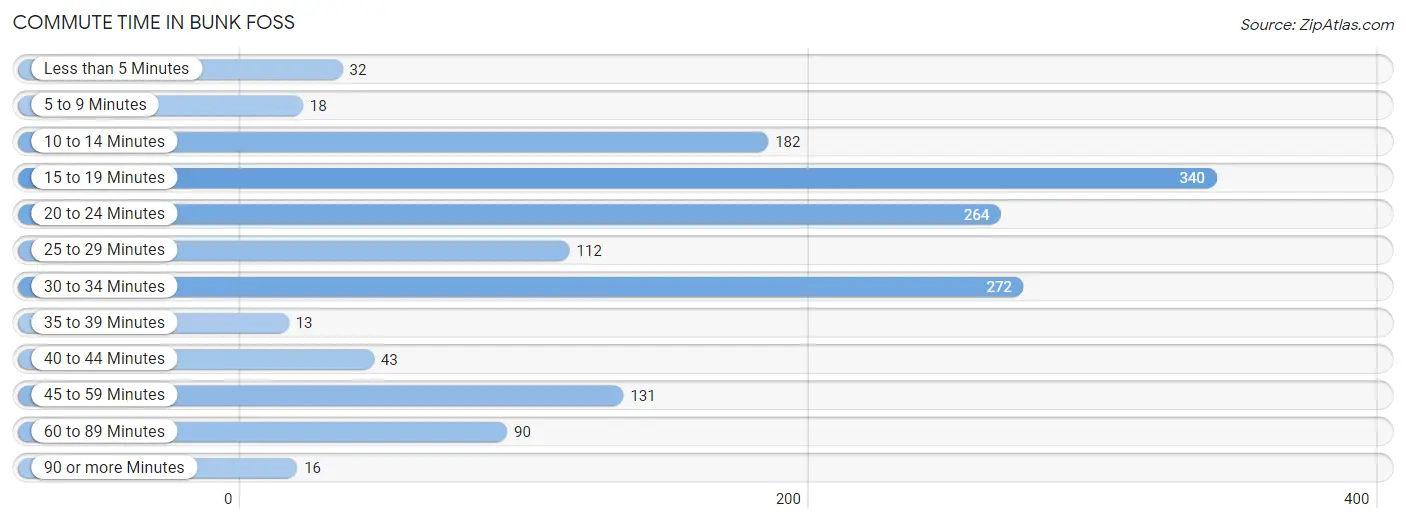
| Commute Time | # Commuters | % Commuters |
| Less than 5 Minutes | 32 | 2.1% |
| 5 to 9 Minutes | 18 | 1.2% |
| 10 to 14 Minutes | 182 | 12.0% |
| 15 to 19 Minutes | 340 | 22.5% |
| 20 to 24 Minutes | 264 | 17.4% |
| 25 to 29 Minutes | 112 | 7.4% |
| 30 to 34 Minutes | 272 | 18.0% |
| 35 to 39 Minutes | 13 | 0.9% |
| 40 to 44 Minutes | 43 | 2.8% |
| 45 to 59 Minutes | 131 | 8.7% |
| 60 to 89 Minutes | 90 | 5.9% |
| 90 or more Minutes | 16 | 1.1% |
Commute Time by Sex in Bunk Foss
The most common commute times in Bunk Foss are 15 to 19 minutes (214 commuters, 22.5%) for males and 15 to 19 minutes (126 commuters, 22.4%) for females.
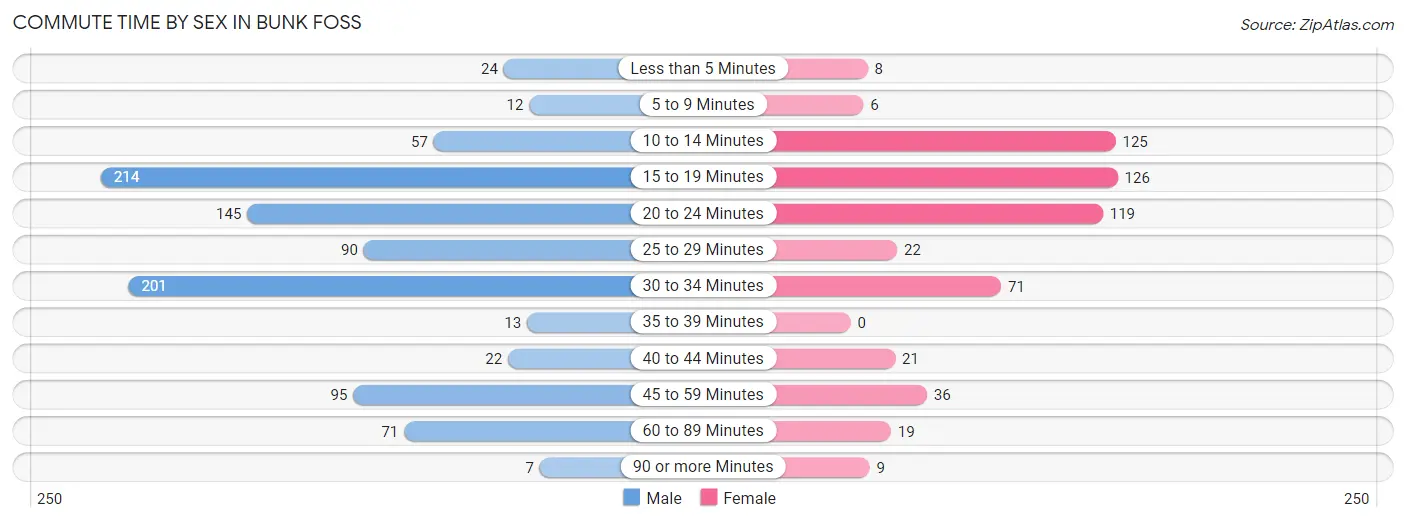
| Commute Time | Male | Female |
| Less than 5 Minutes | 24 (2.5%) | 8 (1.4%) |
| 5 to 9 Minutes | 12 (1.3%) | 6 (1.1%) |
| 10 to 14 Minutes | 57 (6.0%) | 125 (22.2%) |
| 15 to 19 Minutes | 214 (22.5%) | 126 (22.4%) |
| 20 to 24 Minutes | 145 (15.2%) | 119 (21.2%) |
| 25 to 29 Minutes | 90 (9.5%) | 22 (3.9%) |
| 30 to 34 Minutes | 201 (21.1%) | 71 (12.6%) |
| 35 to 39 Minutes | 13 (1.4%) | 0 (0.0%) |
| 40 to 44 Minutes | 22 (2.3%) | 21 (3.7%) |
| 45 to 59 Minutes | 95 (10.0%) | 36 (6.4%) |
| 60 to 89 Minutes | 71 (7.5%) | 19 (3.4%) |
| 90 or more Minutes | 7 (0.7%) | 9 (1.6%) |
Time of Departure to Work by Sex in Bunk Foss
The most frequent times of departure to work in Bunk Foss are 7:00 AM to 7:29 AM (273, 28.7%) for males and 7:30 AM to 7:59 AM (102, 18.1%) for females.
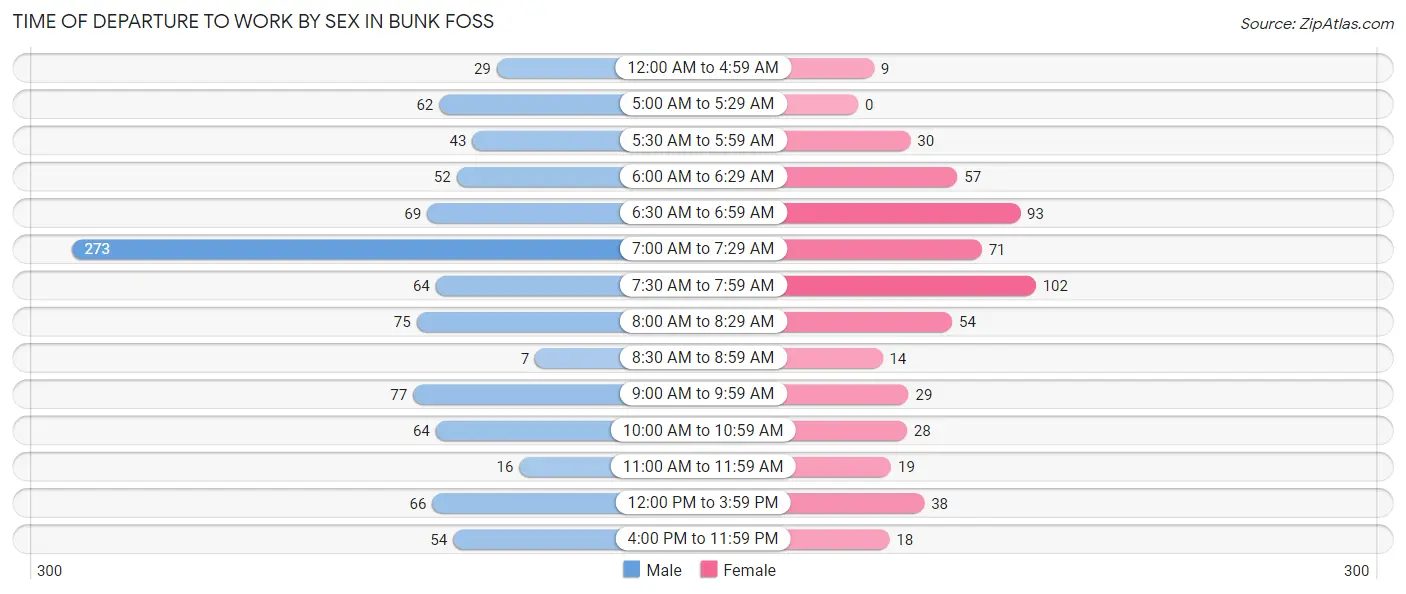
| Time of Departure | Male | Female |
| 12:00 AM to 4:59 AM | 29 (3.0%) | 9 (1.6%) |
| 5:00 AM to 5:29 AM | 62 (6.5%) | 0 (0.0%) |
| 5:30 AM to 5:59 AM | 43 (4.5%) | 30 (5.3%) |
| 6:00 AM to 6:29 AM | 52 (5.5%) | 57 (10.1%) |
| 6:30 AM to 6:59 AM | 69 (7.3%) | 93 (16.6%) |
| 7:00 AM to 7:29 AM | 273 (28.7%) | 71 (12.6%) |
| 7:30 AM to 7:59 AM | 64 (6.7%) | 102 (18.1%) |
| 8:00 AM to 8:29 AM | 75 (7.9%) | 54 (9.6%) |
| 8:30 AM to 8:59 AM | 7 (0.7%) | 14 (2.5%) |
| 9:00 AM to 9:59 AM | 77 (8.1%) | 29 (5.2%) |
| 10:00 AM to 10:59 AM | 64 (6.7%) | 28 (5.0%) |
| 11:00 AM to 11:59 AM | 16 (1.7%) | 19 (3.4%) |
| 12:00 PM to 3:59 PM | 66 (6.9%) | 38 (6.8%) |
| 4:00 PM to 11:59 PM | 54 (5.7%) | 18 (3.2%) |
| Total | 951 (100.0%) | 562 (100.0%) |
Housing Occupancy in Bunk Foss
Occupancy by Ownership in Bunk Foss
Of the total 1,211 dwellings in Bunk Foss, owner-occupied units account for 1,088 (89.8%), while renter-occupied units make up 123 (10.2%).
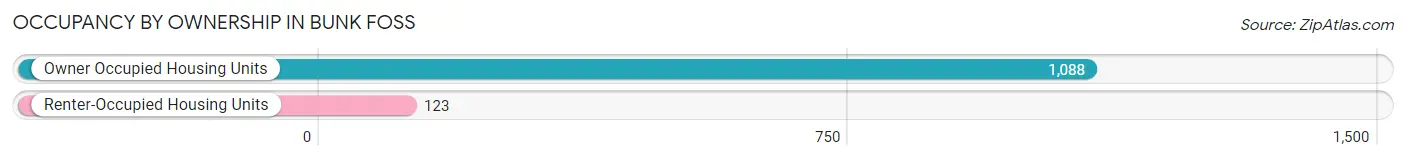
| Occupancy | # Housing Units | % Housing Units |
| Owner Occupied Housing Units | 1,088 | 89.8% |
| Renter-Occupied Housing Units | 123 | 10.2% |
| Total Occupied Housing Units | 1,211 | 100.0% |
Occupancy by Household Size in Bunk Foss
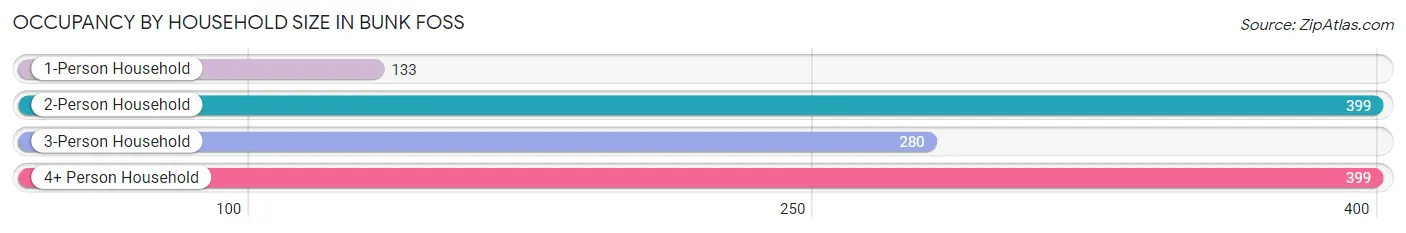
| Household Size | # Housing Units | % Housing Units |
| 1-Person Household | 133 | 11.0% |
| 2-Person Household | 399 | 33.0% |
| 3-Person Household | 280 | 23.1% |
| 4+ Person Household | 399 | 33.0% |
| Total Housing Units | 1,211 | 100.0% |
Occupancy by Ownership by Household Size in Bunk Foss
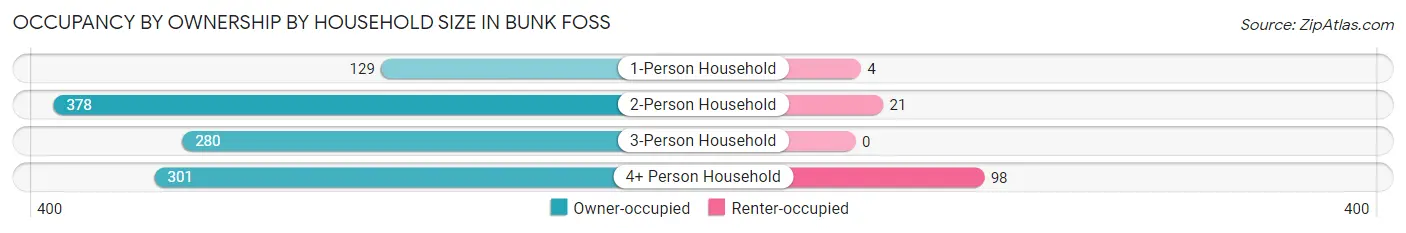
| Household Size | Owner-occupied | Renter-occupied |
| 1-Person Household | 129 (97.0%) | 4 (3.0%) |
| 2-Person Household | 378 (94.7%) | 21 (5.3%) |
| 3-Person Household | 280 (100.0%) | 0 (0.0%) |
| 4+ Person Household | 301 (75.4%) | 98 (24.6%) |
| Total Housing Units | 1,088 (89.8%) | 123 (10.2%) |
Occupancy by Educational Attainment in Bunk Foss
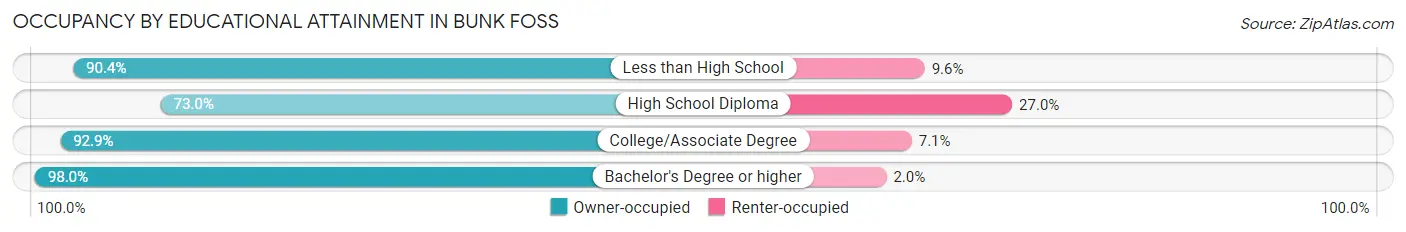
| Household Size | Owner-occupied | Renter-occupied |
| Less than High School | 47 (90.4%) | 5 (9.6%) |
| High School Diploma | 214 (73.0%) | 79 (27.0%) |
| College/Associate Degree | 395 (92.9%) | 30 (7.1%) |
| Bachelor's Degree or higher | 432 (98.0%) | 9 (2.0%) |
Occupancy by Age of Householder in Bunk Foss
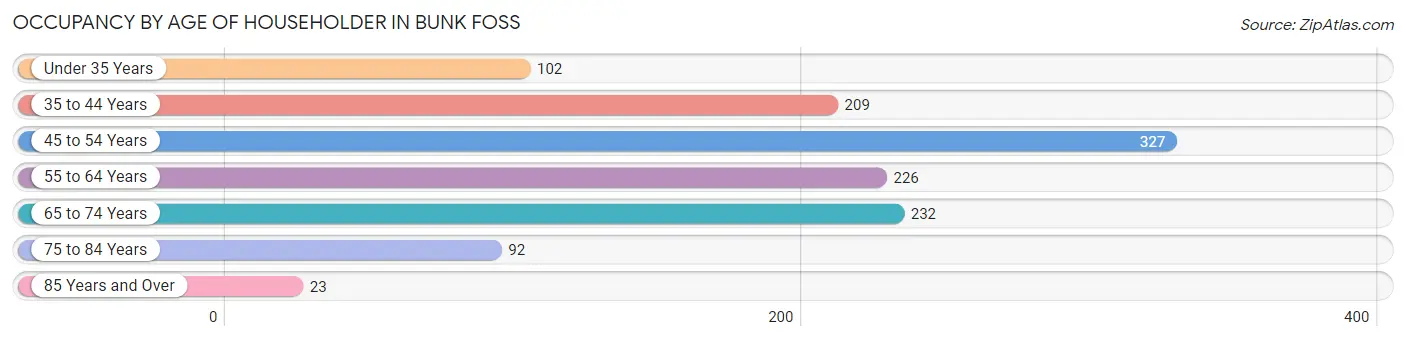
| Age Bracket | # Households | % Households |
| Under 35 Years | 102 | 8.4% |
| 35 to 44 Years | 209 | 17.3% |
| 45 to 54 Years | 327 | 27.0% |
| 55 to 64 Years | 226 | 18.7% |
| 65 to 74 Years | 232 | 19.2% |
| 75 to 84 Years | 92 | 7.6% |
| 85 Years and Over | 23 | 1.9% |
| Total | 1,211 | 100.0% |
Housing Finances in Bunk Foss
Median Income by Occupancy in Bunk Foss
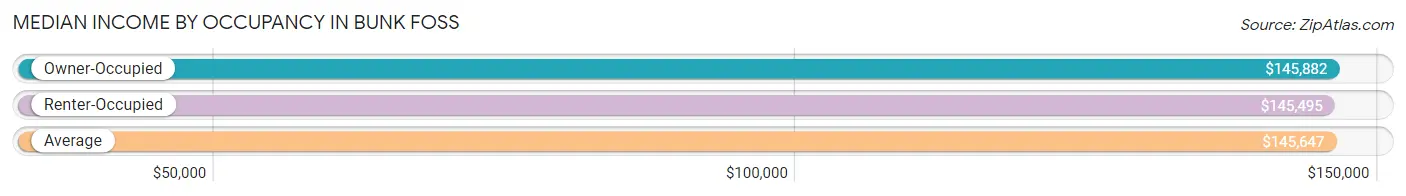
| Occupancy Type | # Households | Median Income |
| Owner-Occupied | 1,088 (89.8%) | $145,882 |
| Renter-Occupied | 123 (10.2%) | $145,495 |
| Average | 1,211 (100.0%) | $145,647 |
Occupancy by Householder Income Bracket in Bunk Foss
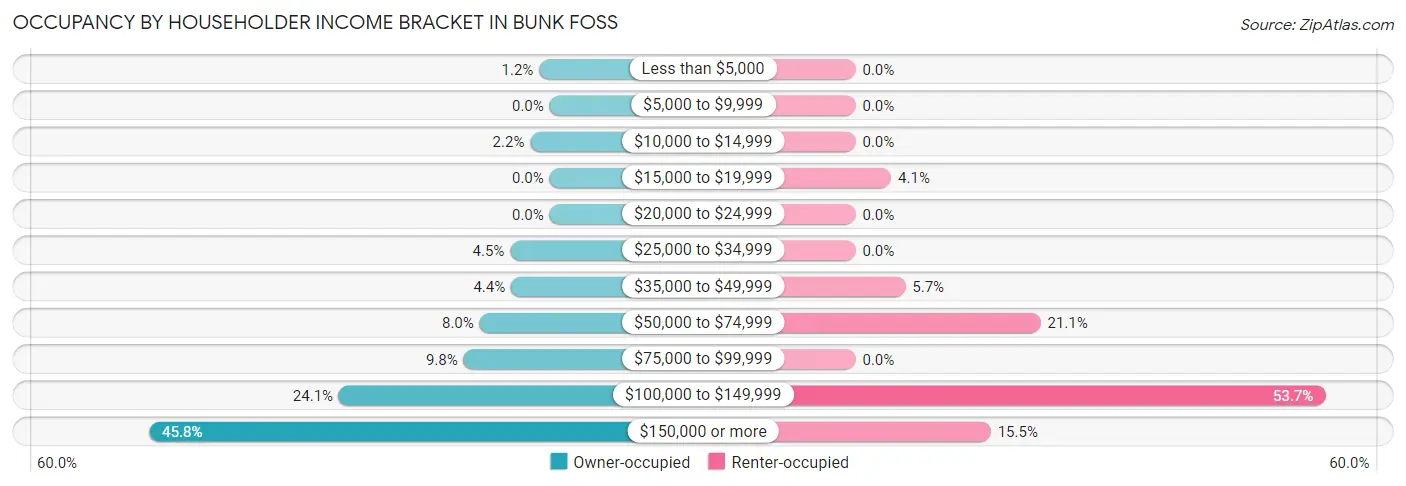
| Income Bracket | Owner-occupied | Renter-occupied |
| Less than $5,000 | 13 (1.2%) | 0 (0.0%) |
| $5,000 to $9,999 | 0 (0.0%) | 0 (0.0%) |
| $10,000 to $14,999 | 24 (2.2%) | 0 (0.0%) |
| $15,000 to $19,999 | 0 (0.0%) | 5 (4.1%) |
| $20,000 to $24,999 | 0 (0.0%) | 0 (0.0%) |
| $25,000 to $34,999 | 49 (4.5%) | 0 (0.0%) |
| $35,000 to $49,999 | 48 (4.4%) | 7 (5.7%) |
| $50,000 to $74,999 | 87 (8.0%) | 26 (21.1%) |
| $75,000 to $99,999 | 107 (9.8%) | 0 (0.0%) |
| $100,000 to $149,999 | 262 (24.1%) | 66 (53.7%) |
| $150,000 or more | 498 (45.8%) | 19 (15.4%) |
| Total | 1,088 (100.0%) | 123 (100.0%) |
Monthly Housing Cost Tiers in Bunk Foss
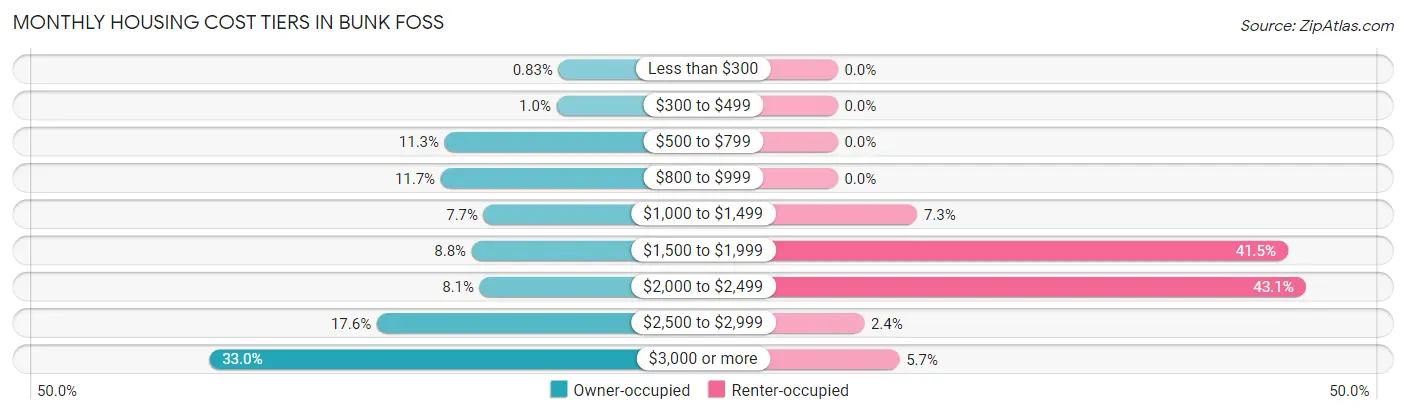
| Monthly Cost | Owner-occupied | Renter-occupied |
| Less than $300 | 9 (0.8%) | 0 (0.0%) |
| $300 to $499 | 11 (1.0%) | 0 (0.0%) |
| $500 to $799 | 123 (11.3%) | 0 (0.0%) |
| $800 to $999 | 127 (11.7%) | 0 (0.0%) |
| $1,000 to $1,499 | 84 (7.7%) | 9 (7.3%) |
| $1,500 to $1,999 | 96 (8.8%) | 51 (41.5%) |
| $2,000 to $2,499 | 88 (8.1%) | 53 (43.1%) |
| $2,500 to $2,999 | 191 (17.6%) | 3 (2.4%) |
| $3,000 or more | 359 (33.0%) | 7 (5.7%) |
| Total | 1,088 (100.0%) | 123 (100.0%) |
Physical Housing Characteristics in Bunk Foss
Housing Structures in Bunk Foss
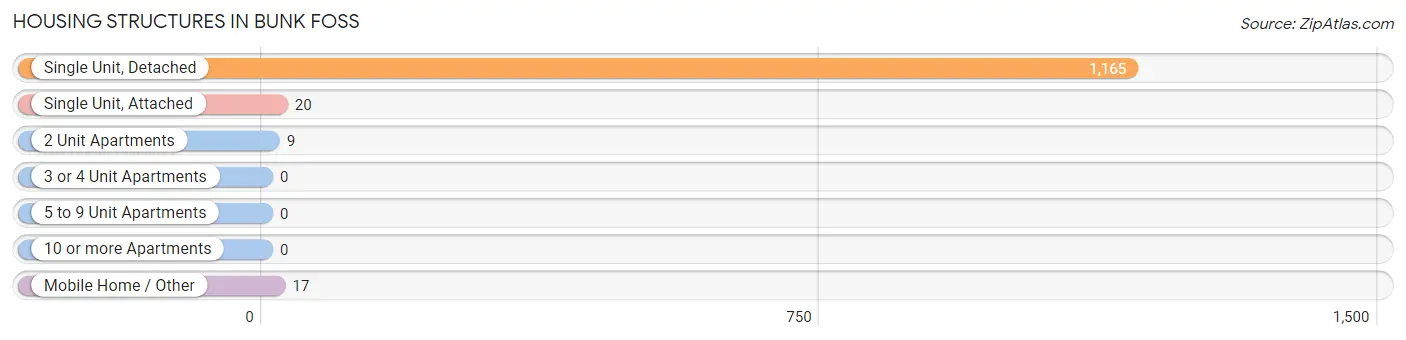
| Structure Type | # Housing Units | % Housing Units |
| Single Unit, Detached | 1,165 | 96.2% |
| Single Unit, Attached | 20 | 1.7% |
| 2 Unit Apartments | 9 | 0.7% |
| 3 or 4 Unit Apartments | 0 | 0.0% |
| 5 to 9 Unit Apartments | 0 | 0.0% |
| 10 or more Apartments | 0 | 0.0% |
| Mobile Home / Other | 17 | 1.4% |
| Total | 1,211 | 100.0% |
Housing Structures by Occupancy in Bunk Foss
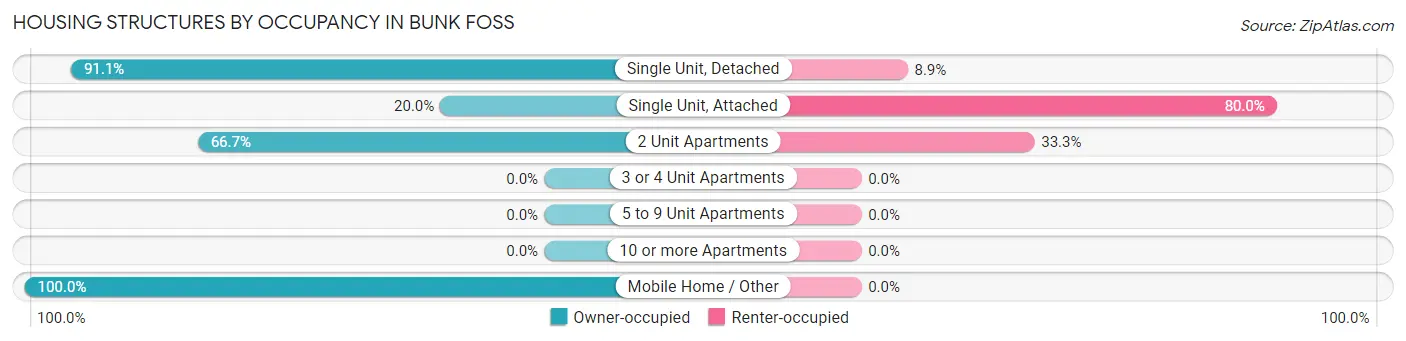
| Structure Type | Owner-occupied | Renter-occupied |
| Single Unit, Detached | 1,061 (91.1%) | 104 (8.9%) |
| Single Unit, Attached | 4 (20.0%) | 16 (80.0%) |
| 2 Unit Apartments | 6 (66.7%) | 3 (33.3%) |
| 3 or 4 Unit Apartments | 0 (0.0%) | 0 (0.0%) |
| 5 to 9 Unit Apartments | 0 (0.0%) | 0 (0.0%) |
| 10 or more Apartments | 0 (0.0%) | 0 (0.0%) |
| Mobile Home / Other | 17 (100.0%) | 0 (0.0%) |
| Total | 1,088 (89.8%) | 123 (10.2%) |
Housing Structures by Number of Rooms in Bunk Foss
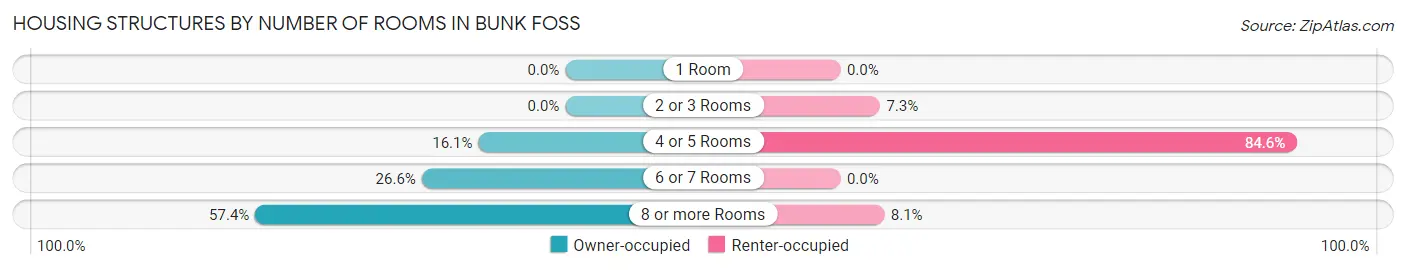
| Number of Rooms | Owner-occupied | Renter-occupied |
| 1 Room | 0 (0.0%) | 0 (0.0%) |
| 2 or 3 Rooms | 0 (0.0%) | 9 (7.3%) |
| 4 or 5 Rooms | 175 (16.1%) | 104 (84.6%) |
| 6 or 7 Rooms | 289 (26.6%) | 0 (0.0%) |
| 8 or more Rooms | 624 (57.4%) | 10 (8.1%) |
| Total | 1,088 (100.0%) | 123 (100.0%) |
Housing Structure by Heating Type in Bunk Foss
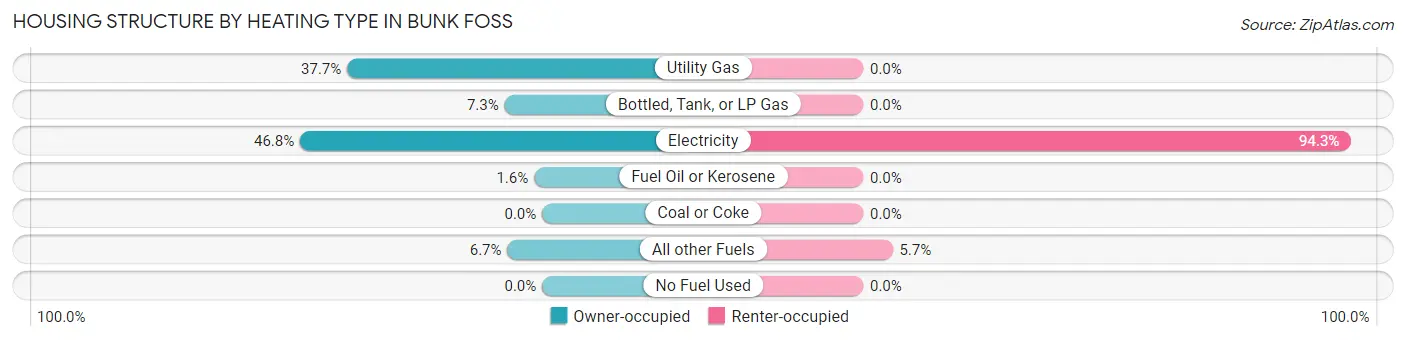
| Heating Type | Owner-occupied | Renter-occupied |
| Utility Gas | 410 (37.7%) | 0 (0.0%) |
| Bottled, Tank, or LP Gas | 79 (7.3%) | 0 (0.0%) |
| Electricity | 509 (46.8%) | 116 (94.3%) |
| Fuel Oil or Kerosene | 17 (1.6%) | 0 (0.0%) |
| Coal or Coke | 0 (0.0%) | 0 (0.0%) |
| All other Fuels | 73 (6.7%) | 7 (5.7%) |
| No Fuel Used | 0 (0.0%) | 0 (0.0%) |
| Total | 1,088 (100.0%) | 123 (100.0%) |
Household Vehicle Usage in Bunk Foss
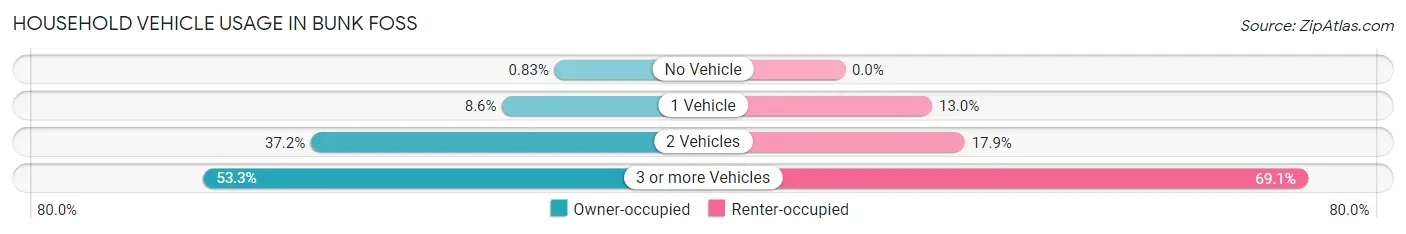
| Vehicles per Household | Owner-occupied | Renter-occupied |
| No Vehicle | 9 (0.8%) | 0 (0.0%) |
| 1 Vehicle | 94 (8.6%) | 16 (13.0%) |
| 2 Vehicles | 405 (37.2%) | 22 (17.9%) |
| 3 or more Vehicles | 580 (53.3%) | 85 (69.1%) |
| Total | 1,088 (100.0%) | 123 (100.0%) |
Real Estate & Mortgages in Bunk Foss
Real Estate and Mortgage Overview in Bunk Foss
| Characteristic | Without Mortgage | With Mortgage |
| Housing Units | 294 | 794 |
| Median Property Value | $636,200 | $745,000 |
| Median Household Income | $75,357 | $470 |
| Monthly Housing Costs | $820 | $359 |
| Real Estate Taxes | $5,930 | $0 |
Property Value by Mortgage Status in Bunk Foss
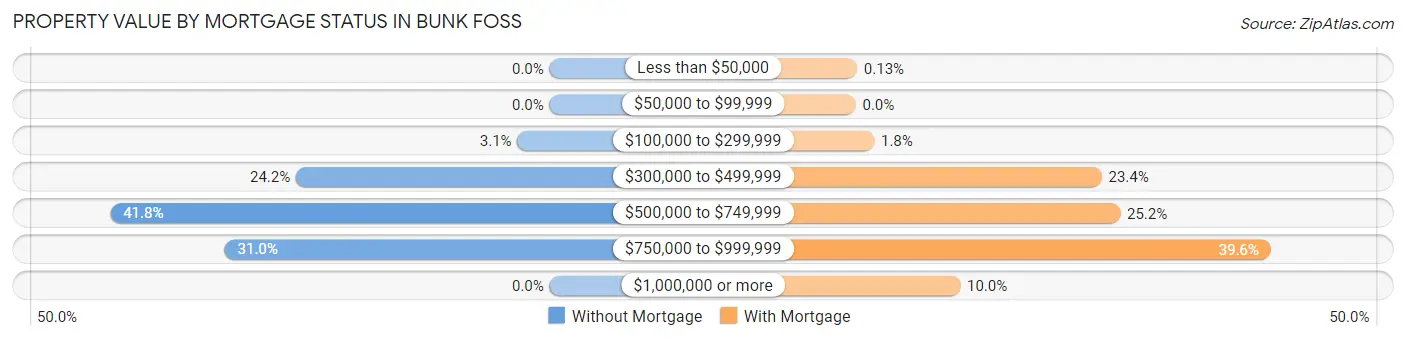
| Property Value | Without Mortgage | With Mortgage |
| Less than $50,000 | 0 (0.0%) | 1 (0.1%) |
| $50,000 to $99,999 | 0 (0.0%) | 0 (0.0%) |
| $100,000 to $299,999 | 9 (3.1%) | 14 (1.8%) |
| $300,000 to $499,999 | 71 (24.1%) | 186 (23.4%) |
| $500,000 to $749,999 | 123 (41.8%) | 200 (25.2%) |
| $750,000 to $999,999 | 91 (30.9%) | 314 (39.6%) |
| $1,000,000 or more | 0 (0.0%) | 79 (10.0%) |
| Total | 294 (100.0%) | 794 (100.0%) |
Household Income by Mortgage Status in Bunk Foss
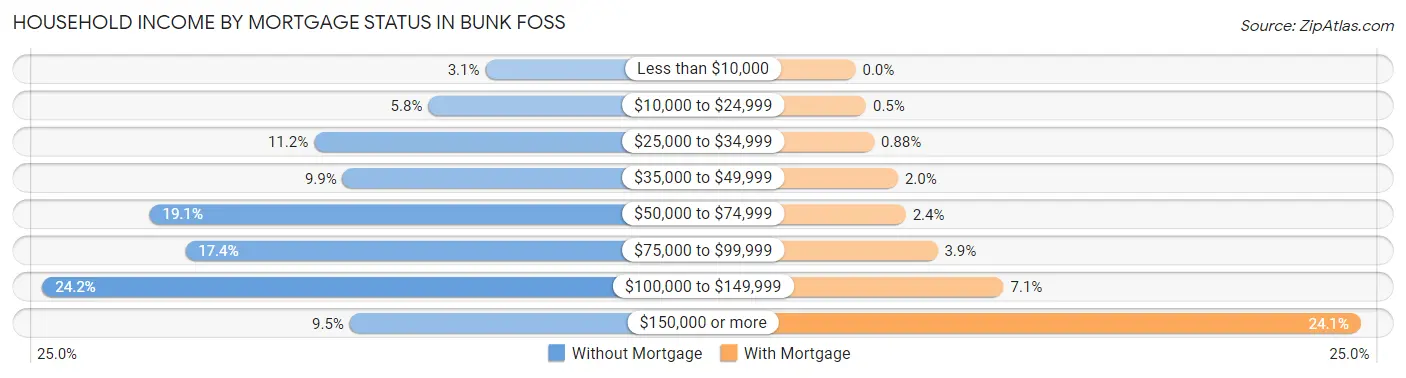
| Household Income | Without Mortgage | With Mortgage |
| Less than $10,000 | 9 (3.1%) | 0 (0.0%) |
| $10,000 to $24,999 | 17 (5.8%) | 4 (0.5%) |
| $25,000 to $34,999 | 33 (11.2%) | 7 (0.9%) |
| $35,000 to $49,999 | 29 (9.9%) | 16 (2.0%) |
| $50,000 to $74,999 | 56 (19.1%) | 19 (2.4%) |
| $75,000 to $99,999 | 51 (17.3%) | 31 (3.9%) |
| $100,000 to $149,999 | 71 (24.1%) | 56 (7.0%) |
| $150,000 or more | 28 (9.5%) | 191 (24.1%) |
| Total | 294 (100.0%) | 794 (100.0%) |
Property Value to Household Income Ratio in Bunk Foss
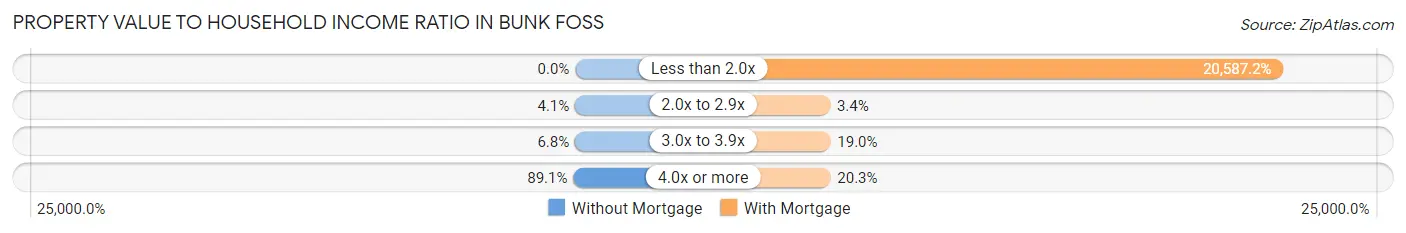
| Value-to-Income Ratio | Without Mortgage | With Mortgage |
| Less than 2.0x | 0 (0.0%) | 163,462 (20,587.1%) |
| 2.0x to 2.9x | 12 (4.1%) | 27 (3.4%) |
| 3.0x to 3.9x | 20 (6.8%) | 151 (19.0%) |
| 4.0x or more | 262 (89.1%) | 161 (20.3%) |
| Total | 294 (100.0%) | 794 (100.0%) |
Real Estate Taxes by Mortgage Status in Bunk Foss
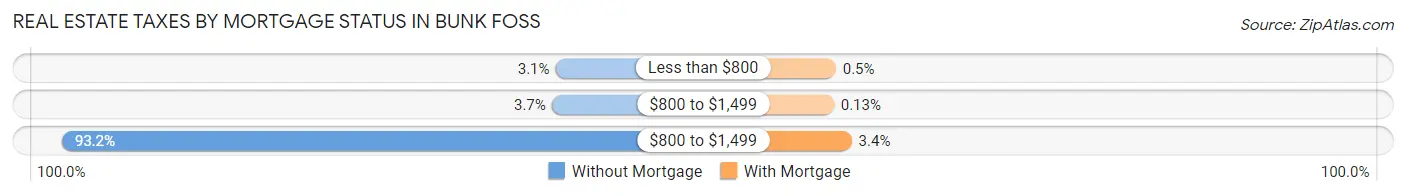
| Property Taxes | Without Mortgage | With Mortgage |
| Less than $800 | 9 (3.1%) | 4 (0.5%) |
| $800 to $1,499 | 11 (3.7%) | 1 (0.1%) |
| $800 to $1,499 | 274 (93.2%) | 27 (3.4%) |
| Total | 294 (100.0%) | 794 (100.0%) |
Health & Disability in Bunk Foss
Health Insurance Coverage by Age in Bunk Foss
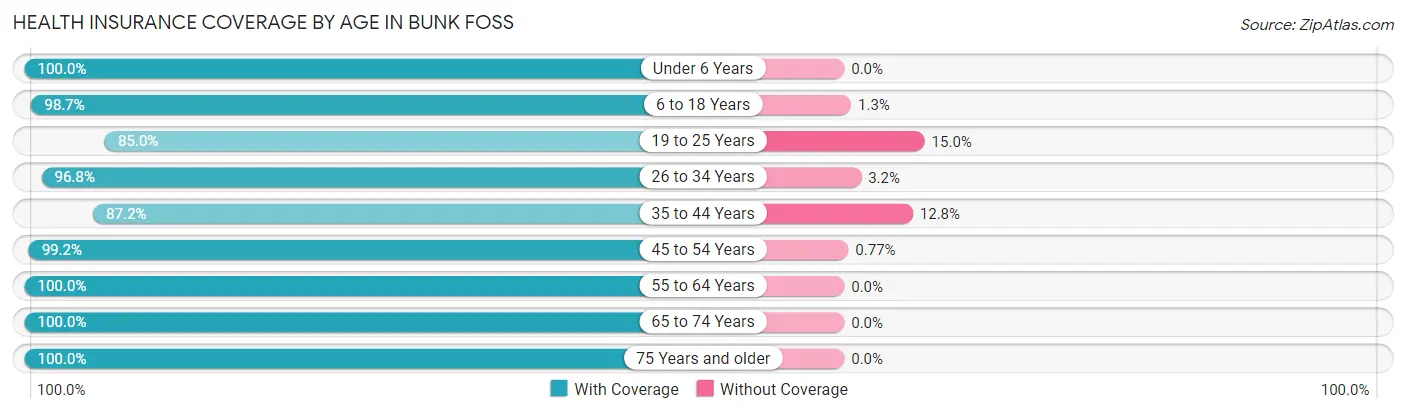
| Age Bracket | With Coverage | Without Coverage |
| Under 6 Years | 183 (100.0%) | 0 (0.0%) |
| 6 to 18 Years | 624 (98.7%) | 8 (1.3%) |
| 19 to 25 Years | 329 (85.0%) | 58 (15.0%) |
| 26 to 34 Years | 276 (96.8%) | 9 (3.2%) |
| 35 to 44 Years | 334 (87.2%) | 49 (12.8%) |
| 45 to 54 Years | 644 (99.2%) | 5 (0.8%) |
| 55 to 64 Years | 490 (100.0%) | 0 (0.0%) |
| 65 to 74 Years | 375 (100.0%) | 0 (0.0%) |
| 75 Years and older | 255 (100.0%) | 0 (0.0%) |
| Total | 3,510 (96.5%) | 129 (3.5%) |
Health Insurance Coverage by Citizenship Status in Bunk Foss
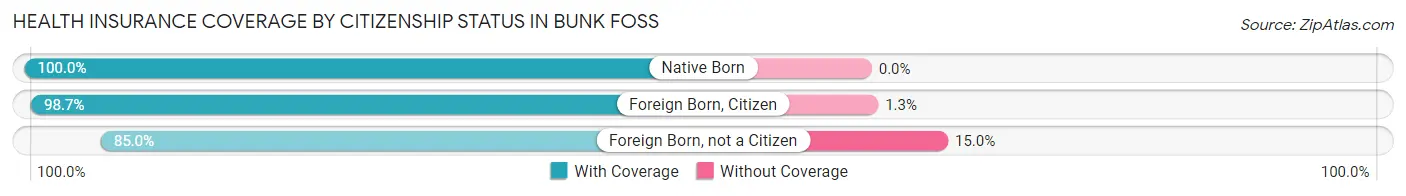
| Citizenship Status | With Coverage | Without Coverage |
| Native Born | 183 (100.0%) | 0 (0.0%) |
| Foreign Born, Citizen | 624 (98.7%) | 8 (1.3%) |
| Foreign Born, not a Citizen | 329 (85.0%) | 58 (15.0%) |
Health Insurance Coverage by Household Income in Bunk Foss
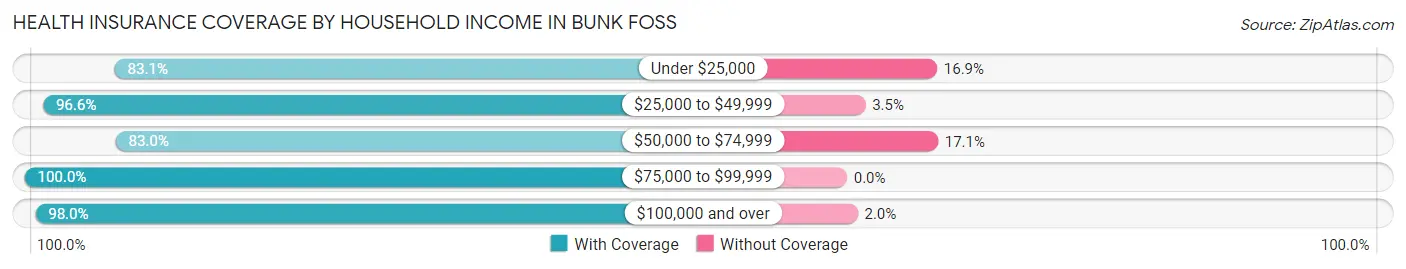
| Household Income | With Coverage | Without Coverage |
| Under $25,000 | 64 (83.1%) | 13 (16.9%) |
| $25,000 to $49,999 | 196 (96.6%) | 7 (3.5%) |
| $50,000 to $74,999 | 253 (83.0%) | 52 (17.1%) |
| $75,000 to $99,999 | 208 (100.0%) | 0 (0.0%) |
| $100,000 and over | 2,778 (98.0%) | 57 (2.0%) |
Public vs Private Health Insurance Coverage by Age in Bunk Foss
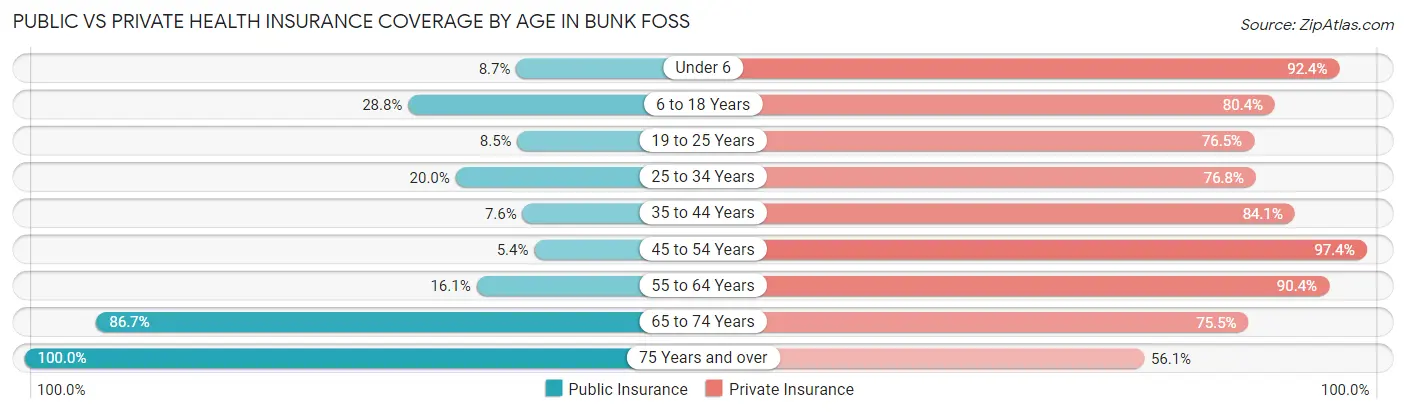
| Age Bracket | Public Insurance | Private Insurance |
| Under 6 | 16 (8.7%) | 169 (92.3%) |
| 6 to 18 Years | 182 (28.8%) | 508 (80.4%) |
| 19 to 25 Years | 33 (8.5%) | 296 (76.5%) |
| 25 to 34 Years | 57 (20.0%) | 219 (76.8%) |
| 35 to 44 Years | 29 (7.6%) | 322 (84.1%) |
| 45 to 54 Years | 35 (5.4%) | 632 (97.4%) |
| 55 to 64 Years | 79 (16.1%) | 443 (90.4%) |
| 65 to 74 Years | 325 (86.7%) | 283 (75.5%) |
| 75 Years and over | 255 (100.0%) | 143 (56.1%) |
| Total | 1,011 (27.8%) | 3,015 (82.9%) |
Disability Status by Sex by Age in Bunk Foss
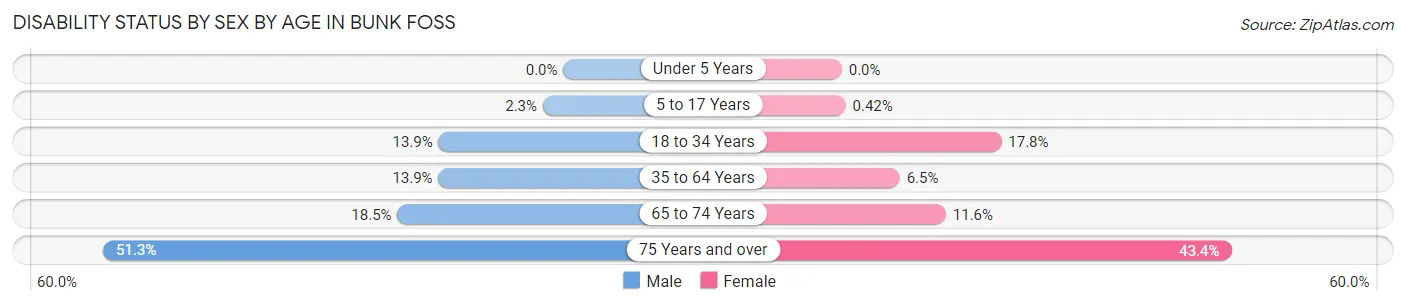
| Age Bracket | Male | Female |
| Under 5 Years | 0 (0.0%) | 0 (0.0%) |
| 5 to 17 Years | 9 (2.3%) | 1 (0.4%) |
| 18 to 34 Years | 46 (13.9%) | 67 (17.8%) |
| 35 to 64 Years | 106 (13.9%) | 49 (6.5%) |
| 65 to 74 Years | 39 (18.5%) | 19 (11.6%) |
| 75 Years and over | 61 (51.3%) | 59 (43.4%) |
Disability Class by Sex by Age in Bunk Foss
Disability Class: Hearing Difficulty
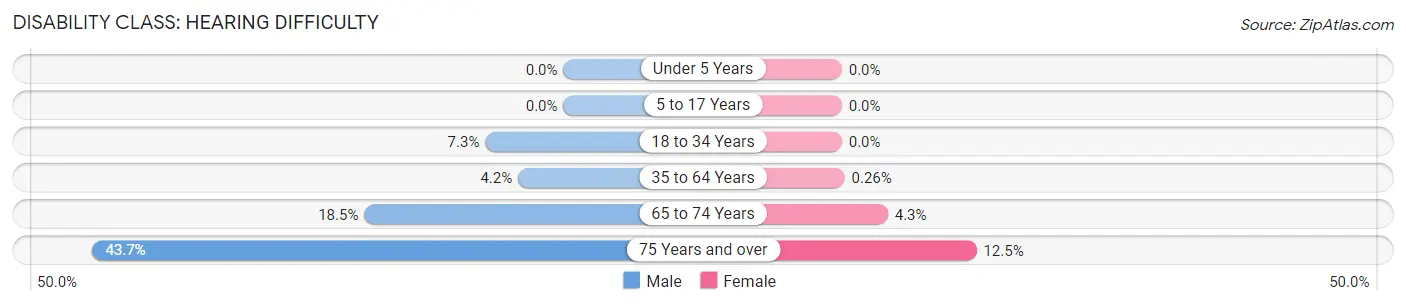
| Age Bracket | Male | Female |
| Under 5 Years | 0 (0.0%) | 0 (0.0%) |
| 5 to 17 Years | 0 (0.0%) | 0 (0.0%) |
| 18 to 34 Years | 24 (7.2%) | 0 (0.0%) |
| 35 to 64 Years | 32 (4.2%) | 2 (0.3%) |
| 65 to 74 Years | 39 (18.5%) | 7 (4.3%) |
| 75 Years and over | 52 (43.7%) | 17 (12.5%) |
Disability Class: Vision Difficulty
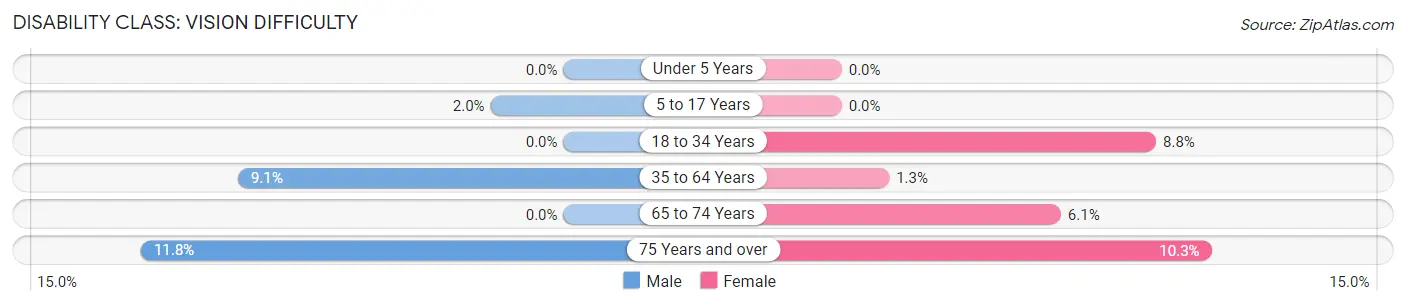
| Age Bracket | Male | Female |
| Under 5 Years | 0 (0.0%) | 0 (0.0%) |
| 5 to 17 Years | 8 (2.0%) | 0 (0.0%) |
| 18 to 34 Years | 0 (0.0%) | 33 (8.7%) |
| 35 to 64 Years | 69 (9.1%) | 10 (1.3%) |
| 65 to 74 Years | 0 (0.0%) | 10 (6.1%) |
| 75 Years and over | 14 (11.8%) | 14 (10.3%) |
Disability Class: Cognitive Difficulty
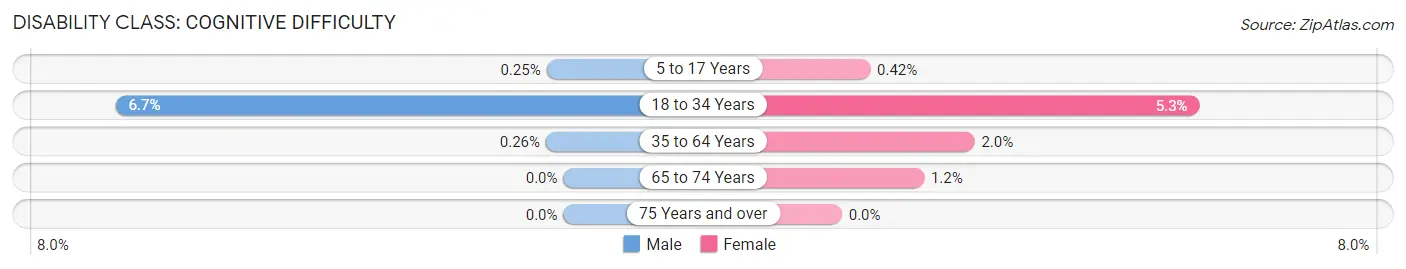
| Age Bracket | Male | Female |
| 5 to 17 Years | 1 (0.3%) | 1 (0.4%) |
| 18 to 34 Years | 22 (6.7%) | 20 (5.3%) |
| 35 to 64 Years | 2 (0.3%) | 15 (2.0%) |
| 65 to 74 Years | 0 (0.0%) | 2 (1.2%) |
| 75 Years and over | 0 (0.0%) | 0 (0.0%) |
Disability Class: Ambulatory Difficulty
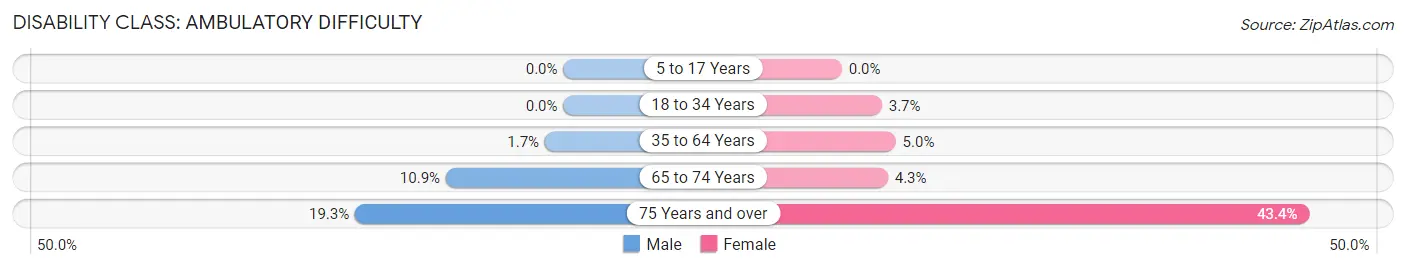
| Age Bracket | Male | Female |
| 5 to 17 Years | 0 (0.0%) | 0 (0.0%) |
| 18 to 34 Years | 0 (0.0%) | 14 (3.7%) |
| 35 to 64 Years | 13 (1.7%) | 38 (5.0%) |
| 65 to 74 Years | 23 (10.9%) | 7 (4.3%) |
| 75 Years and over | 23 (19.3%) | 59 (43.4%) |
Disability Class: Self-Care Difficulty
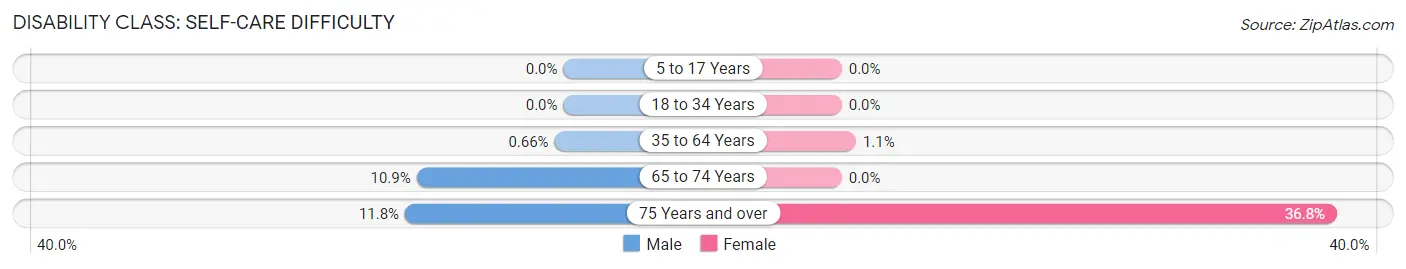
| Age Bracket | Male | Female |
| 5 to 17 Years | 0 (0.0%) | 0 (0.0%) |
| 18 to 34 Years | 0 (0.0%) | 0 (0.0%) |
| 35 to 64 Years | 5 (0.7%) | 8 (1.1%) |
| 65 to 74 Years | 23 (10.9%) | 0 (0.0%) |
| 75 Years and over | 14 (11.8%) | 50 (36.8%) |
Technology Access in Bunk Foss
Computing Device Access in Bunk Foss
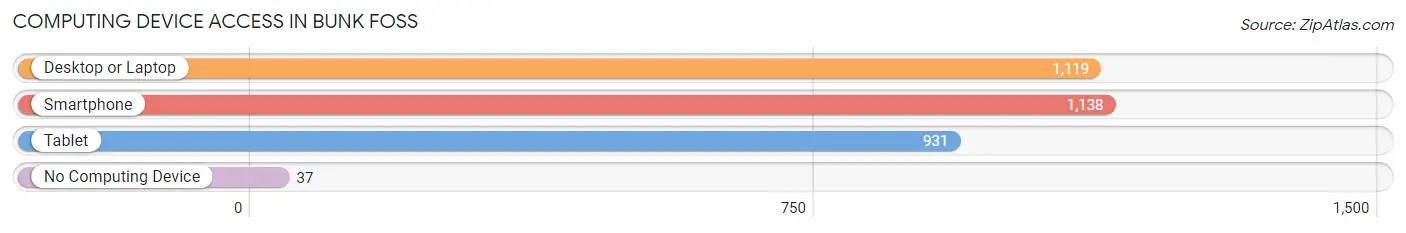
| Device Type | # Households | % Households |
| Desktop or Laptop | 1,119 | 92.4% |
| Smartphone | 1,138 | 94.0% |
| Tablet | 931 | 76.9% |
| No Computing Device | 37 | 3.1% |
| Total | 1,211 | 100.0% |
Internet Access in Bunk Foss
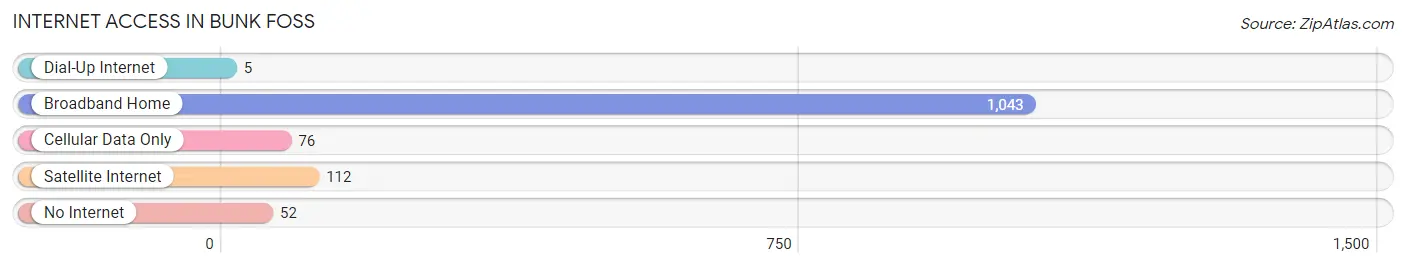
| Internet Type | # Households | % Households |
| Dial-Up Internet | 5 | 0.4% |
| Broadband Home | 1,043 | 86.1% |
| Cellular Data Only | 76 | 6.3% |
| Satellite Internet | 112 | 9.2% |
| No Internet | 52 | 4.3% |
| Total | 1,211 | 100.0% |
Bunk Foss Summary
Bunk Foss is a small town located in the state of Washington, United States. It is situated in the county of Lewis, and is part of the Centralia-Chehalis Metropolitan Statistical Area. The town has a population of approximately 1,000 people, and is located in the foothills of the Cascade Mountains.
History
The town of Bunk Foss was founded in 1883 by a group of settlers from the Midwest. The settlers were looking for a place to settle and start a new life, and they chose the area around Bunk Foss due to its abundance of natural resources. The town was named after a local Native American chief, Chief Bunk Foss. The settlers built a sawmill and a gristmill, and the town quickly grew. By the early 1900s, Bunk Foss had become a thriving community with a population of over 500 people.
The town was a major logging center in the early 20th century, and the lumber industry was the main source of income for the town. The town also had a thriving agricultural industry, and the local farmers grew a variety of crops, including wheat, oats, and potatoes.
Geography
Bunk Foss is located in the foothills of the Cascade Mountains, and is surrounded by lush forests and rolling hills. The town is situated at an elevation of 1,000 feet, and is located about 25 miles east of the city of Centralia. The town is located in a temperate climate, and the average temperature in the summer is around 70 degrees Fahrenheit. The town receives an average of 40 inches of rain per year, and the average snowfall is around 20 inches.
Economy
The economy of Bunk Foss is largely based on the lumber industry. The town is home to several sawmills and lumber companies, and the lumber industry is the main source of employment for the town. The town also has a thriving agricultural industry, and the local farmers grow a variety of crops, including wheat, oats, and potatoes.
The town also has a few small businesses, including a grocery store, a hardware store, and a few restaurants. The town also has a few small manufacturing companies, and the town is home to a few small technology companies.
Demographics
As of the 2010 census, the population of Bunk Foss was 1,000 people. The town is predominantly white, with about 95% of the population being white. The town also has a small Hispanic population, with about 4% of the population being Hispanic. The town also has a small African American population, with about 1% of the population being African American. The median household income in Bunk Foss is around $45,000, and the median home value is around $150,000.
Common Questions
What is Per Capita Income in Bunk Foss?
Per Capita income in Bunk Foss is $48,061.
What is the Median Family Income in Bunk Foss?
Median Family Income in Bunk Foss is $142,778.
What is the Median Household income in Bunk Foss?
Median Household Income in Bunk Foss is $145,647.
What is Income or Wage Gap in Bunk Foss?
Income or Wage Gap in Bunk Foss is 46.4%.
Women in Bunk Foss earn 53.6 cents for every dollar earned by a man.
What is Inequality or Gini Index in Bunk Foss?
Inequality or Gini Index in Bunk Foss is 0.30.
What is the Total Population of Bunk Foss?
Total Population of Bunk Foss is 3,639.
What is the Total Male Population of Bunk Foss?
Total Male Population of Bunk Foss is 1,853.
What is the Total Female Population of Bunk Foss?
Total Female Population of Bunk Foss is 1,786.
What is the Ratio of Males per 100 Females in Bunk Foss?
There are 103.75 Males per 100 Females in Bunk Foss.
What is the Ratio of Females per 100 Males in Bunk Foss?
There are 96.38 Females per 100 Males in Bunk Foss.
What is the Median Population Age in Bunk Foss?
Median Population Age in Bunk Foss is 44.5 Years.
What is the Average Family Size in Bunk Foss
Average Family Size in Bunk Foss is 3.2 People.
What is the Average Household Size in Bunk Foss
Average Household Size in Bunk Foss is 3.0 People.
How Large is the Labor Force in Bunk Foss?
There are 1,893 People in the Labor Forcein in Bunk Foss.
What is the Percentage of People in the Labor Force in Bunk Foss?
63.9% of People are in the Labor Force in Bunk Foss.
What is the Unemployment Rate in Bunk Foss?
Unemployment Rate in Bunk Foss is 6.2%.