Snoqualmie Pass, WA Map & Demographics
Snoqualmie Pass Map
Snoqualmie Pass Overview
$62,398
PER CAPITA INCOME
$176,806
AVG FAMILY INCOME
$80,875
AVG HOUSEHOLD INCOME
0.42
INEQUALITY / GINI INDEX
420
TOTAL POPULATION
232
MALE POPULATION
188
FEMALE POPULATION
123.40
MALES / 100 FEMALES
81.03
FEMALES / 100 MALES
50.7
MEDIAN AGE
3.0
AVG FAMILY SIZE
2.1
AVG HOUSEHOLD SIZE
230
LABOR FORCE [ PEOPLE ]
64.1%
PERCENT IN LABOR FORCE
3.9%
UNEMPLOYMENT RATE
Snoqualmie Pass Zip Codes
Snoqualmie Pass Area Codes
Income in Snoqualmie Pass
Income Overview in Snoqualmie Pass
Per Capita Income in Snoqualmie Pass is $62,398, while median incomes of families and households are $176,806 and $80,875 respectively.
| Characteristic | Number | Measure |
| Per Capita Income | 420 | $62,398 |
| Median Family Income | 105 | $176,806 |
| Mean Family Income | 105 | $187,472 |
| Median Household Income | 189 | $80,875 |
| Mean Household Income | 189 | $130,350 |
| Income Deficit | 105 | $0 |
| Wage / Income Gap (%) | 420 | 0.00% |
| Wage / Income Gap ($) | 420 | 100.00¢ per $1 |
| Gini / Inequality Index | 420 | 0.42 |
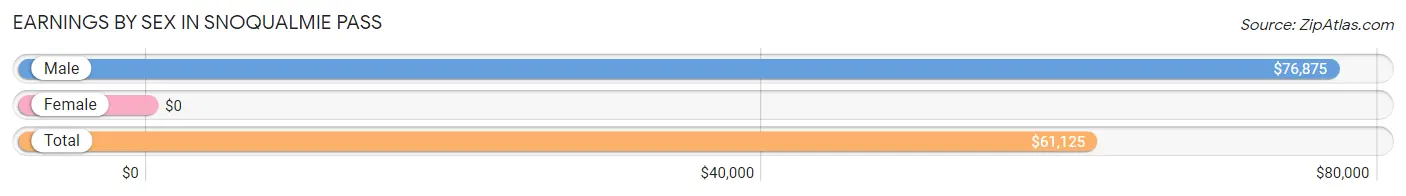
Earnings by Sex in Snoqualmie Pass
| Sex | Number | Average Earnings |
| Male | 176 (71.3%) | $76,875 |
| Female | 71 (28.7%) | $0 |
| Total | 247 (100.0%) | $61,125 |
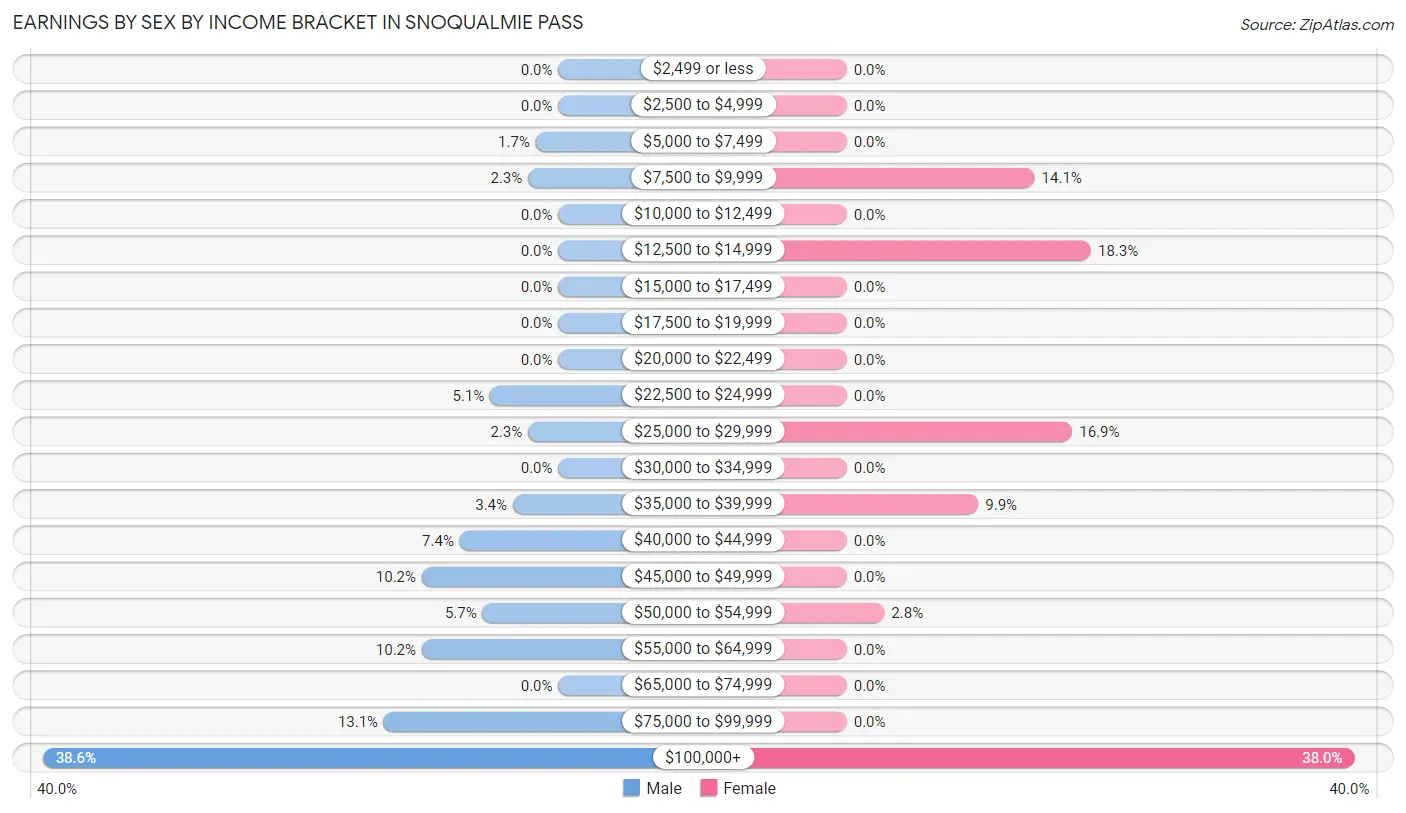
Earnings by Sex by Income Bracket in Snoqualmie Pass
The most common earnings brackets in Snoqualmie Pass are $100,000+ for men (68 | 38.6%) and $100,000+ for women (27 | 38.0%).
| Income | Male | Female |
| $2,499 or less | 0 (0.0%) | 0 (0.0%) |
| $2,500 to $4,999 | 0 (0.0%) | 0 (0.0%) |
| $5,000 to $7,499 | 3 (1.7%) | 0 (0.0%) |
| $7,500 to $9,999 | 4 (2.3%) | 10 (14.1%) |
| $10,000 to $12,499 | 0 (0.0%) | 0 (0.0%) |
| $12,500 to $14,999 | 0 (0.0%) | 13 (18.3%) |
| $15,000 to $17,499 | 0 (0.0%) | 0 (0.0%) |
| $17,500 to $19,999 | 0 (0.0%) | 0 (0.0%) |
| $20,000 to $22,499 | 0 (0.0%) | 0 (0.0%) |
| $22,500 to $24,999 | 9 (5.1%) | 0 (0.0%) |
| $25,000 to $29,999 | 4 (2.3%) | 12 (16.9%) |
| $30,000 to $34,999 | 0 (0.0%) | 0 (0.0%) |
| $35,000 to $39,999 | 6 (3.4%) | 7 (9.9%) |
| $40,000 to $44,999 | 13 (7.4%) | 0 (0.0%) |
| $45,000 to $49,999 | 18 (10.2%) | 0 (0.0%) |
| $50,000 to $54,999 | 10 (5.7%) | 2 (2.8%) |
| $55,000 to $64,999 | 18 (10.2%) | 0 (0.0%) |
| $65,000 to $74,999 | 0 (0.0%) | 0 (0.0%) |
| $75,000 to $99,999 | 23 (13.1%) | 0 (0.0%) |
| $100,000+ | 68 (38.6%) | 27 (38.0%) |
| Total | 176 (100.0%) | 71 (100.0%) |
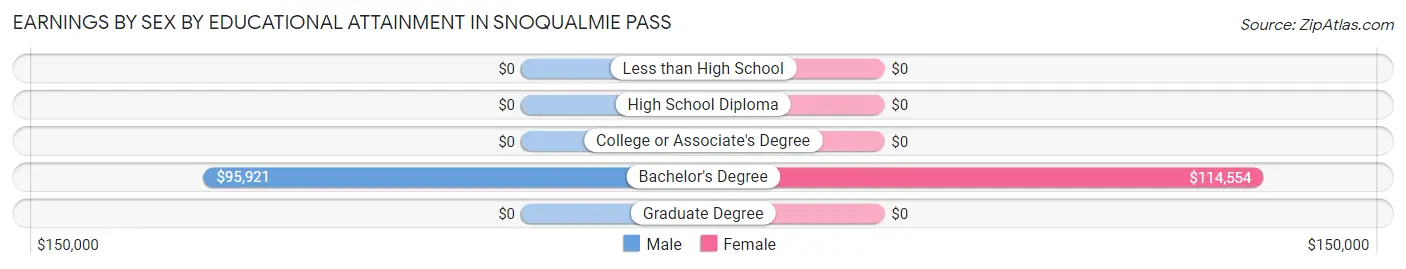
Earnings by Sex by Educational Attainment in Snoqualmie Pass
| Educational Attainment | Male Income | Female Income |
| Less than High School | - | - |
| High School Diploma | - | - |
| College or Associate's Degree | - | - |
| Bachelor's Degree | $95,921 | $114,554 |
| Graduate Degree | - | - |
| Total | $76,875 | $0 |
Family Income in Snoqualmie Pass
Family Income Brackets in Snoqualmie Pass
According to the Snoqualmie Pass family income data, there are 50 families falling into the $200,000+ income range, which is the most common income bracket and makes up 47.6% of all families.
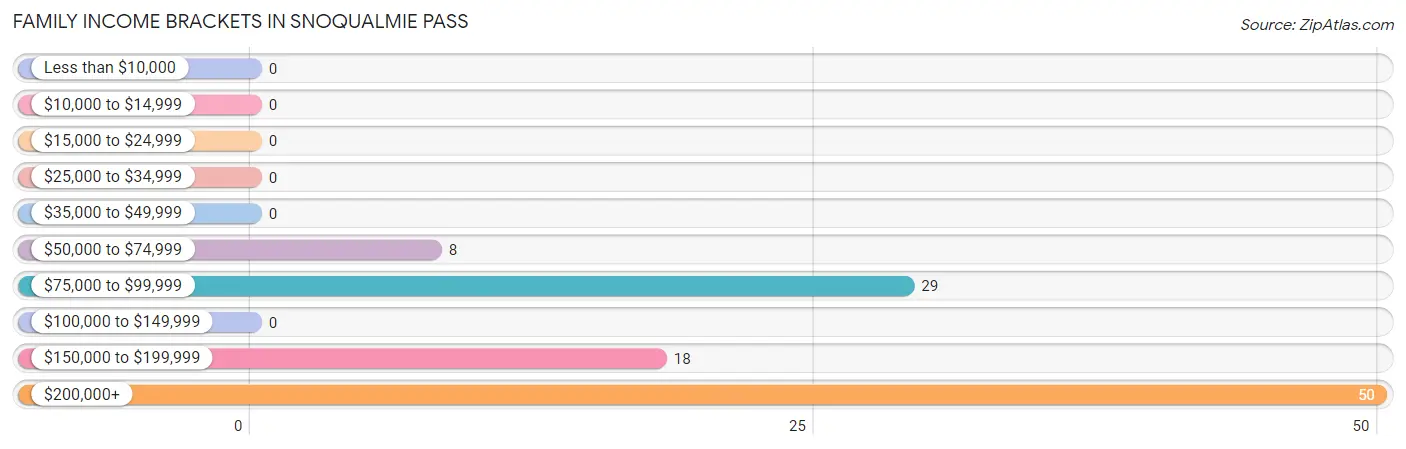
| Income Bracket | # Families | % Families |
| Less than $10,000 | 0 | 0.0% |
| $10,000 to $14,999 | 0 | 0.0% |
| $15,000 to $24,999 | 0 | 0.0% |
| $25,000 to $34,999 | 0 | 0.0% |
| $35,000 to $49,999 | 0 | 0.0% |
| $50,000 to $74,999 | 8 | 7.6% |
| $75,000 to $99,999 | 29 | 27.6% |
| $100,000 to $149,999 | 0 | 0.0% |
| $150,000 to $199,999 | 18 | 17.1% |
| $200,000+ | 50 | 47.6% |
Family Income by Famaliy Size in Snoqualmie Pass
3-person families (35 | 33.3%) account for the highest median family income in Snoqualmie Pass with $213,068 per family, while 3-person families (35 | 33.3%) have the highest median income of $71,023 per family member.
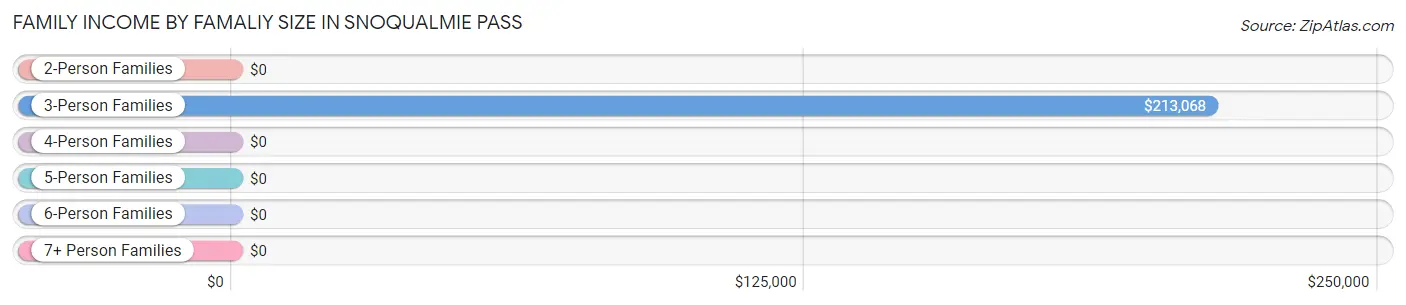
| Income Bracket | # Families | Median Income |
| 2-Person Families | 38 (36.2%) | $0 |
| 3-Person Families | 35 (33.3%) | $213,068 |
| 4-Person Families | 19 (18.1%) | $0 |
| 5-Person Families | 13 (12.4%) | $0 |
| 6-Person Families | 0 (0.0%) | $0 |
| 7+ Person Families | 0 (0.0%) | $0 |
| Total | 105 (100.0%) | $176,806 |
Family Income by Number of Earners in Snoqualmie Pass
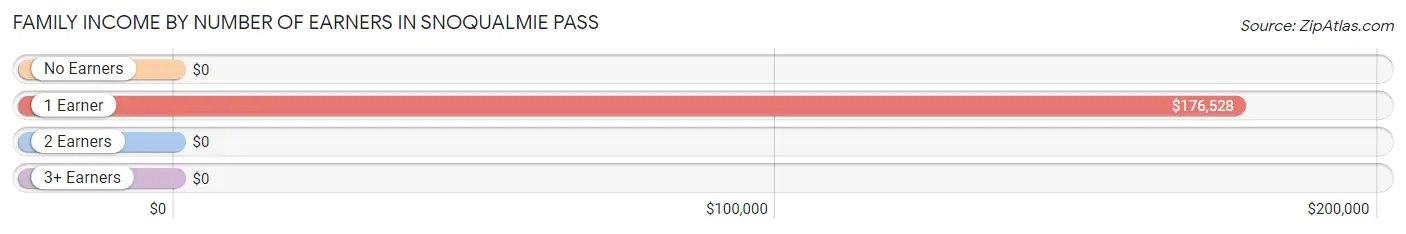
| Number of Earners | # Families | Median Income |
| No Earners | 0 (0.0%) | $0 |
| 1 Earner | 45 (42.9%) | $176,528 |
| 2 Earners | 60 (57.1%) | $0 |
| 3+ Earners | 0 (0.0%) | $0 |
| Total | 105 (100.0%) | $176,806 |
Household Income in Snoqualmie Pass
Household Income Brackets in Snoqualmie Pass
With 50 households falling in the category, the $200,000+ income range is the most frequent in Snoqualmie Pass, accounting for 26.5% of all households.
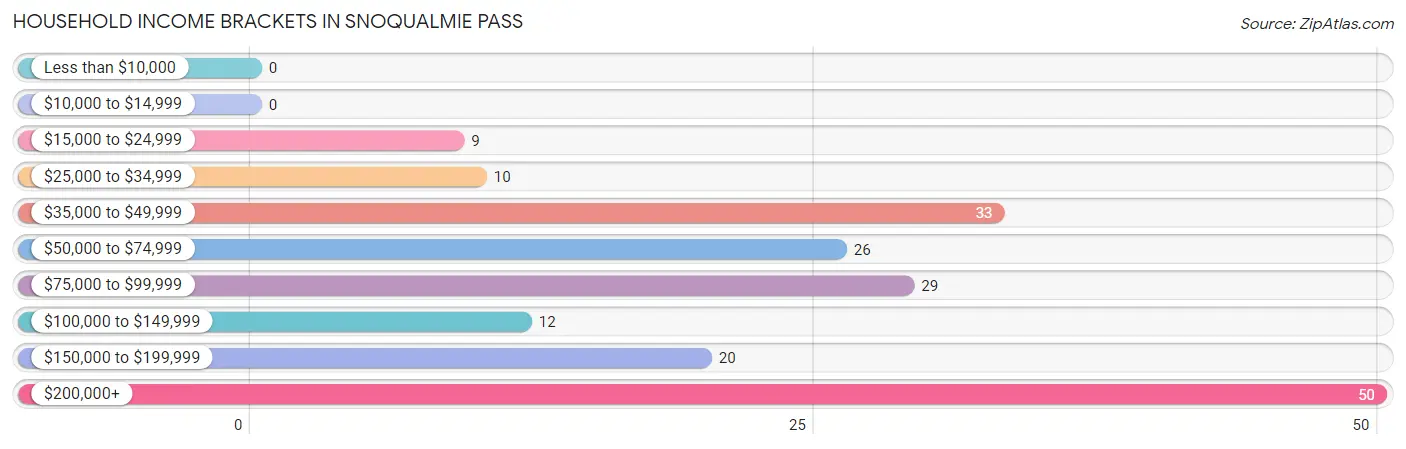
| Income Bracket | # Households | % Households |
| Less than $10,000 | 0 | 0.0% |
| $10,000 to $14,999 | 0 | 0.0% |
| $15,000 to $24,999 | 9 | 4.8% |
| $25,000 to $34,999 | 10 | 5.3% |
| $35,000 to $49,999 | 33 | 17.5% |
| $50,000 to $74,999 | 26 | 13.8% |
| $75,000 to $99,999 | 29 | 15.3% |
| $100,000 to $149,999 | 12 | 6.3% |
| $150,000 to $199,999 | 20 | 10.6% |
| $200,000+ | 50 | 26.5% |
Household Income by Householder Age in Snoqualmie Pass
The median household income in Snoqualmie Pass is $80,875, with the highest median household income of $214,545 found in the 45 to 64 years age bracket for the primary householder. A total of 82 households (43.4%) fall into this category.
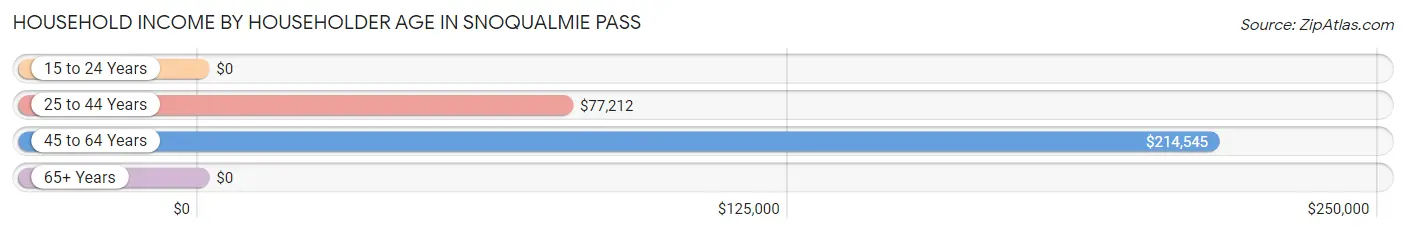
| Income Bracket | # Households | Median Income |
| 15 to 24 Years | 0 (0.0%) | $0 |
| 25 to 44 Years | 59 (31.2%) | $77,212 |
| 45 to 64 Years | 82 (43.4%) | $214,545 |
| 65+ Years | 48 (25.4%) | $0 |
| Total | 189 (100.0%) | $80,875 |
Poverty in Snoqualmie Pass
Income Below Poverty by Sex and Age in Snoqualmie Pass
With 5.6% poverty level for males and 1.1% for females among the residents of Snoqualmie Pass, 35 to 44 year old males and 45 to 54 year old females are the most vulnerable to poverty, with 7 males (26.9%) and 2 females (5.9%) in their respective age groups living below the poverty level.
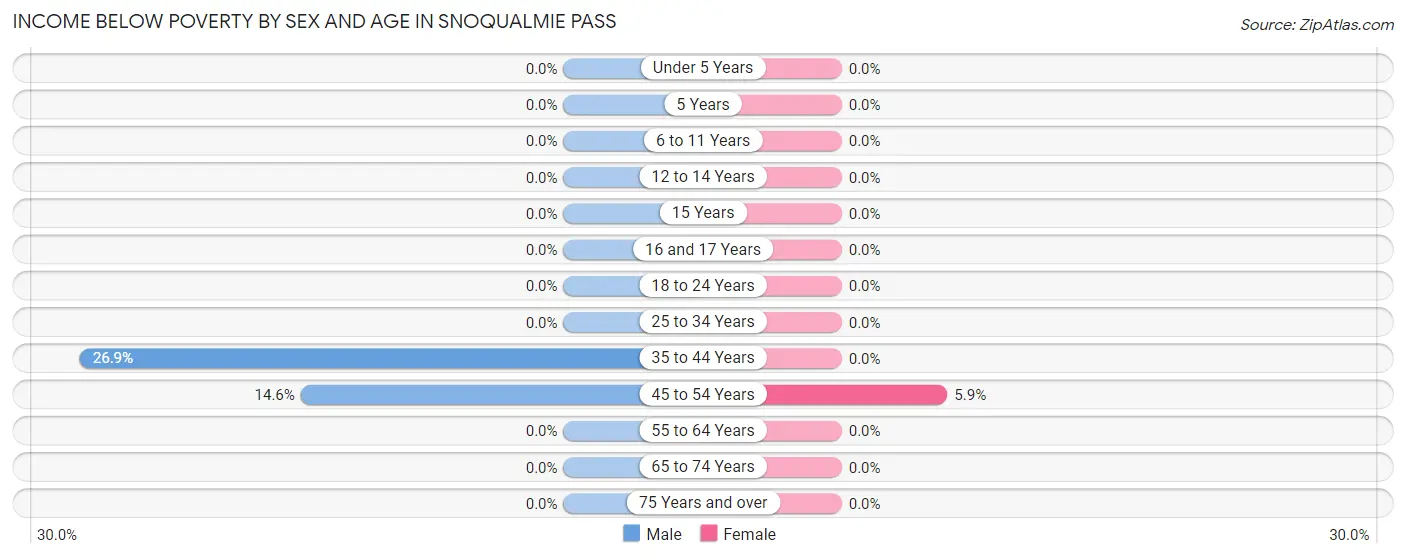
| Age Bracket | Male | Female |
| Under 5 Years | 0 (0.0%) | 0 (0.0%) |
| 5 Years | 0 (0.0%) | 0 (0.0%) |
| 6 to 11 Years | 0 (0.0%) | 0 (0.0%) |
| 12 to 14 Years | 0 (0.0%) | 0 (0.0%) |
| 15 Years | 0 (0.0%) | 0 (0.0%) |
| 16 and 17 Years | 0 (0.0%) | 0 (0.0%) |
| 18 to 24 Years | 0 (0.0%) | 0 (0.0%) |
| 25 to 34 Years | 0 (0.0%) | 0 (0.0%) |
| 35 to 44 Years | 7 (26.9%) | 0 (0.0%) |
| 45 to 54 Years | 6 (14.6%) | 2 (5.9%) |
| 55 to 64 Years | 0 (0.0%) | 0 (0.0%) |
| 65 to 74 Years | 0 (0.0%) | 0 (0.0%) |
| 75 Years and over | 0 (0.0%) | 0 (0.0%) |
| Total | 13 (5.6%) | 2 (1.1%) |
Income Above Poverty by Sex and Age in Snoqualmie Pass
According to the poverty statistics in Snoqualmie Pass, males aged under 5 years and females aged under 5 years are the age groups that are most secure financially, with 100.0% of males and 100.0% of females in these age groups living above the poverty line.
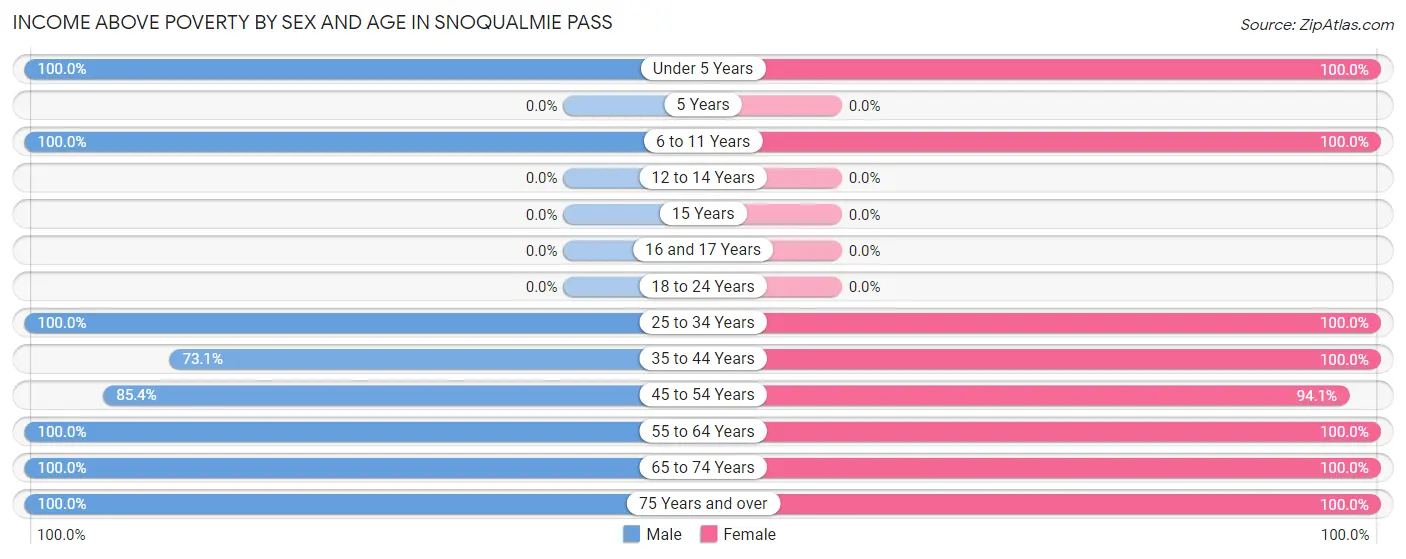
| Age Bracket | Male | Female |
| Under 5 Years | 7 (100.0%) | 12 (100.0%) |
| 5 Years | 0 (0.0%) | 0 (0.0%) |
| 6 to 11 Years | 11 (100.0%) | 31 (100.0%) |
| 12 to 14 Years | 0 (0.0%) | 0 (0.0%) |
| 15 Years | 0 (0.0%) | 0 (0.0%) |
| 16 and 17 Years | 0 (0.0%) | 0 (0.0%) |
| 18 to 24 Years | 0 (0.0%) | 0 (0.0%) |
| 25 to 34 Years | 31 (100.0%) | 14 (100.0%) |
| 35 to 44 Years | 19 (73.1%) | 13 (100.0%) |
| 45 to 54 Years | 35 (85.4%) | 32 (94.1%) |
| 55 to 64 Years | 74 (100.0%) | 44 (100.0%) |
| 65 to 74 Years | 29 (100.0%) | 21 (100.0%) |
| 75 Years and over | 13 (100.0%) | 19 (100.0%) |
| Total | 219 (94.4%) | 186 (98.9%) |
Income Below Poverty Among Married-Couple Families in Snoqualmie Pass
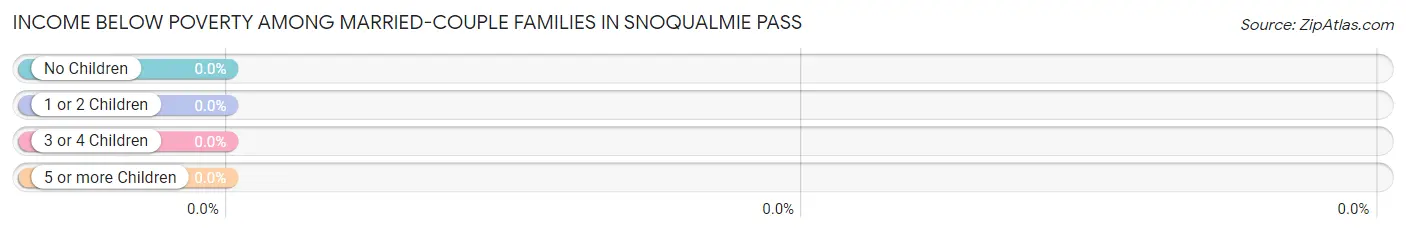
| Children | Above Poverty | Below Poverty |
| No Children | 78 (100.0%) | 0 (0.0%) |
| 1 or 2 Children | 14 (100.0%) | 0 (0.0%) |
| 3 or 4 Children | 13 (100.0%) | 0 (0.0%) |
| 5 or more Children | 0 (0.0%) | 0 (0.0%) |
| Total | 105 (100.0%) | 0 (0.0%) |
Income Below Poverty Among Single-Parent Households in Snoqualmie Pass
| Children | Single Father | Single Mother |
| No Children | 0 (0.0%) | 0 (0.0%) |
| 1 or 2 Children | 0 (0.0%) | 0 (0.0%) |
| 3 or 4 Children | 0 (0.0%) | 0 (0.0%) |
| 5 or more Children | 0 (0.0%) | 0 (0.0%) |
| Total | 0 (0.0%) | 0 (0.0%) |
Income Below Poverty Among Married-Couple vs Single-Parent Households in Snoqualmie Pass
| Children | Married-Couple Families | Single-Parent Households |
| No Children | 0 (0.0%) | 0 (0.0%) |
| 1 or 2 Children | 0 (0.0%) | 0 (0.0%) |
| 3 or 4 Children | 0 (0.0%) | 0 (0.0%) |
| 5 or more Children | 0 (0.0%) | 0 (0.0%) |
| Total | 0 (0.0%) | 0 (0.0%) |
Race in Snoqualmie Pass
The most populous races in Snoqualmie Pass are White / Caucasian (403 | 96.0%), Some other Race (12 | 2.9%), and Hispanic or Latino (9 | 2.1%).
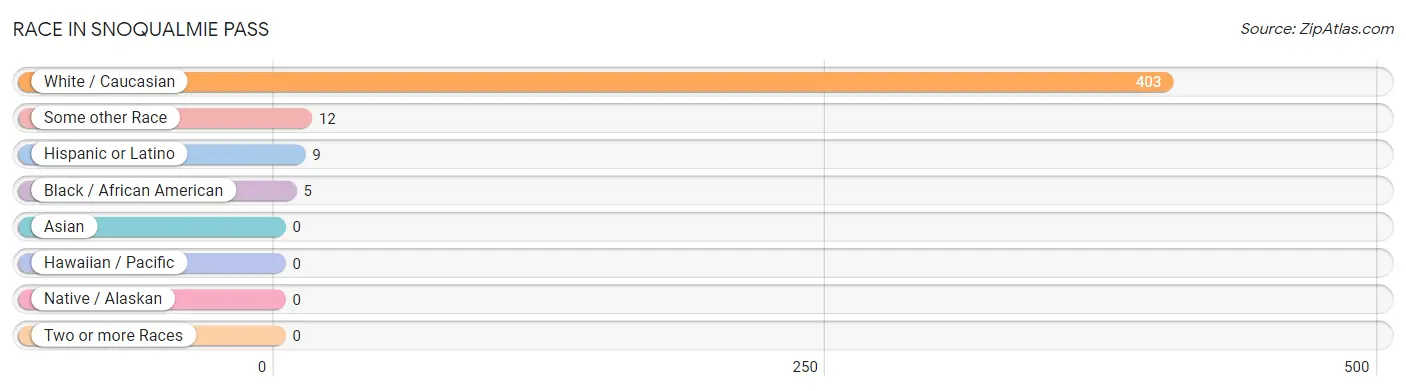
| Race | # Population | % Population |
| Asian | 0 | 0.0% |
| Black / African American | 5 | 1.2% |
| Hawaiian / Pacific | 0 | 0.0% |
| Hispanic or Latino | 9 | 2.1% |
| Native / Alaskan | 0 | 0.0% |
| White / Caucasian | 403 | 96.0% |
| Two or more Races | 0 | 0.0% |
| Some other Race | 12 | 2.9% |
| Total | 420 | 100.0% |
Ancestry in Snoqualmie Pass
The most populous ancestries reported in Snoqualmie Pass are Irish (107 | 25.5%), German (74 | 17.6%), English (47 | 11.2%), Scandinavian (45 | 10.7%), and American (36 | 8.6%), together accounting for 73.6% of all Snoqualmie Pass residents.
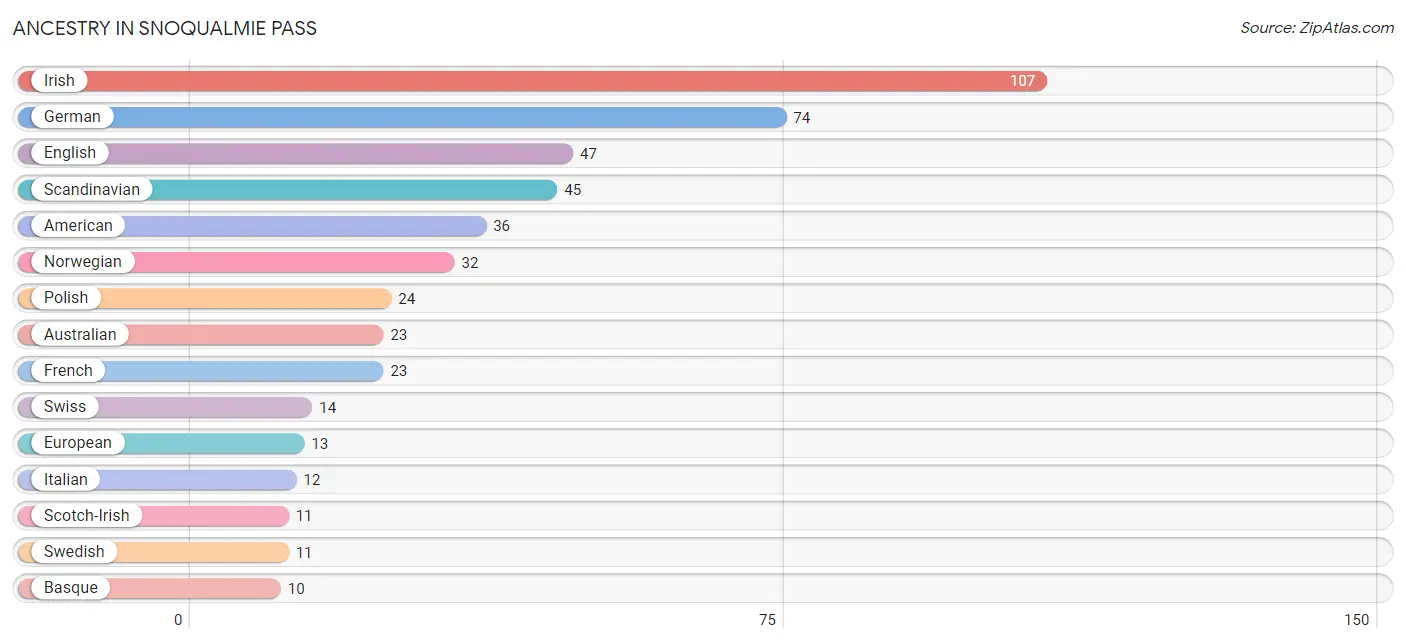
| Ancestry | # Population | % Population |
| American | 36 | 8.6% |
| Australian | 23 | 5.5% |
| Basque | 10 | 2.4% |
| British | 2 | 0.5% |
| Canadian | 8 | 1.9% |
| Czech | 9 | 2.1% |
| English | 47 | 11.2% |
| European | 13 | 3.1% |
| French | 23 | 5.5% |
| French Canadian | 9 | 2.1% |
| German | 74 | 17.6% |
| Irish | 107 | 25.5% |
| Italian | 12 | 2.9% |
| Mexican | 7 | 1.7% |
| Norwegian | 32 | 7.6% |
| Peruvian | 2 | 0.5% |
| Polish | 24 | 5.7% |
| Russian | 3 | 0.7% |
| Scandinavian | 45 | 10.7% |
| Scotch-Irish | 11 | 2.6% |
| Somali | 3 | 0.7% |
| South American | 2 | 0.5% |
| Subsaharan African | 3 | 0.7% |
| Swedish | 11 | 2.6% |
| Swiss | 14 | 3.3% |
| Welsh | 10 | 2.4% |
| Yugoslavian | 2 | 0.5% | View All 27 Rows |
Immigrants in Snoqualmie Pass
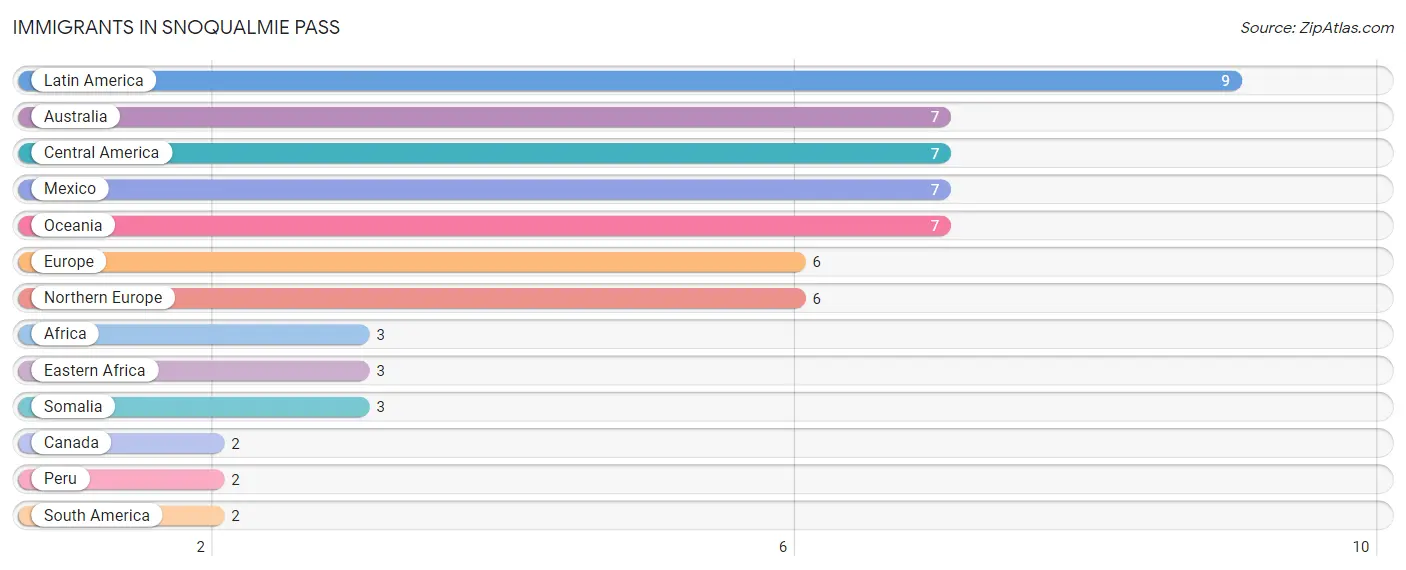
The most numerous immigrant groups reported in Snoqualmie Pass came from Latin America (9 | 2.1%), Australia (7 | 1.7%), Central America (7 | 1.7%), Mexico (7 | 1.7%), and Oceania (7 | 1.7%), together accounting for 8.8% of all Snoqualmie Pass residents.
| Immigration Origin | # Population | % Population |
| Africa | 3 | 0.7% |
| Australia | 7 | 1.7% |
| Canada | 2 | 0.5% |
| Central America | 7 | 1.7% |
| Eastern Africa | 3 | 0.7% |
| Europe | 6 | 1.4% |
| Latin America | 9 | 2.1% |
| Mexico | 7 | 1.7% |
| Northern Europe | 6 | 1.4% |
| Oceania | 7 | 1.7% |
| Peru | 2 | 0.5% |
| Somalia | 3 | 0.7% |
| South America | 2 | 0.5% | View All 13 Rows |
Sex and Age in Snoqualmie Pass
Sex and Age in Snoqualmie Pass
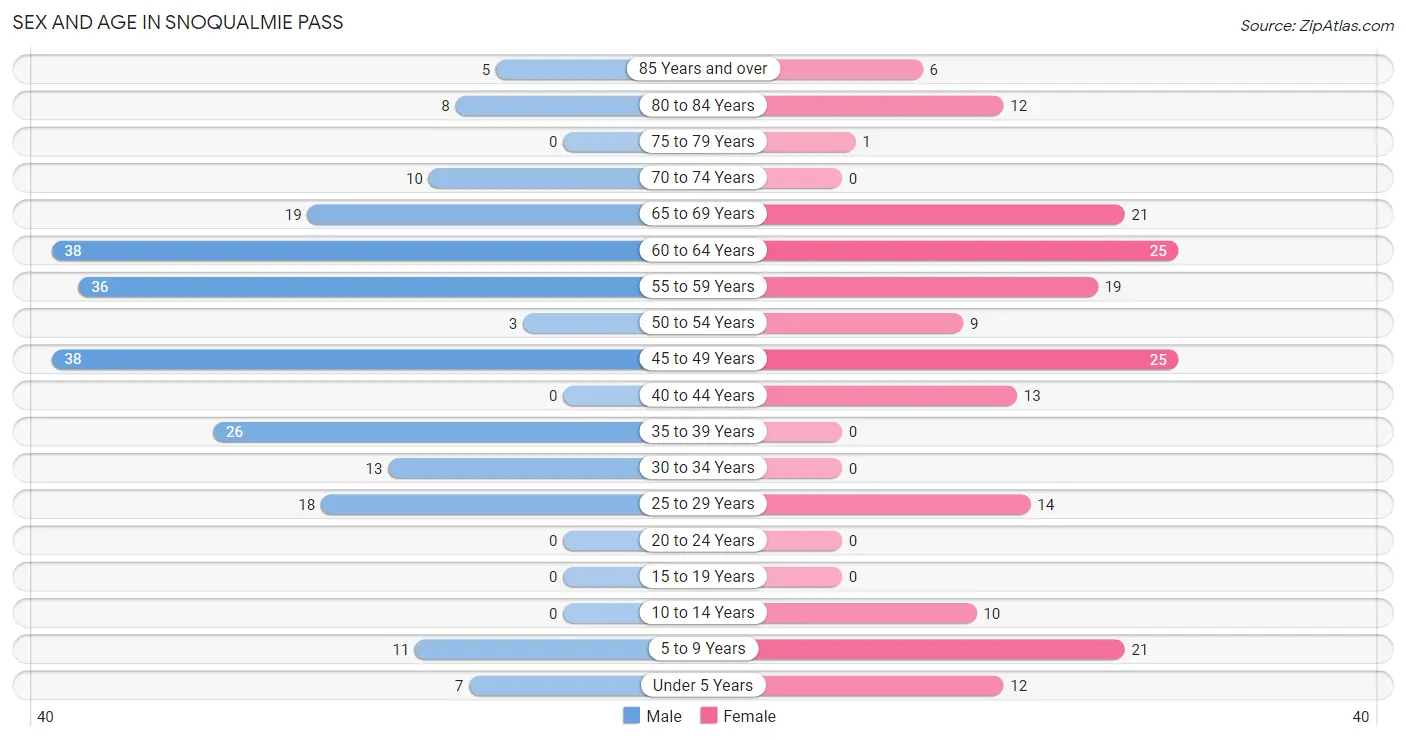
The most populous age groups in Snoqualmie Pass are 45 to 49 Years (38 | 16.4%) for men and 45 to 49 Years (25 | 13.3%) for women.
| Age Bracket | Male | Female |
| Under 5 Years | 7 (3.0%) | 12 (6.4%) |
| 5 to 9 Years | 11 (4.7%) | 21 (11.2%) |
| 10 to 14 Years | 0 (0.0%) | 10 (5.3%) |
| 15 to 19 Years | 0 (0.0%) | 0 (0.0%) |
| 20 to 24 Years | 0 (0.0%) | 0 (0.0%) |
| 25 to 29 Years | 18 (7.8%) | 14 (7.4%) |
| 30 to 34 Years | 13 (5.6%) | 0 (0.0%) |
| 35 to 39 Years | 26 (11.2%) | 0 (0.0%) |
| 40 to 44 Years | 0 (0.0%) | 13 (6.9%) |
| 45 to 49 Years | 38 (16.4%) | 25 (13.3%) |
| 50 to 54 Years | 3 (1.3%) | 9 (4.8%) |
| 55 to 59 Years | 36 (15.5%) | 19 (10.1%) |
| 60 to 64 Years | 38 (16.4%) | 25 (13.3%) |
| 65 to 69 Years | 19 (8.2%) | 21 (11.2%) |
| 70 to 74 Years | 10 (4.3%) | 0 (0.0%) |
| 75 to 79 Years | 0 (0.0%) | 1 (0.5%) |
| 80 to 84 Years | 8 (3.5%) | 12 (6.4%) |
| 85 Years and over | 5 (2.2%) | 6 (3.2%) |
| Total | 232 (100.0%) | 188 (100.0%) |
Families and Households in Snoqualmie Pass
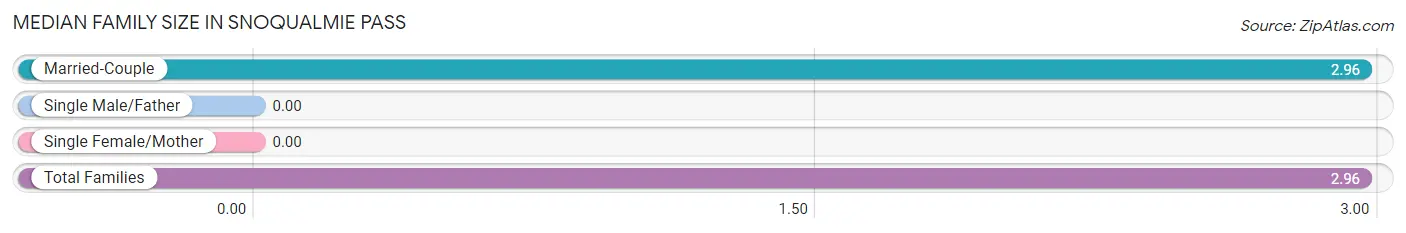
Median Family Size in Snoqualmie Pass
| Family Type | # Families | Family Size |
| Married-Couple | 105 (100.0%) | 2.96 |
| Single Male/Father | 0 (0.0%) | - |
| Single Female/Mother | 0 (0.0%) | - |
| Total Families | 105 (100.0%) | 2.96 |
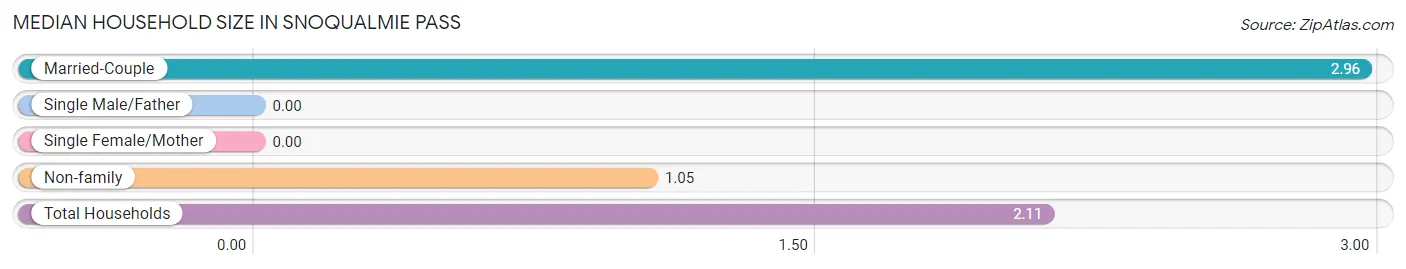
Median Household Size in Snoqualmie Pass
| Household Type | # Households | Household Size |
| Married-Couple | 105 (55.6%) | 2.96 |
| Single Male/Father | 0 (0.0%) | - |
| Single Female/Mother | 0 (0.0%) | - |
| Non-family | 84 (44.4%) | 1.05 |
| Total Households | 189 (100.0%) | 2.11 |
Household Size by Marriage Status in Snoqualmie Pass
Out of a total of 189 households in Snoqualmie Pass, 105 (55.6%) are family households, while 84 (44.4%) are nonfamily households. The most numerous type of family households are 2-person households, comprising 38, and the most common type of nonfamily households are 1-person households, comprising 82.
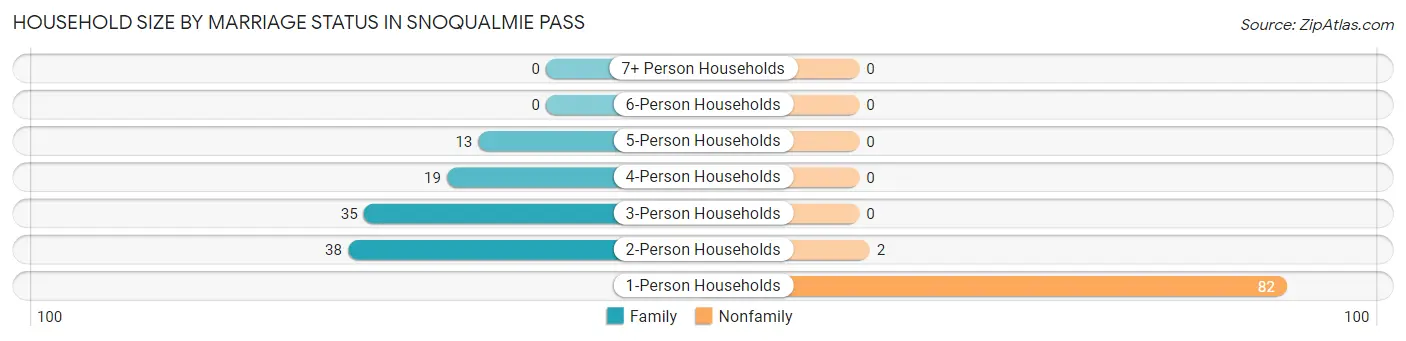
| Household Size | Family Households | Nonfamily Households |
| 1-Person Households | - | 82 (43.4%) |
| 2-Person Households | 38 (20.1%) | 2 (1.1%) |
| 3-Person Households | 35 (18.5%) | 0 (0.0%) |
| 4-Person Households | 19 (10.1%) | 0 (0.0%) |
| 5-Person Households | 13 (6.9%) | 0 (0.0%) |
| 6-Person Households | 0 (0.0%) | 0 (0.0%) |
| 7+ Person Households | 0 (0.0%) | 0 (0.0%) |
| Total | 105 (55.6%) | 84 (44.4%) |
Female Fertility in Snoqualmie Pass
Fertility by Age in Snoqualmie Pass
| Age Bracket | Women with Births | Births / 1,000 Women |
| 15 to 19 years | 0 (0.0%) | 0.0 |
| 20 to 34 years | 0 (0.0%) | 0.0 |
| 35 to 50 years | 0 (0.0%) | 0.0 |
| Total | 0 (0.0%) | 0.0 |
Fertility by Age by Marriage Status in Snoqualmie Pass
| Age Bracket | Married | Unmarried |
| 15 to 19 years | 0 (0.0%) | 0 (0.0%) |
| 20 to 34 years | 0 (0.0%) | 0 (0.0%) |
| 35 to 50 years | 0 (0.0%) | 0 (0.0%) |
| Total | 0 (0.0%) | 0 (0.0%) |
Fertility by Education in Snoqualmie Pass
| Educational Attainment | Women with Births | Births / 1,000 Women |
| Less than High School | 0 (0.0%) | 0.0 |
| High School Diploma | 0 (0.0%) | 0.0 |
| College or Associate's Degree | 0 (0.0%) | 0.0 |
| Bachelor's Degree | 0 (0.0%) | 0.0 |
| Graduate Degree | 0 (0.0%) | 0.0 |
| Total | 0 (0.0%) | 0.0 |
Fertility by Education by Marriage Status in Snoqualmie Pass
| Educational Attainment | Married | Unmarried |
| Less than High School | 0 (0.0%) | 0 (0.0%) |
| High School Diploma | 0 (0.0%) | 0 (0.0%) |
| College or Associate's Degree | 0 (0.0%) | 0 (0.0%) |
| Bachelor's Degree | 0 (0.0%) | 0 (0.0%) |
| Graduate Degree | 0 (0.0%) | 0 (0.0%) |
| Total | 0 (0.0%) | 0 (0.0%) |
Employment Characteristics in Snoqualmie Pass
Employment by Class of Employer in Snoqualmie Pass
Among the 221 employed individuals in Snoqualmie Pass, private company employees (137 | 62.0%), self-employed (incorporated) (33 | 14.9%), and local government employees (30 | 13.6%) make up the most common classes of employment.
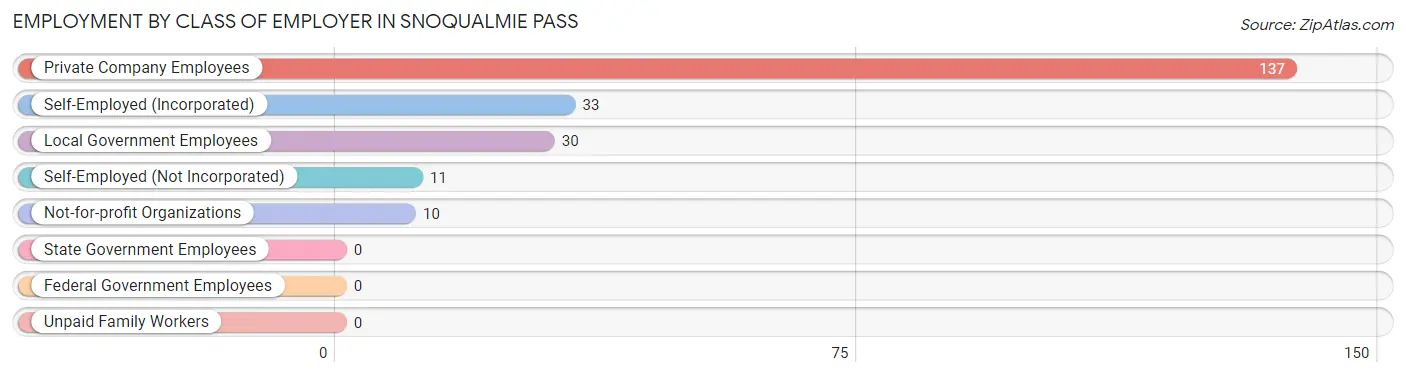
| Employer Class | # Employees | % Employees |
| Private Company Employees | 137 | 62.0% |
| Self-Employed (Incorporated) | 33 | 14.9% |
| Self-Employed (Not Incorporated) | 11 | 5.0% |
| Not-for-profit Organizations | 10 | 4.5% |
| Local Government Employees | 30 | 13.6% |
| State Government Employees | 0 | 0.0% |
| Federal Government Employees | 0 | 0.0% |
| Unpaid Family Workers | 0 | 0.0% |
| Total | 221 | 100.0% |
Employment Status by Age in Snoqualmie Pass
According to the labor force statistics for Snoqualmie Pass, out of the total population over 16 years of age (359), 64.1% or 230 individuals are in the labor force, with 3.9% or 9 of them unemployed. The age group with the highest labor force participation rate is 25 to 29 years, with 100.0% or 32 individuals in the labor force. Within the labor force, the 45 to 54 years age range has the highest percentage of unemployed individuals, with 21.4% or 9 of them being unemployed.
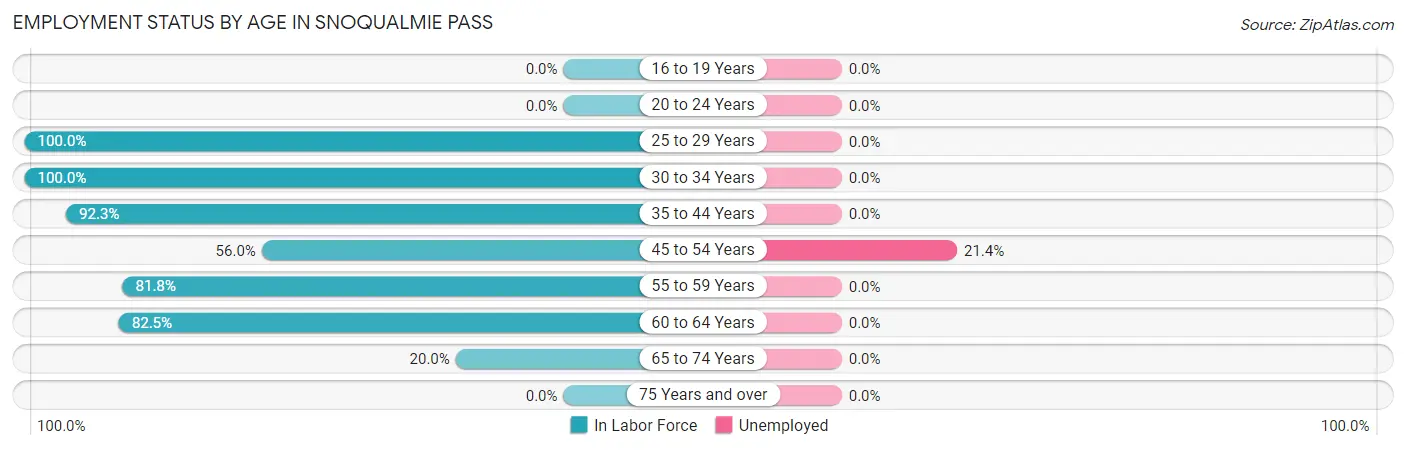
| Age Bracket | In Labor Force | Unemployed |
| 16 to 19 Years | 0 (0.0%) | 0 (0.0%) |
| 20 to 24 Years | 0 (0.0%) | 0 (0.0%) |
| 25 to 29 Years | 32 (100.0%) | 0 (0.0%) |
| 30 to 34 Years | 13 (100.0%) | 0 (0.0%) |
| 35 to 44 Years | 36 (92.3%) | 0 (0.0%) |
| 45 to 54 Years | 42 (56.0%) | 9 (21.4%) |
| 55 to 59 Years | 45 (81.8%) | 0 (0.0%) |
| 60 to 64 Years | 52 (82.5%) | 0 (0.0%) |
| 65 to 74 Years | 10 (20.0%) | 0 (0.0%) |
| 75 Years and over | 0 (0.0%) | 0 (0.0%) |
| Total | 230 (64.1%) | 9 (3.9%) |
Employment Status by Educational Attainment in Snoqualmie Pass
According to labor force statistics for Snoqualmie Pass, 79.4% of individuals (220) out of the total population between 25 and 64 years of age (277) are in the labor force, with 4.1% or 9 of them being unemployed. The group with the highest labor force participation rate are those with the educational attainment of high school diploma, with 100.0% or 16 individuals in the labor force. Within the labor force, individuals with college / associate degree education have the highest percentage of unemployment, with 8.5% or 9 of them being unemployed.
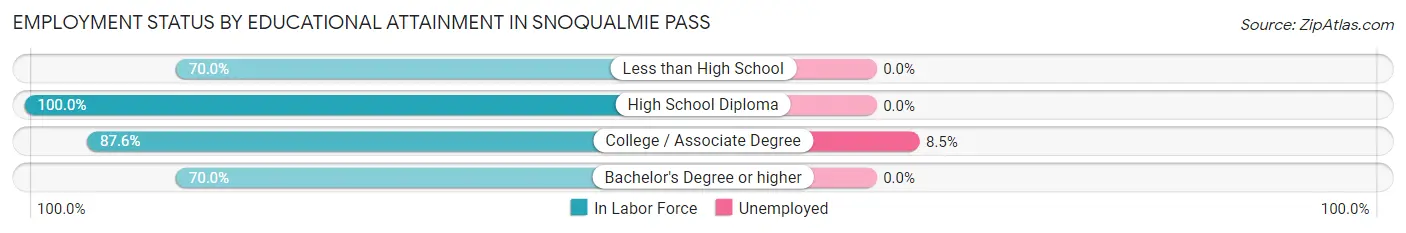
| Educational Attainment | In Labor Force | Unemployed |
| Less than High School | 7 (70.0%) | 0 (0.0%) |
| High School Diploma | 16 (100.0%) | 0 (0.0%) |
| College / Associate Degree | 106 (87.6%) | 10 (8.5%) |
| Bachelor's Degree or higher | 91 (70.0%) | 0 (0.0%) |
| Total | 220 (79.4%) | 11 (4.1%) |
Employment Occupations by Sex in Snoqualmie Pass
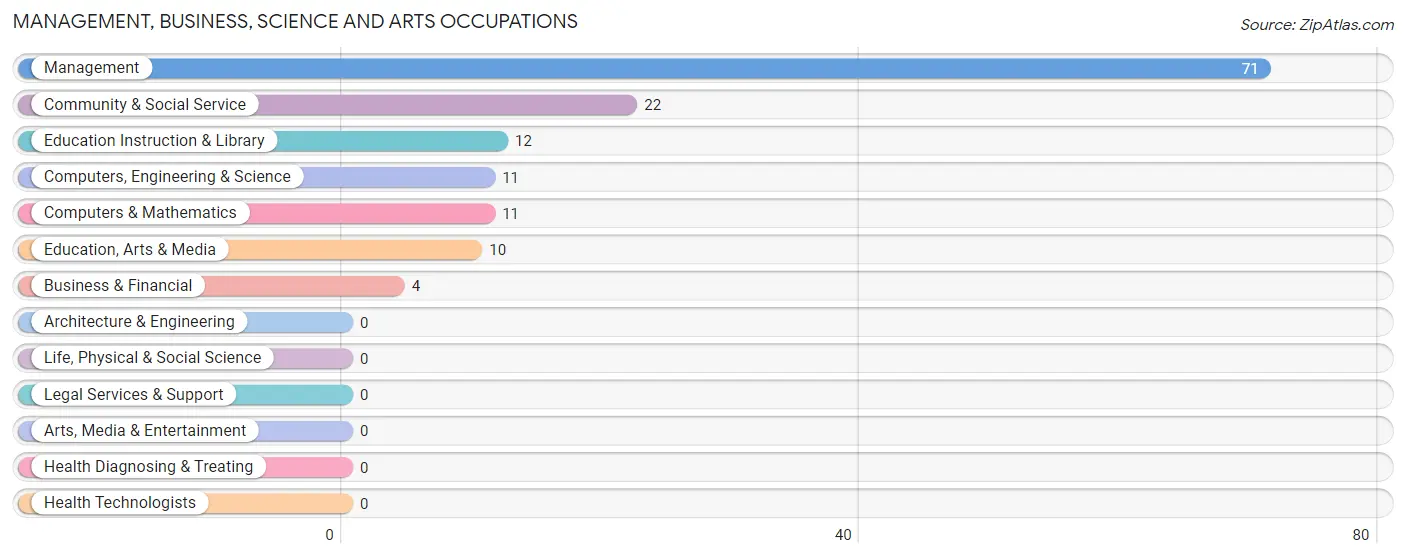
Management, Business, Science and Arts Occupations
The most common Management, Business, Science and Arts occupations in Snoqualmie Pass are Management (71 | 32.1%), Community & Social Service (22 | 10.0%), Education Instruction & Library (12 | 5.4%), Computers, Engineering & Science (11 | 5.0%), and Computers & Mathematics (11 | 5.0%).
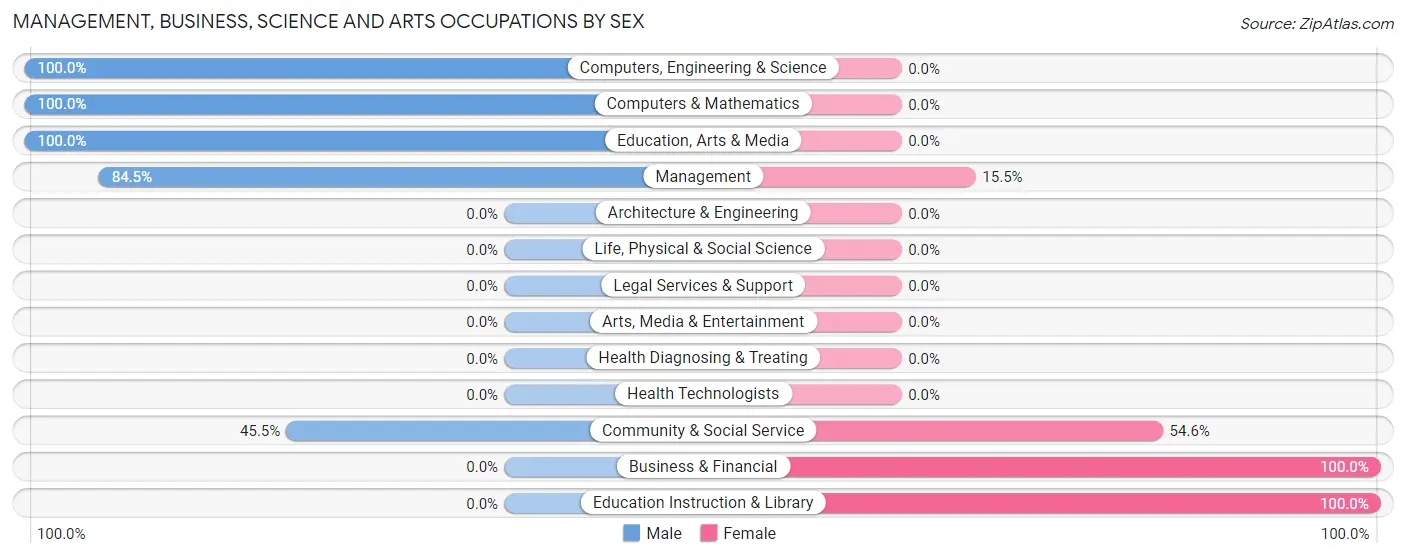
Management, Business, Science and Arts Occupations by Sex
Within the Management, Business, Science and Arts occupations in Snoqualmie Pass, the most male-oriented occupations are Computers, Engineering & Science (100.0%), Computers & Mathematics (100.0%), and Education, Arts & Media (100.0%), while the most female-oriented occupations are Business & Financial (100.0%), Education Instruction & Library (100.0%), and Community & Social Service (54.5%).
| Occupation | Male | Female |
| Management | 60 (84.5%) | 11 (15.5%) |
| Business & Financial | 0 (0.0%) | 4 (100.0%) |
| Computers, Engineering & Science | 11 (100.0%) | 0 (0.0%) |
| Computers & Mathematics | 11 (100.0%) | 0 (0.0%) |
| Architecture & Engineering | 0 (0.0%) | 0 (0.0%) |
| Life, Physical & Social Science | 0 (0.0%) | 0 (0.0%) |
| Community & Social Service | 10 (45.5%) | 12 (54.5%) |
| Education, Arts & Media | 10 (100.0%) | 0 (0.0%) |
| Legal Services & Support | 0 (0.0%) | 0 (0.0%) |
| Education Instruction & Library | 0 (0.0%) | 12 (100.0%) |
| Arts, Media & Entertainment | 0 (0.0%) | 0 (0.0%) |
| Health Diagnosing & Treating | 0 (0.0%) | 0 (0.0%) |
| Health Technologists | 0 (0.0%) | 0 (0.0%) |
| Total (Category) | 81 (75.0%) | 27 (25.0%) |
| Total (Overall) | 167 (75.6%) | 54 (24.4%) |
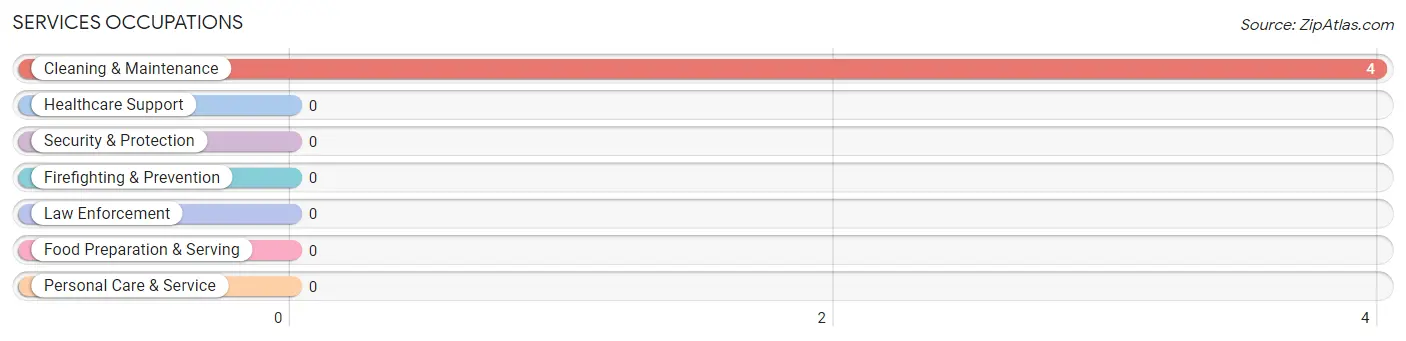
Services Occupations
The most common Services occupations in Snoqualmie Pass are , and Cleaning & Maintenance (4 | 1.8%).
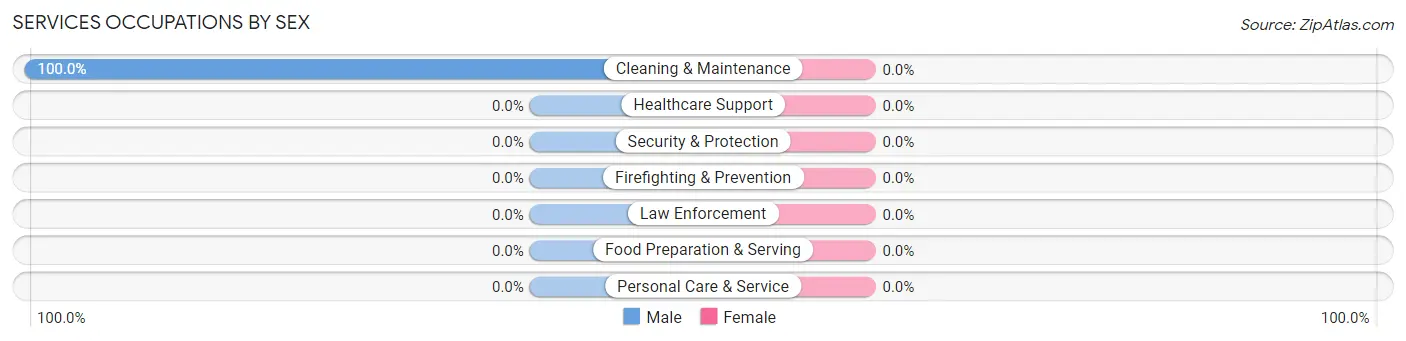
Services Occupations by Sex
| Occupation | Male | Female |
| Healthcare Support | 0 (0.0%) | 0 (0.0%) |
| Security & Protection | 0 (0.0%) | 0 (0.0%) |
| Firefighting & Prevention | 0 (0.0%) | 0 (0.0%) |
| Law Enforcement | 0 (0.0%) | 0 (0.0%) |
| Food Preparation & Serving | 0 (0.0%) | 0 (0.0%) |
| Cleaning & Maintenance | 4 (100.0%) | 0 (0.0%) |
| Personal Care & Service | 0 (0.0%) | 0 (0.0%) |
| Total (Category) | 4 (100.0%) | 0 (0.0%) |
| Total (Overall) | 167 (75.6%) | 54 (24.4%) |
Sales and Office Occupations
The most common Sales and Office occupations in Snoqualmie Pass are Sales & Related (38 | 17.2%), and Office & Administration (13 | 5.9%).
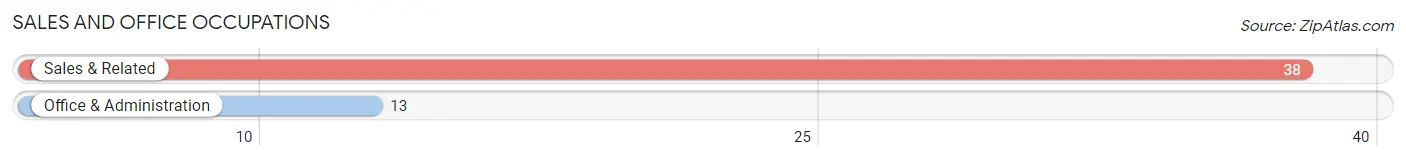
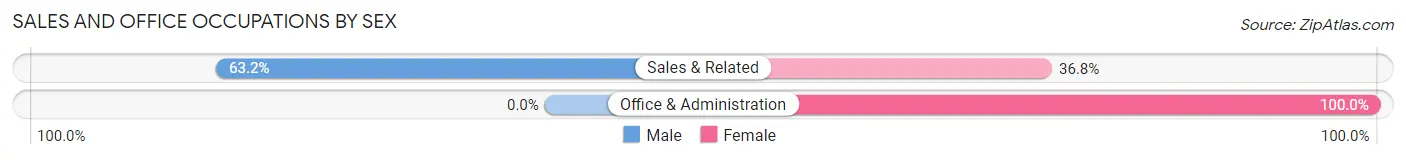
Sales and Office Occupations by Sex
| Occupation | Male | Female |
| Sales & Related | 24 (63.2%) | 14 (36.8%) |
| Office & Administration | 0 (0.0%) | 13 (100.0%) |
| Total (Category) | 24 (47.1%) | 27 (52.9%) |
| Total (Overall) | 167 (75.6%) | 54 (24.4%) |
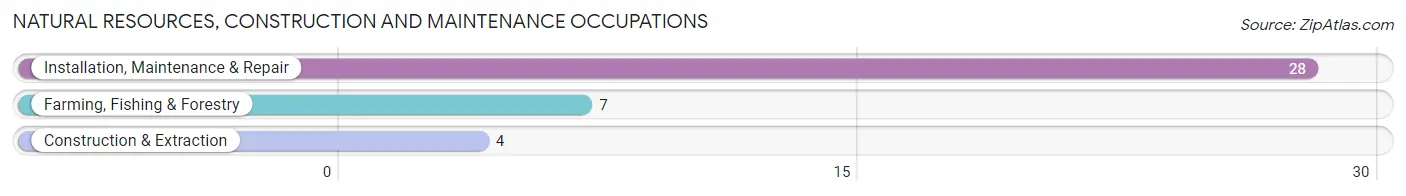
Natural Resources, Construction and Maintenance Occupations
The most common Natural Resources, Construction and Maintenance occupations in Snoqualmie Pass are Installation, Maintenance & Repair (28 | 12.7%), Farming, Fishing & Forestry (7 | 3.2%), and Construction & Extraction (4 | 1.8%).
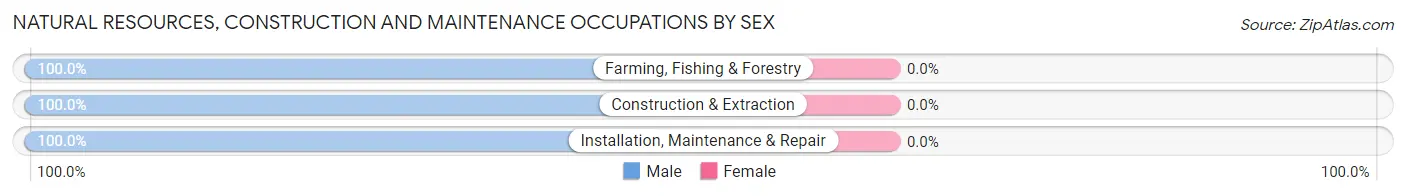
Natural Resources, Construction and Maintenance Occupations by Sex
| Occupation | Male | Female |
| Farming, Fishing & Forestry | 7 (100.0%) | 0 (0.0%) |
| Construction & Extraction | 4 (100.0%) | 0 (0.0%) |
| Installation, Maintenance & Repair | 28 (100.0%) | 0 (0.0%) |
| Total (Category) | 39 (100.0%) | 0 (0.0%) |
| Total (Overall) | 167 (75.6%) | 54 (24.4%) |
Production, Transportation and Moving Occupations
The most common Production, Transportation and Moving occupations in Snoqualmie Pass are , and Production (19 | 8.6%).
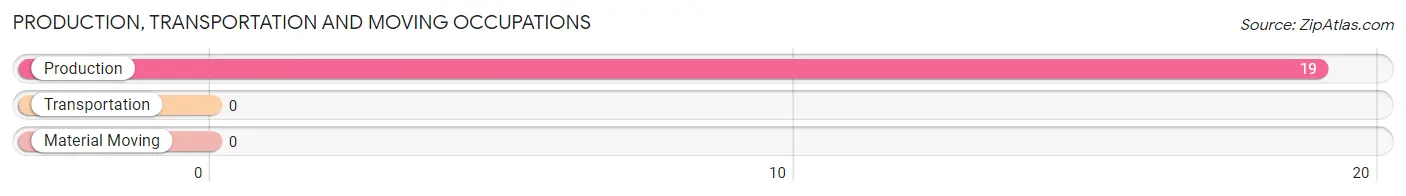
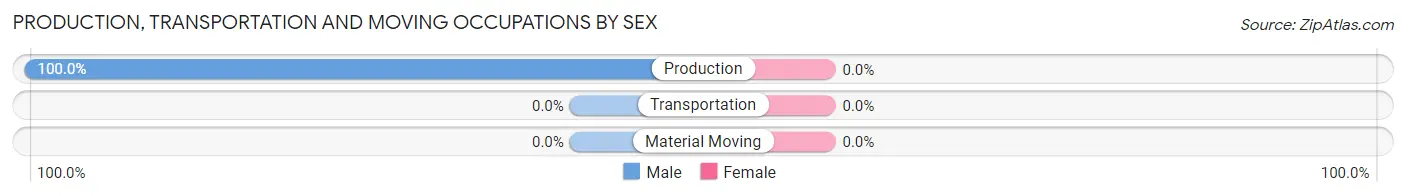
Production, Transportation and Moving Occupations by Sex
| Occupation | Male | Female |
| Production | 19 (100.0%) | 0 (0.0%) |
| Transportation | 0 (0.0%) | 0 (0.0%) |
| Material Moving | 0 (0.0%) | 0 (0.0%) |
| Total (Category) | 19 (100.0%) | 0 (0.0%) |
| Total (Overall) | 167 (75.6%) | 54 (24.4%) |
Employment Industries by Sex in Snoqualmie Pass
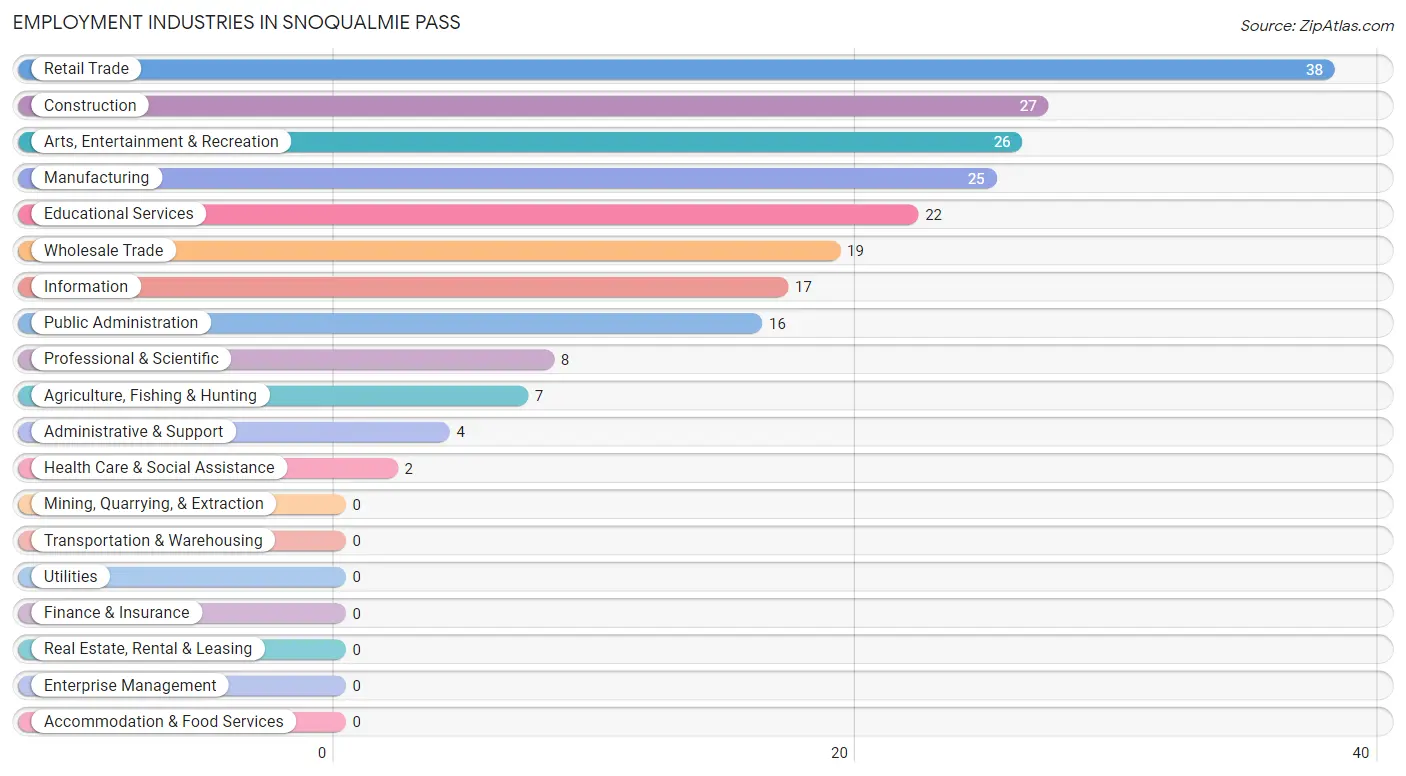
Employment Industries in Snoqualmie Pass
The major employment industries in Snoqualmie Pass include Retail Trade (38 | 17.2%), Construction (27 | 12.2%), Arts, Entertainment & Recreation (26 | 11.8%), Manufacturing (25 | 11.3%), and Educational Services (22 | 10.0%).
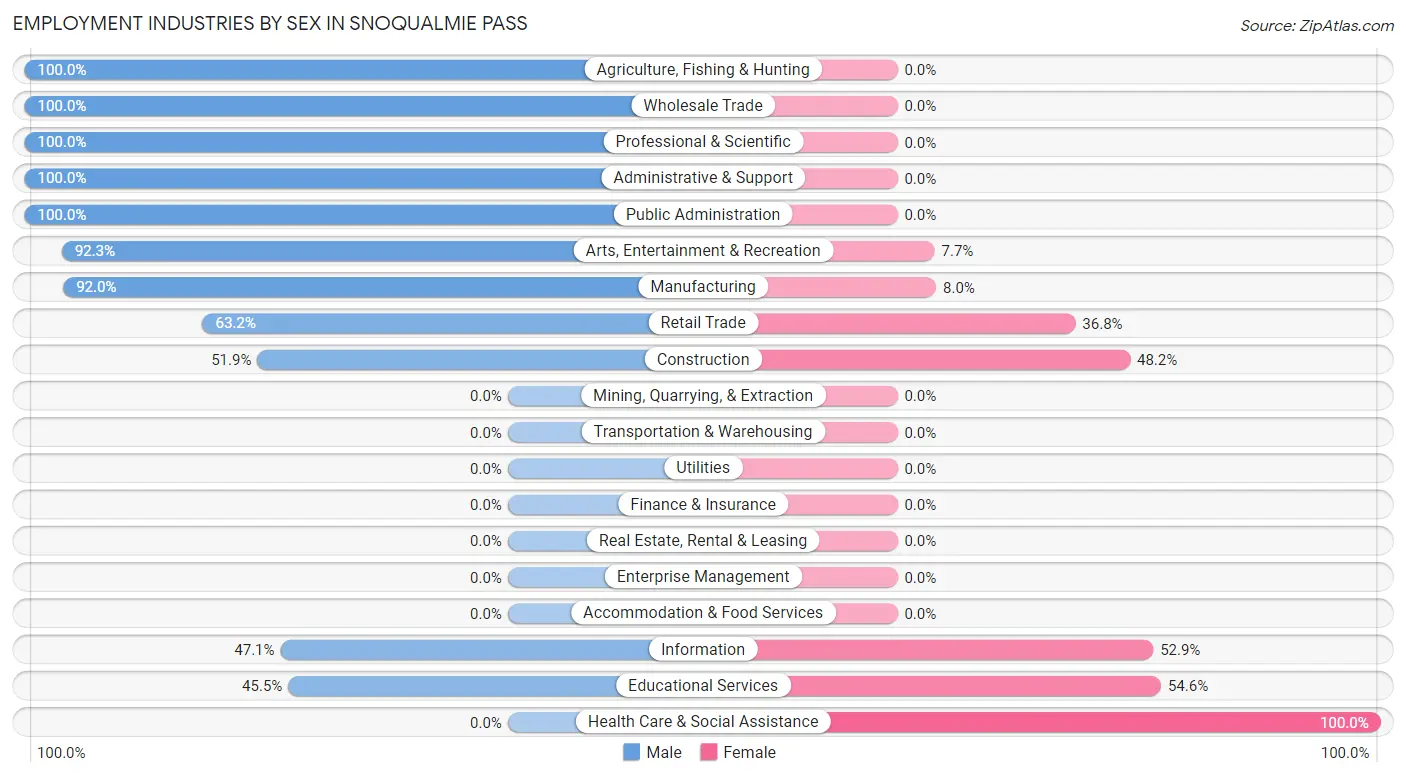
Employment Industries by Sex in Snoqualmie Pass
The Snoqualmie Pass industries that see more men than women are Agriculture, Fishing & Hunting (100.0%), Wholesale Trade (100.0%), and Professional & Scientific (100.0%), whereas the industries that tend to have a higher number of women are Health Care & Social Assistance (100.0%), Educational Services (54.5%), and Information (52.9%).
| Industry | Male | Female |
| Agriculture, Fishing & Hunting | 7 (100.0%) | 0 (0.0%) |
| Mining, Quarrying, & Extraction | 0 (0.0%) | 0 (0.0%) |
| Construction | 14 (51.8%) | 13 (48.1%) |
| Manufacturing | 23 (92.0%) | 2 (8.0%) |
| Wholesale Trade | 19 (100.0%) | 0 (0.0%) |
| Retail Trade | 24 (63.2%) | 14 (36.8%) |
| Transportation & Warehousing | 0 (0.0%) | 0 (0.0%) |
| Utilities | 0 (0.0%) | 0 (0.0%) |
| Information | 8 (47.1%) | 9 (52.9%) |
| Finance & Insurance | 0 (0.0%) | 0 (0.0%) |
| Real Estate, Rental & Leasing | 0 (0.0%) | 0 (0.0%) |
| Professional & Scientific | 8 (100.0%) | 0 (0.0%) |
| Enterprise Management | 0 (0.0%) | 0 (0.0%) |
| Administrative & Support | 4 (100.0%) | 0 (0.0%) |
| Educational Services | 10 (45.5%) | 12 (54.5%) |
| Health Care & Social Assistance | 0 (0.0%) | 2 (100.0%) |
| Arts, Entertainment & Recreation | 24 (92.3%) | 2 (7.7%) |
| Accommodation & Food Services | 0 (0.0%) | 0 (0.0%) |
| Public Administration | 16 (100.0%) | 0 (0.0%) |
| Total | 167 (75.6%) | 54 (24.4%) |
Education in Snoqualmie Pass
School Enrollment in Snoqualmie Pass
The most common levels of schooling among the 66 students in Snoqualmie Pass are college / undergraduate (24 | 36.4%), elementary school (21 | 31.8%), and kindergarten (11 | 16.7%).
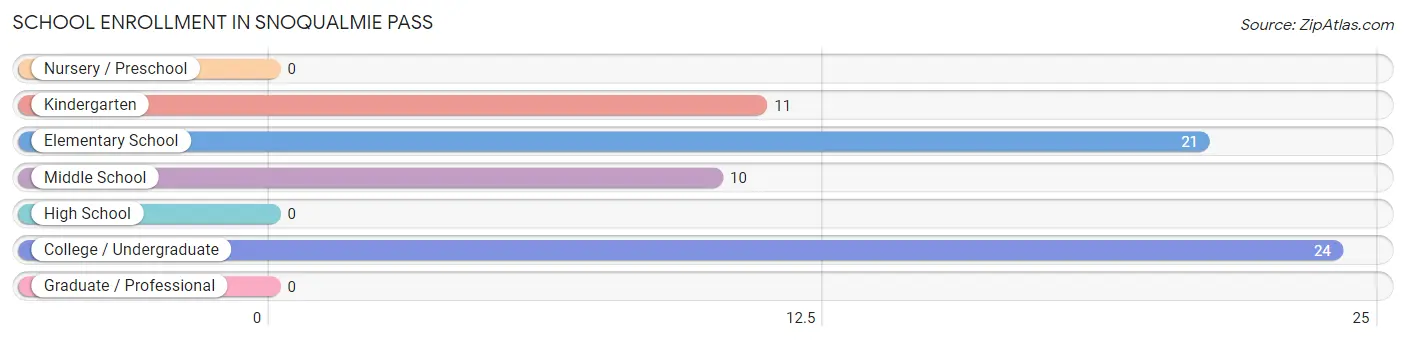
| School Level | # Students | % Students |
| Nursery / Preschool | 0 | 0.0% |
| Kindergarten | 11 | 16.7% |
| Elementary School | 21 | 31.8% |
| Middle School | 10 | 15.1% |
| High School | 0 | 0.0% |
| College / Undergraduate | 24 | 36.4% |
| Graduate / Professional | 0 | 0.0% |
| Total | 66 | 100.0% |
School Enrollment by Age by Funding Source in Snoqualmie Pass
Out of a total of 66 students who are enrolled in schools in Snoqualmie Pass, 12 (18.2%) attend a private institution, while the remaining 54 (81.8%) are enrolled in public schools. The age group of 35 years and over has the highest likelihood of being enrolled in private schools, with 12 (100.0% in the age bracket) enrolled. Conversely, the age group of 5 to 9 year old has the lowest likelihood of being enrolled in a private school, with 32 (100.0% in the age bracket) attending a public institution.
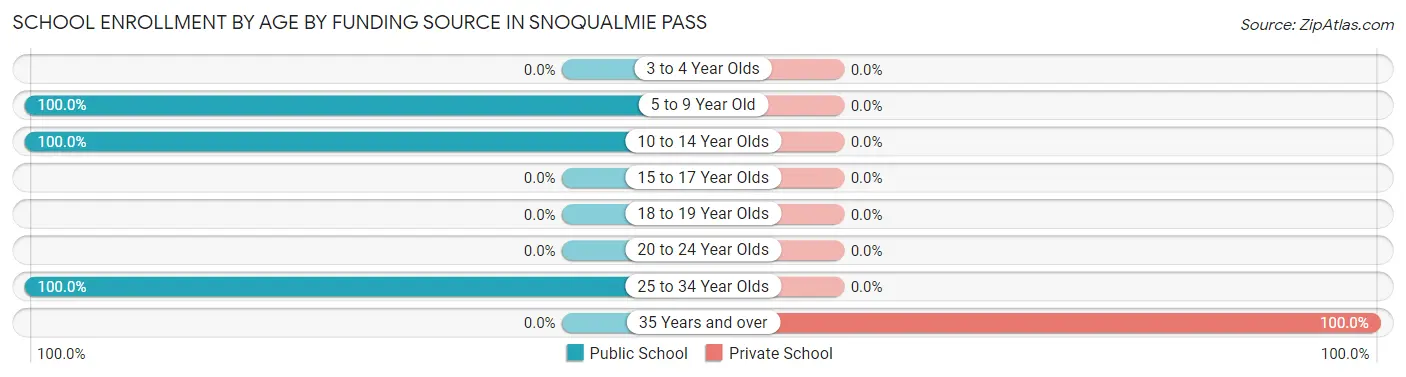
| Age Bracket | Public School | Private School |
| 3 to 4 Year Olds | 0 (0.0%) | 0 (0.0%) |
| 5 to 9 Year Old | 32 (100.0%) | 0 (0.0%) |
| 10 to 14 Year Olds | 10 (100.0%) | 0 (0.0%) |
| 15 to 17 Year Olds | 0 (0.0%) | 0 (0.0%) |
| 18 to 19 Year Olds | 0 (0.0%) | 0 (0.0%) |
| 20 to 24 Year Olds | 0 (0.0%) | 0 (0.0%) |
| 25 to 34 Year Olds | 12 (100.0%) | 0 (0.0%) |
| 35 Years and over | 0 (0.0%) | 12 (100.0%) |
| Total | 54 (81.8%) | 12 (18.2%) |
Educational Attainment by Field of Study in Snoqualmie Pass
Bio, nature & agricultural (37 | 19.8%), visual & performing arts (33 | 17.6%), social sciences (26 | 13.9%), education (22 | 11.8%), and physical & health sciences (19 | 10.2%) are the most common fields of study among 187 individuals in Snoqualmie Pass who have obtained a bachelor's degree or higher.
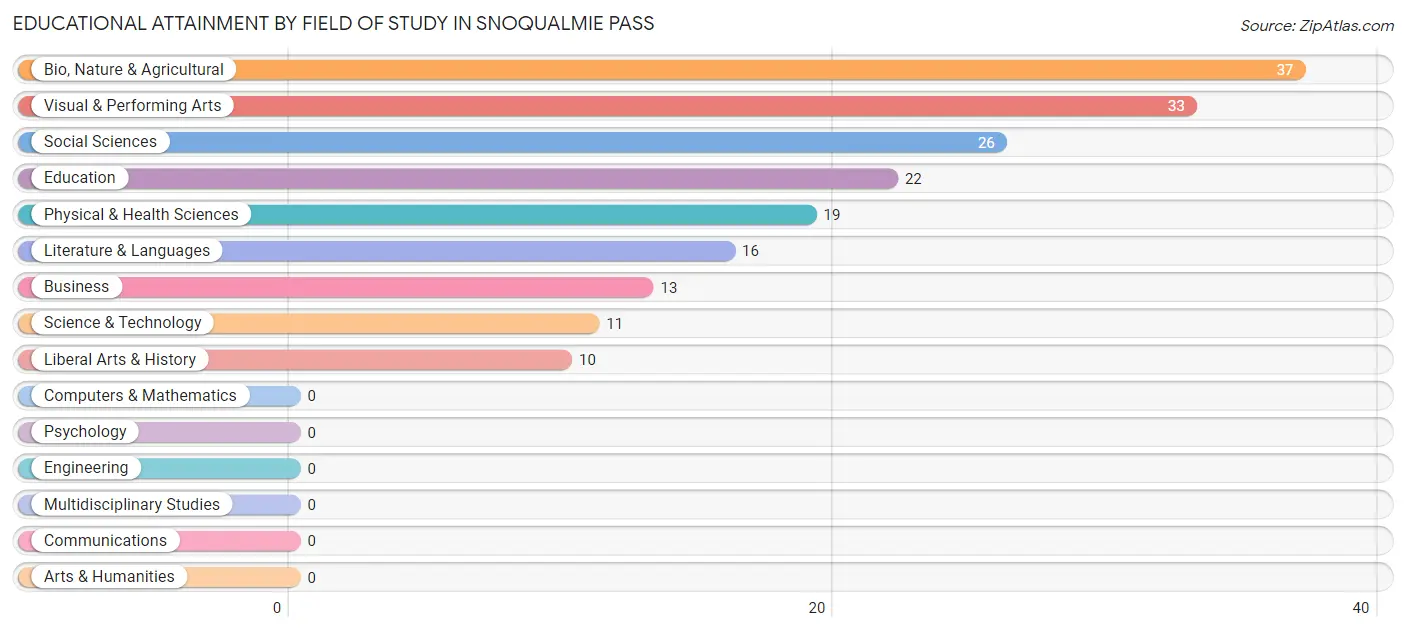
| Field of Study | # Graduates | % Graduates |
| Computers & Mathematics | 0 | 0.0% |
| Bio, Nature & Agricultural | 37 | 19.8% |
| Physical & Health Sciences | 19 | 10.2% |
| Psychology | 0 | 0.0% |
| Social Sciences | 26 | 13.9% |
| Engineering | 0 | 0.0% |
| Multidisciplinary Studies | 0 | 0.0% |
| Science & Technology | 11 | 5.9% |
| Business | 13 | 7.0% |
| Education | 22 | 11.8% |
| Literature & Languages | 16 | 8.6% |
| Liberal Arts & History | 10 | 5.3% |
| Visual & Performing Arts | 33 | 17.6% |
| Communications | 0 | 0.0% |
| Arts & Humanities | 0 | 0.0% |
| Total | 187 | 100.0% |
Transportation & Commute in Snoqualmie Pass
Vehicle Availability by Sex in Snoqualmie Pass
The most prevalent vehicle ownership categories in Snoqualmie Pass are males with 2 vehicles (72, accounting for 46.2%) and females with 2 vehicles (29, making up 138.5%).
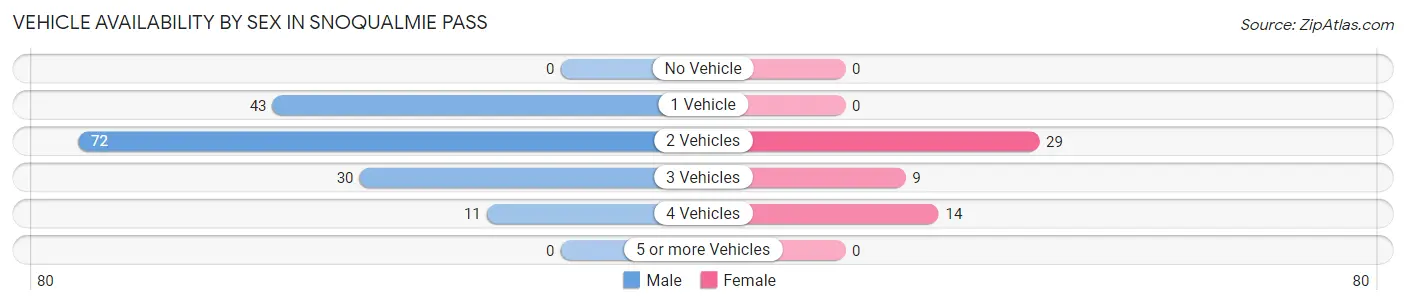
| Vehicles Available | Male | Female |
| No Vehicle | 0 (0.0%) | 0 (0.0%) |
| 1 Vehicle | 43 (27.6%) | 0 (0.0%) |
| 2 Vehicles | 72 (46.2%) | 29 (55.8%) |
| 3 Vehicles | 30 (19.2%) | 9 (17.3%) |
| 4 Vehicles | 11 (7.0%) | 14 (26.9%) |
| 5 or more Vehicles | 0 (0.0%) | 0 (0.0%) |
| Total | 156 (100.0%) | 52 (100.0%) |
Commute Time in Snoqualmie Pass
The most frequently occuring commute durations in Snoqualmie Pass are 45 to 59 minutes (51 commuters, 30.9%), 60 to 89 minutes (33 commuters, 20.0%), and 5 to 9 minutes (28 commuters, 17.0%).
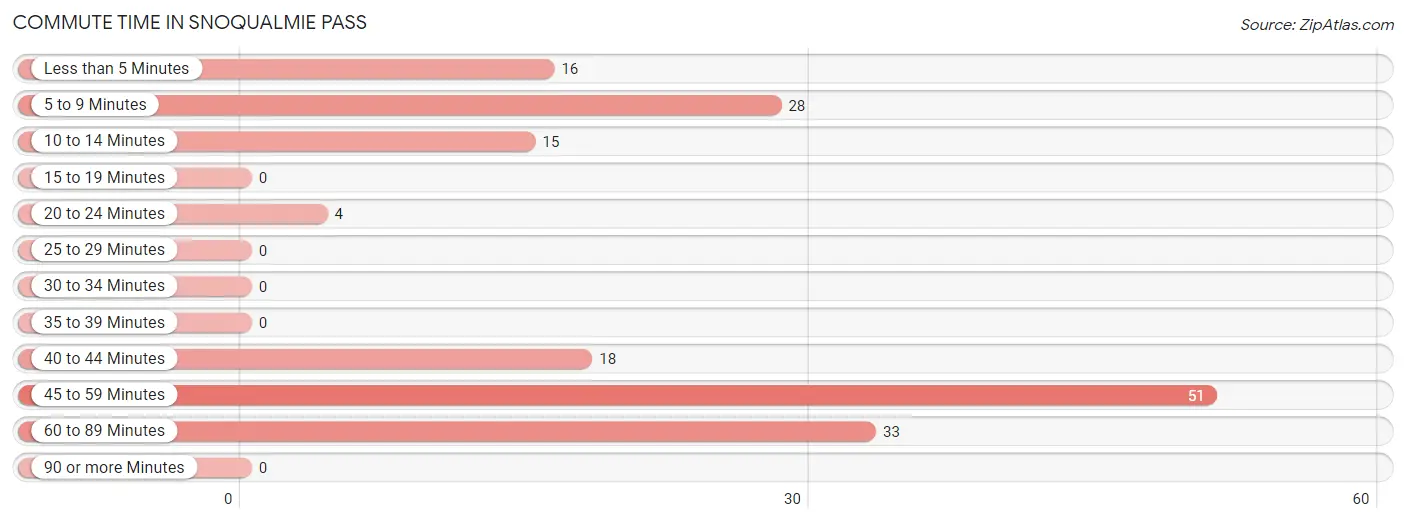
| Commute Time | # Commuters | % Commuters |
| Less than 5 Minutes | 16 | 9.7% |
| 5 to 9 Minutes | 28 | 17.0% |
| 10 to 14 Minutes | 15 | 9.1% |
| 15 to 19 Minutes | 0 | 0.0% |
| 20 to 24 Minutes | 4 | 2.4% |
| 25 to 29 Minutes | 0 | 0.0% |
| 30 to 34 Minutes | 0 | 0.0% |
| 35 to 39 Minutes | 0 | 0.0% |
| 40 to 44 Minutes | 18 | 10.9% |
| 45 to 59 Minutes | 51 | 30.9% |
| 60 to 89 Minutes | 33 | 20.0% |
| 90 or more Minutes | 0 | 0.0% |
Commute Time by Sex in Snoqualmie Pass
The most common commute times in Snoqualmie Pass are 45 to 59 minutes (51 commuters, 36.7%) for males and 40 to 44 minutes (14 commuters, 53.8%) for females.
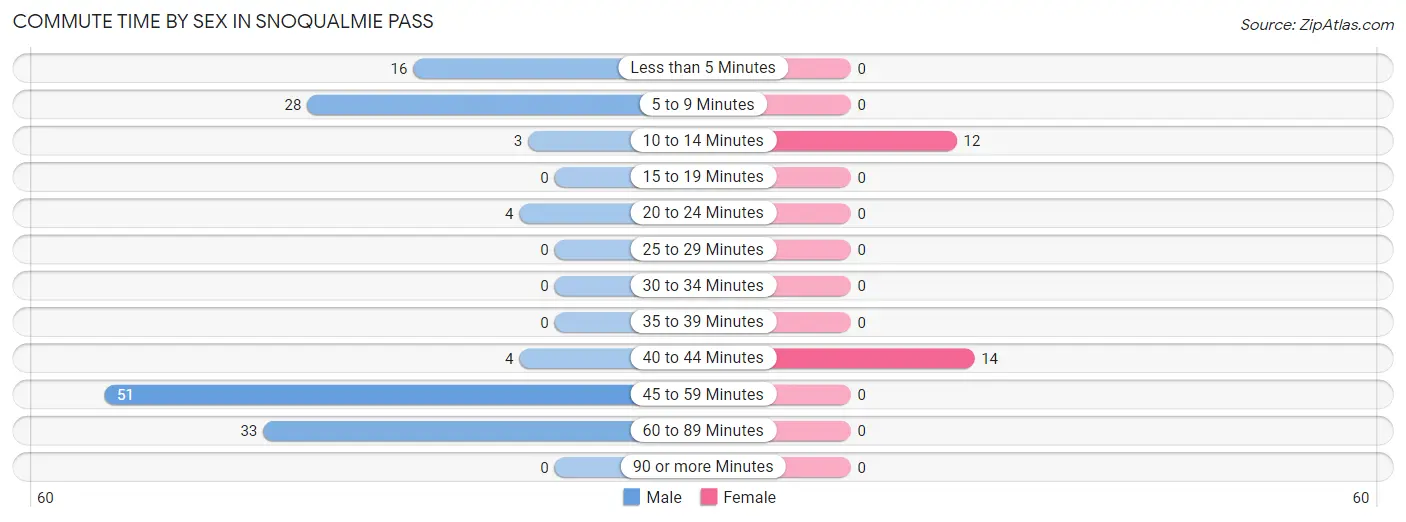
| Commute Time | Male | Female |
| Less than 5 Minutes | 16 (11.5%) | 0 (0.0%) |
| 5 to 9 Minutes | 28 (20.1%) | 0 (0.0%) |
| 10 to 14 Minutes | 3 (2.2%) | 12 (46.2%) |
| 15 to 19 Minutes | 0 (0.0%) | 0 (0.0%) |
| 20 to 24 Minutes | 4 (2.9%) | 0 (0.0%) |
| 25 to 29 Minutes | 0 (0.0%) | 0 (0.0%) |
| 30 to 34 Minutes | 0 (0.0%) | 0 (0.0%) |
| 35 to 39 Minutes | 0 (0.0%) | 0 (0.0%) |
| 40 to 44 Minutes | 4 (2.9%) | 14 (53.8%) |
| 45 to 59 Minutes | 51 (36.7%) | 0 (0.0%) |
| 60 to 89 Minutes | 33 (23.7%) | 0 (0.0%) |
| 90 or more Minutes | 0 (0.0%) | 0 (0.0%) |
Time of Departure to Work by Sex in Snoqualmie Pass
The most frequent times of departure to work in Snoqualmie Pass are 9:00 AM to 9:59 AM (25, 18.0%) for males and 10:00 AM to 10:59 AM (14, 53.8%) for females.
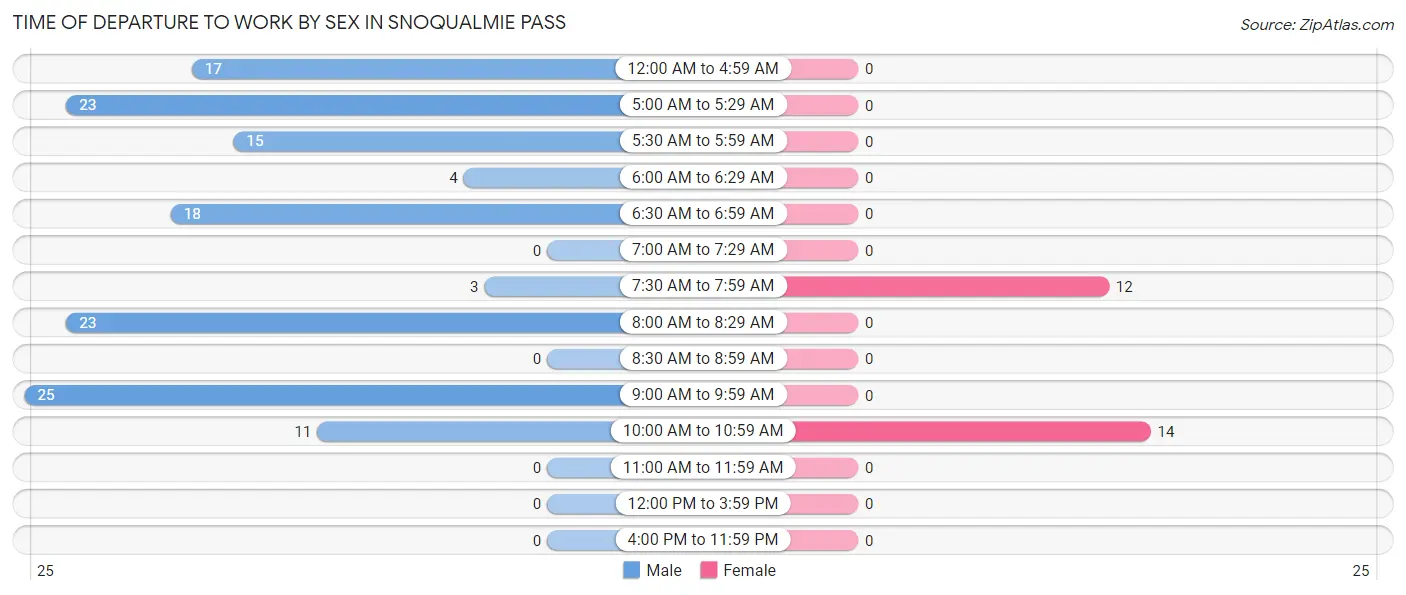
| Time of Departure | Male | Female |
| 12:00 AM to 4:59 AM | 17 (12.2%) | 0 (0.0%) |
| 5:00 AM to 5:29 AM | 23 (16.6%) | 0 (0.0%) |
| 5:30 AM to 5:59 AM | 15 (10.8%) | 0 (0.0%) |
| 6:00 AM to 6:29 AM | 4 (2.9%) | 0 (0.0%) |
| 6:30 AM to 6:59 AM | 18 (13.0%) | 0 (0.0%) |
| 7:00 AM to 7:29 AM | 0 (0.0%) | 0 (0.0%) |
| 7:30 AM to 7:59 AM | 3 (2.2%) | 12 (46.2%) |
| 8:00 AM to 8:29 AM | 23 (16.6%) | 0 (0.0%) |
| 8:30 AM to 8:59 AM | 0 (0.0%) | 0 (0.0%) |
| 9:00 AM to 9:59 AM | 25 (18.0%) | 0 (0.0%) |
| 10:00 AM to 10:59 AM | 11 (7.9%) | 14 (53.8%) |
| 11:00 AM to 11:59 AM | 0 (0.0%) | 0 (0.0%) |
| 12:00 PM to 3:59 PM | 0 (0.0%) | 0 (0.0%) |
| 4:00 PM to 11:59 PM | 0 (0.0%) | 0 (0.0%) |
| Total | 139 (100.0%) | 26 (100.0%) |
Housing Occupancy in Snoqualmie Pass
Occupancy by Ownership in Snoqualmie Pass
Of the total 189 dwellings in Snoqualmie Pass, owner-occupied units account for 153 (80.9%), while renter-occupied units make up 36 (19.1%).
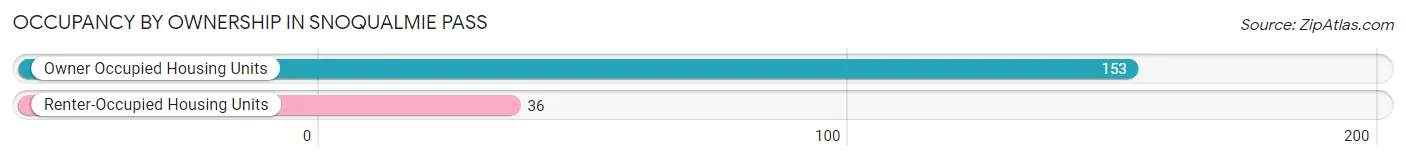
| Occupancy | # Housing Units | % Housing Units |
| Owner Occupied Housing Units | 153 | 80.9% |
| Renter-Occupied Housing Units | 36 | 19.1% |
| Total Occupied Housing Units | 189 | 100.0% |
Occupancy by Household Size in Snoqualmie Pass
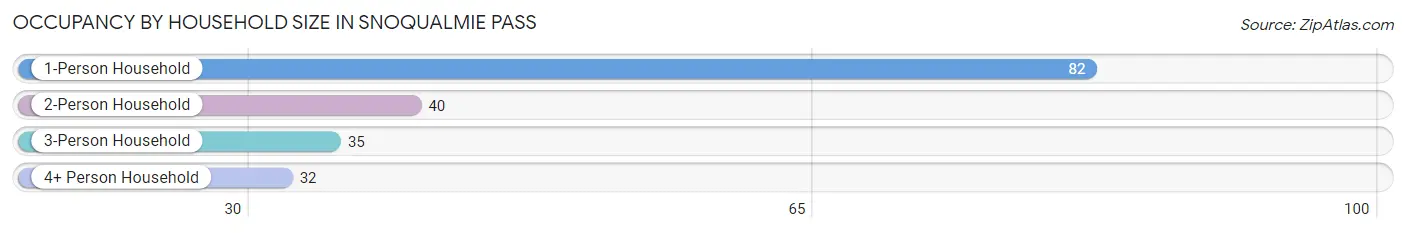
| Household Size | # Housing Units | % Housing Units |
| 1-Person Household | 82 | 43.4% |
| 2-Person Household | 40 | 21.2% |
| 3-Person Household | 35 | 18.5% |
| 4+ Person Household | 32 | 16.9% |
| Total Housing Units | 189 | 100.0% |
Occupancy by Ownership by Household Size in Snoqualmie Pass
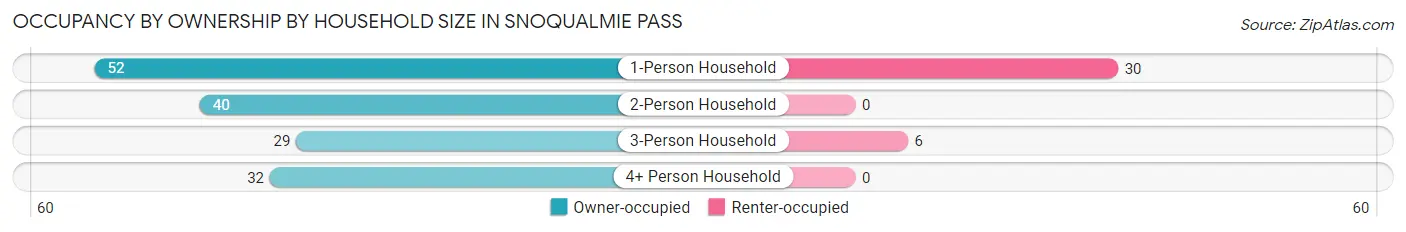
| Household Size | Owner-occupied | Renter-occupied |
| 1-Person Household | 52 (63.4%) | 30 (36.6%) |
| 2-Person Household | 40 (100.0%) | 0 (0.0%) |
| 3-Person Household | 29 (82.9%) | 6 (17.1%) |
| 4+ Person Household | 32 (100.0%) | 0 (0.0%) |
| Total Housing Units | 153 (80.9%) | 36 (19.1%) |
Occupancy by Educational Attainment in Snoqualmie Pass
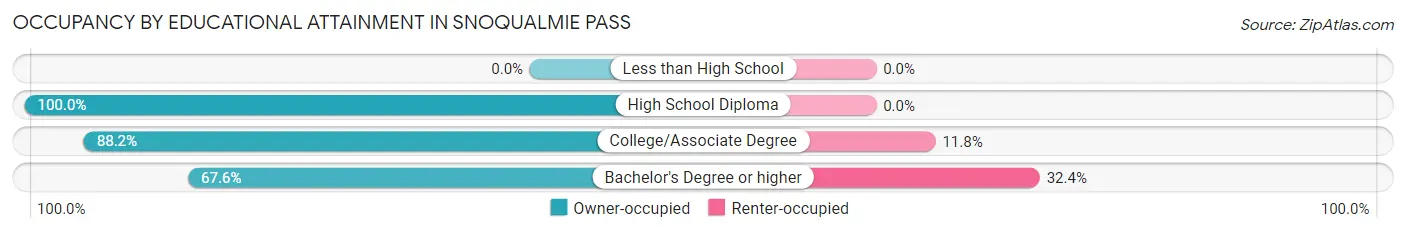
| Household Size | Owner-occupied | Renter-occupied |
| Less than High School | 0 (0.0%) | 0 (0.0%) |
| High School Diploma | 13 (100.0%) | 0 (0.0%) |
| College/Associate Degree | 90 (88.2%) | 12 (11.8%) |
| Bachelor's Degree or higher | 50 (67.6%) | 24 (32.4%) |
Occupancy by Age of Householder in Snoqualmie Pass
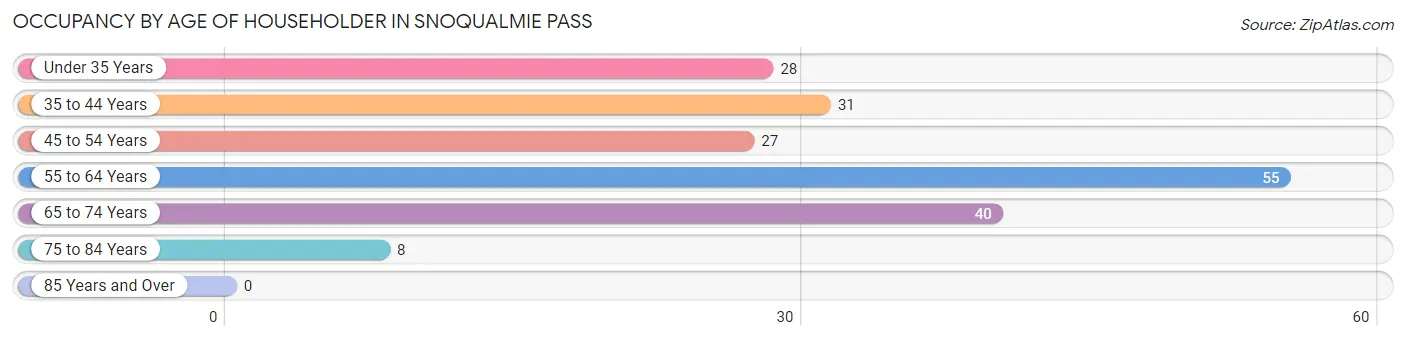
| Age Bracket | # Households | % Households |
| Under 35 Years | 28 | 14.8% |
| 35 to 44 Years | 31 | 16.4% |
| 45 to 54 Years | 27 | 14.3% |
| 55 to 64 Years | 55 | 29.1% |
| 65 to 74 Years | 40 | 21.2% |
| 75 to 84 Years | 8 | 4.2% |
| 85 Years and Over | 0 | 0.0% |
| Total | 189 | 100.0% |
Housing Finances in Snoqualmie Pass
Median Income by Occupancy in Snoqualmie Pass
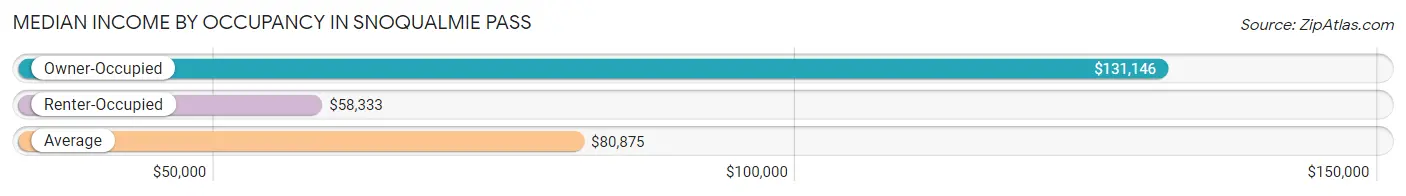
| Occupancy Type | # Households | Median Income |
| Owner-Occupied | 153 (80.9%) | $131,146 |
| Renter-Occupied | 36 (19.1%) | $58,333 |
| Average | 189 (100.0%) | $80,875 |
Occupancy by Householder Income Bracket in Snoqualmie Pass
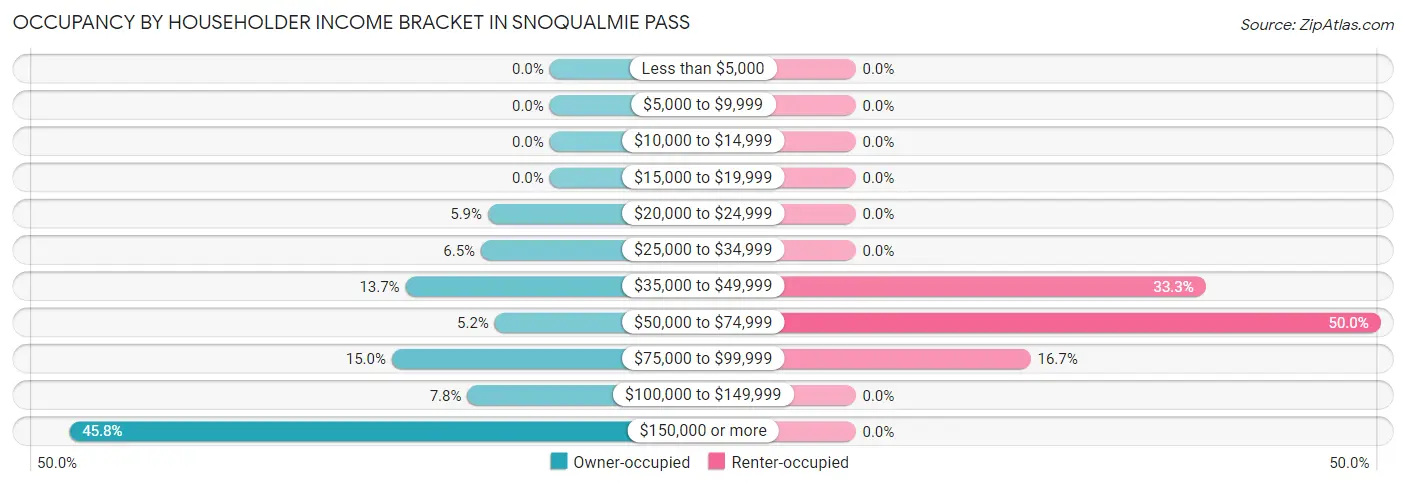
| Income Bracket | Owner-occupied | Renter-occupied |
| Less than $5,000 | 0 (0.0%) | 0 (0.0%) |
| $5,000 to $9,999 | 0 (0.0%) | 0 (0.0%) |
| $10,000 to $14,999 | 0 (0.0%) | 0 (0.0%) |
| $15,000 to $19,999 | 0 (0.0%) | 0 (0.0%) |
| $20,000 to $24,999 | 9 (5.9%) | 0 (0.0%) |
| $25,000 to $34,999 | 10 (6.5%) | 0 (0.0%) |
| $35,000 to $49,999 | 21 (13.7%) | 12 (33.3%) |
| $50,000 to $74,999 | 8 (5.2%) | 18 (50.0%) |
| $75,000 to $99,999 | 23 (15.0%) | 6 (16.7%) |
| $100,000 to $149,999 | 12 (7.8%) | 0 (0.0%) |
| $150,000 or more | 70 (45.8%) | 0 (0.0%) |
| Total | 153 (100.0%) | 36 (100.0%) |
Monthly Housing Cost Tiers in Snoqualmie Pass
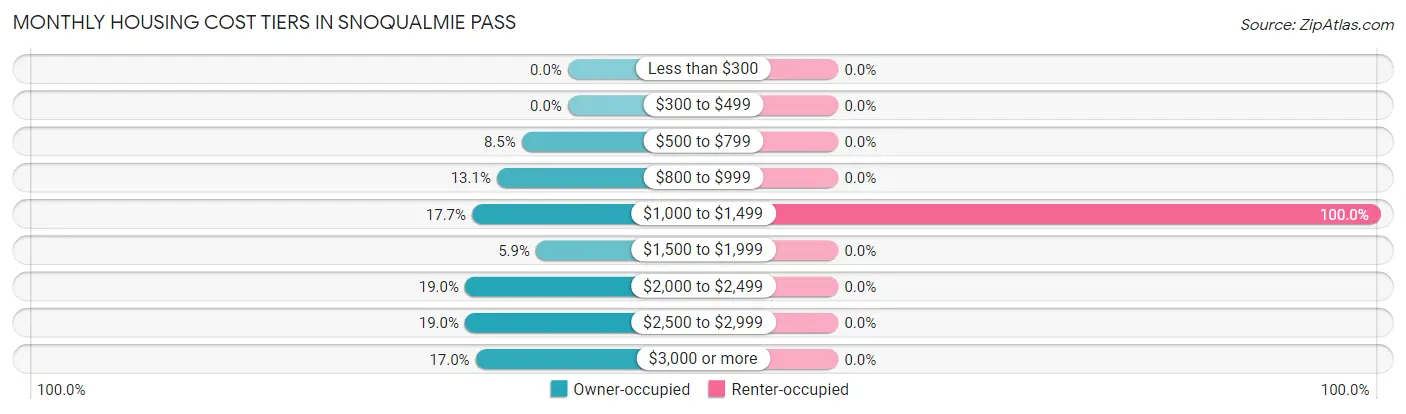
| Monthly Cost | Owner-occupied | Renter-occupied |
| Less than $300 | 0 (0.0%) | 0 (0.0%) |
| $300 to $499 | 0 (0.0%) | 0 (0.0%) |
| $500 to $799 | 13 (8.5%) | 0 (0.0%) |
| $800 to $999 | 20 (13.1%) | 0 (0.0%) |
| $1,000 to $1,499 | 27 (17.6%) | 36 (100.0%) |
| $1,500 to $1,999 | 9 (5.9%) | 0 (0.0%) |
| $2,000 to $2,499 | 29 (19.0%) | 0 (0.0%) |
| $2,500 to $2,999 | 29 (19.0%) | 0 (0.0%) |
| $3,000 or more | 26 (17.0%) | 0 (0.0%) |
| Total | 153 (100.0%) | 36 (100.0%) |
Physical Housing Characteristics in Snoqualmie Pass
Housing Structures in Snoqualmie Pass
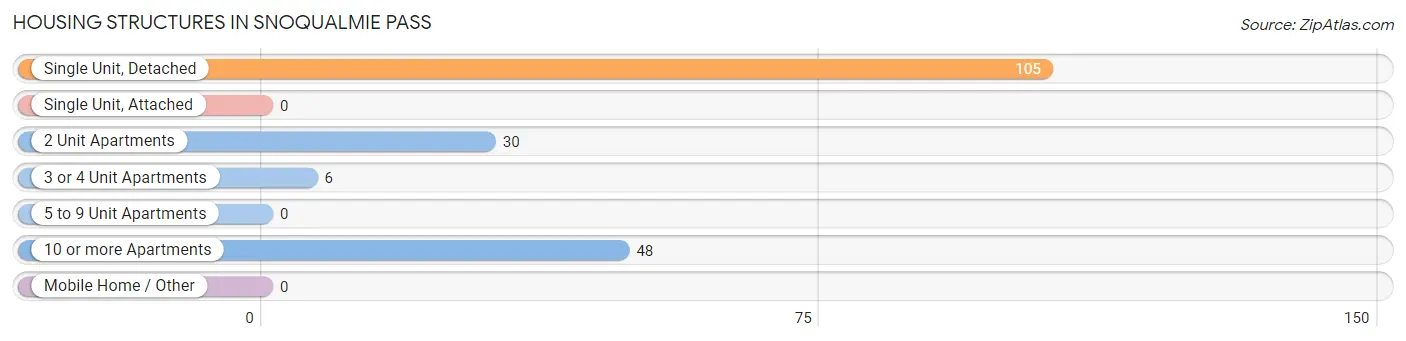
| Structure Type | # Housing Units | % Housing Units |
| Single Unit, Detached | 105 | 55.6% |
| Single Unit, Attached | 0 | 0.0% |
| 2 Unit Apartments | 30 | 15.9% |
| 3 or 4 Unit Apartments | 6 | 3.2% |
| 5 to 9 Unit Apartments | 0 | 0.0% |
| 10 or more Apartments | 48 | 25.4% |
| Mobile Home / Other | 0 | 0.0% |
| Total | 189 | 100.0% |
Housing Structures by Occupancy in Snoqualmie Pass
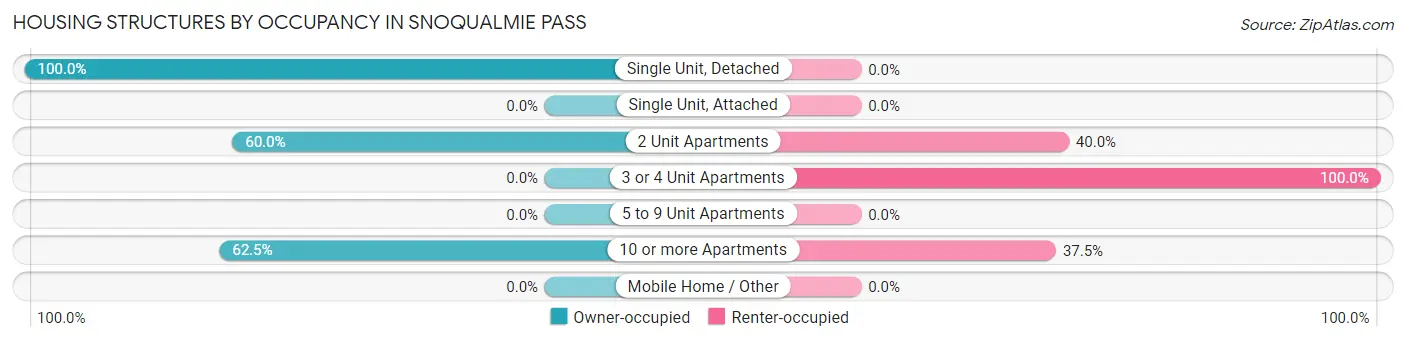
| Structure Type | Owner-occupied | Renter-occupied |
| Single Unit, Detached | 105 (100.0%) | 0 (0.0%) |
| Single Unit, Attached | 0 (0.0%) | 0 (0.0%) |
| 2 Unit Apartments | 18 (60.0%) | 12 (40.0%) |
| 3 or 4 Unit Apartments | 0 (0.0%) | 6 (100.0%) |
| 5 to 9 Unit Apartments | 0 (0.0%) | 0 (0.0%) |
| 10 or more Apartments | 30 (62.5%) | 18 (37.5%) |
| Mobile Home / Other | 0 (0.0%) | 0 (0.0%) |
| Total | 153 (80.9%) | 36 (19.1%) |
Housing Structures by Number of Rooms in Snoqualmie Pass
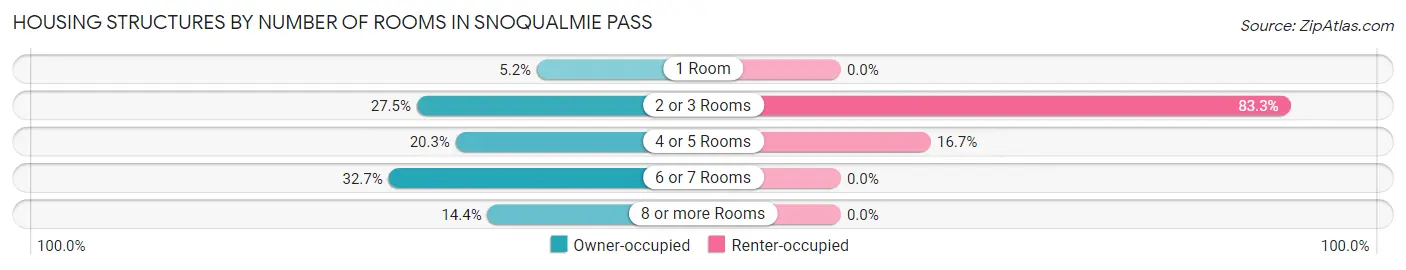
| Number of Rooms | Owner-occupied | Renter-occupied |
| 1 Room | 8 (5.2%) | 0 (0.0%) |
| 2 or 3 Rooms | 42 (27.5%) | 30 (83.3%) |
| 4 or 5 Rooms | 31 (20.3%) | 6 (16.7%) |
| 6 or 7 Rooms | 50 (32.7%) | 0 (0.0%) |
| 8 or more Rooms | 22 (14.4%) | 0 (0.0%) |
| Total | 153 (100.0%) | 36 (100.0%) |
Housing Structure by Heating Type in Snoqualmie Pass
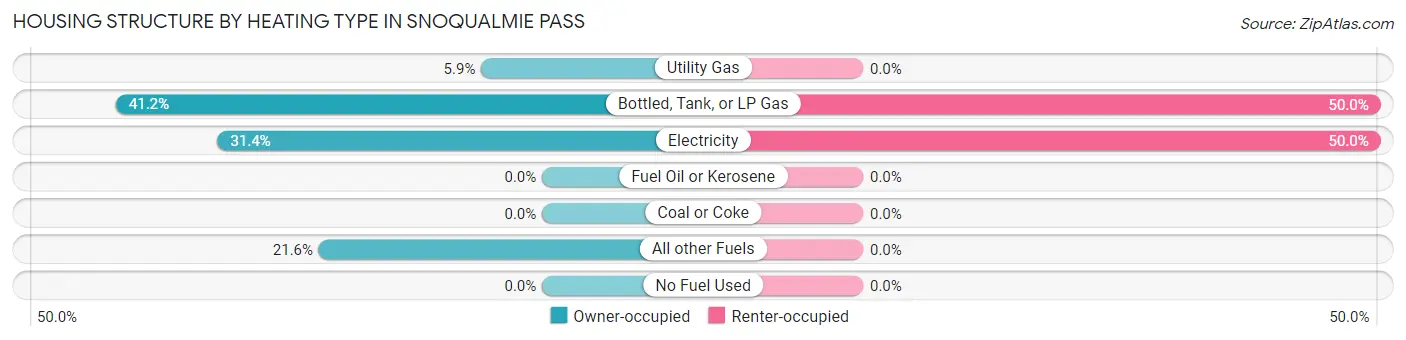
| Heating Type | Owner-occupied | Renter-occupied |
| Utility Gas | 9 (5.9%) | 0 (0.0%) |
| Bottled, Tank, or LP Gas | 63 (41.2%) | 18 (50.0%) |
| Electricity | 48 (31.4%) | 18 (50.0%) |
| Fuel Oil or Kerosene | 0 (0.0%) | 0 (0.0%) |
| Coal or Coke | 0 (0.0%) | 0 (0.0%) |
| All other Fuels | 33 (21.6%) | 0 (0.0%) |
| No Fuel Used | 0 (0.0%) | 0 (0.0%) |
| Total | 153 (100.0%) | 36 (100.0%) |
Household Vehicle Usage in Snoqualmie Pass
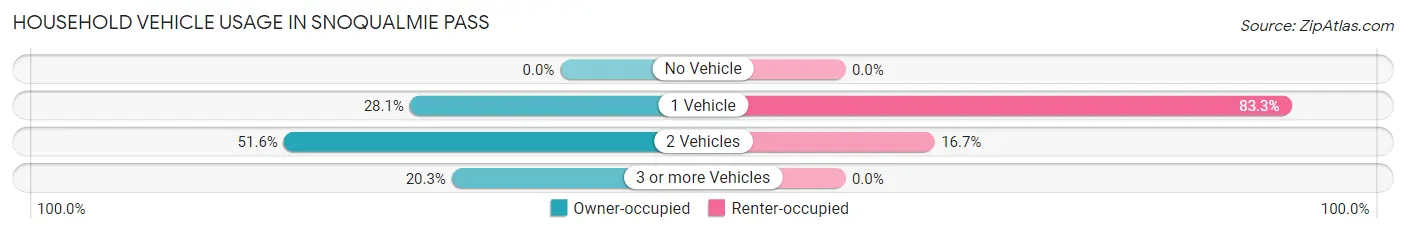
| Vehicles per Household | Owner-occupied | Renter-occupied |
| No Vehicle | 0 (0.0%) | 0 (0.0%) |
| 1 Vehicle | 43 (28.1%) | 30 (83.3%) |
| 2 Vehicles | 79 (51.6%) | 6 (16.7%) |
| 3 or more Vehicles | 31 (20.3%) | 0 (0.0%) |
| Total | 153 (100.0%) | 36 (100.0%) |
Real Estate & Mortgages in Snoqualmie Pass
Real Estate and Mortgage Overview in Snoqualmie Pass
| Characteristic | Without Mortgage | With Mortgage |
| Housing Units | 42 | 111 |
| Median Property Value | - | - |
| Median Household Income | $177,222 | $41 |
| Monthly Housing Costs | $840 | $26 |
| Real Estate Taxes | $4,400 | $0 |
Property Value by Mortgage Status in Snoqualmie Pass
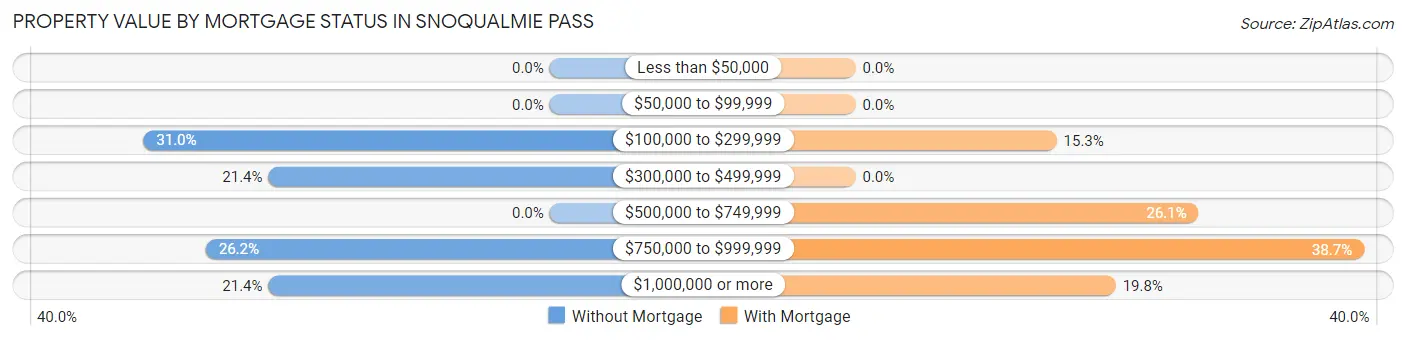
| Property Value | Without Mortgage | With Mortgage |
| Less than $50,000 | 0 (0.0%) | 0 (0.0%) |
| $50,000 to $99,999 | 0 (0.0%) | 0 (0.0%) |
| $100,000 to $299,999 | 13 (30.9%) | 17 (15.3%) |
| $300,000 to $499,999 | 9 (21.4%) | 0 (0.0%) |
| $500,000 to $749,999 | 0 (0.0%) | 29 (26.1%) |
| $750,000 to $999,999 | 11 (26.2%) | 43 (38.7%) |
| $1,000,000 or more | 9 (21.4%) | 22 (19.8%) |
| Total | 42 (100.0%) | 111 (100.0%) |
Household Income by Mortgage Status in Snoqualmie Pass
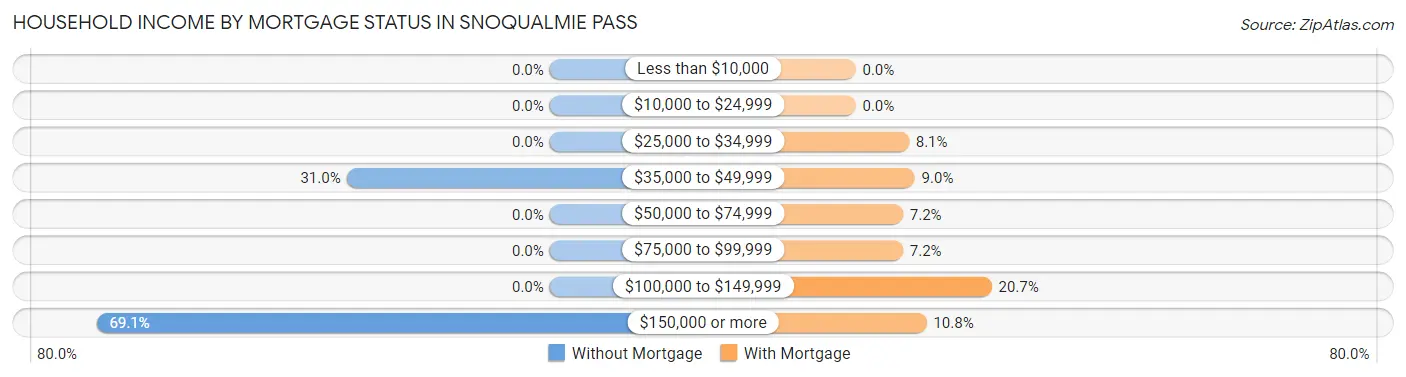
| Household Income | Without Mortgage | With Mortgage |
| Less than $10,000 | 0 (0.0%) | 0 (0.0%) |
| $10,000 to $24,999 | 0 (0.0%) | 0 (0.0%) |
| $25,000 to $34,999 | 0 (0.0%) | 9 (8.1%) |
| $35,000 to $49,999 | 13 (30.9%) | 10 (9.0%) |
| $50,000 to $74,999 | 0 (0.0%) | 8 (7.2%) |
| $75,000 to $99,999 | 0 (0.0%) | 8 (7.2%) |
| $100,000 to $149,999 | 0 (0.0%) | 23 (20.7%) |
| $150,000 or more | 29 (69.1%) | 12 (10.8%) |
| Total | 42 (100.0%) | 111 (100.0%) |
Property Value to Household Income Ratio in Snoqualmie Pass
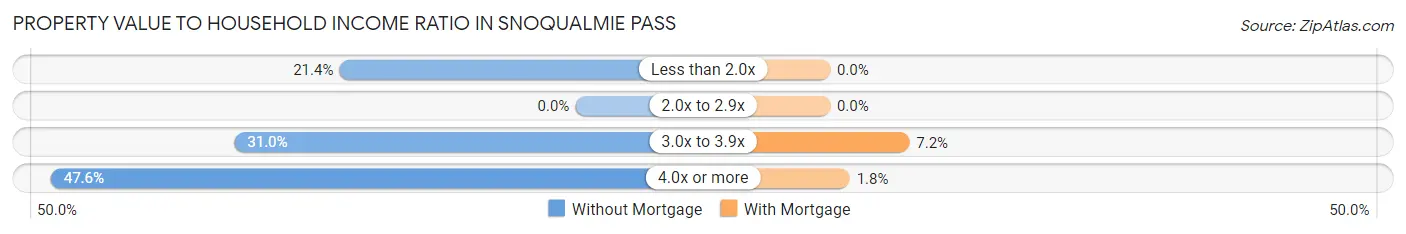
| Value-to-Income Ratio | Without Mortgage | With Mortgage |
| Less than 2.0x | 9 (21.4%) | 0 (0.0%) |
| 2.0x to 2.9x | 0 (0.0%) | 0 (0.0%) |
| 3.0x to 3.9x | 13 (30.9%) | 8 (7.2%) |
| 4.0x or more | 20 (47.6%) | 2 (1.8%) |
| Total | 42 (100.0%) | 111 (100.0%) |
Real Estate Taxes by Mortgage Status in Snoqualmie Pass
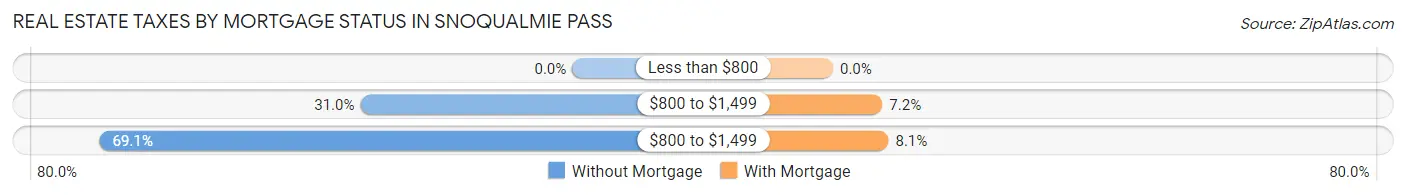
| Property Taxes | Without Mortgage | With Mortgage |
| Less than $800 | 0 (0.0%) | 0 (0.0%) |
| $800 to $1,499 | 13 (30.9%) | 8 (7.2%) |
| $800 to $1,499 | 29 (69.1%) | 9 (8.1%) |
| Total | 42 (100.0%) | 111 (100.0%) |
Health & Disability in Snoqualmie Pass
Health Insurance Coverage by Age in Snoqualmie Pass
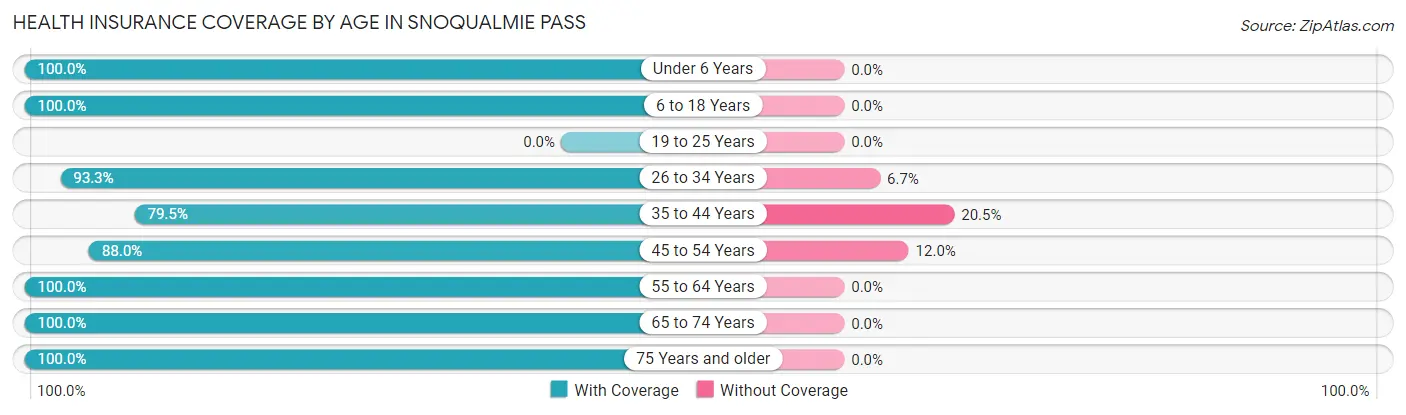
| Age Bracket | With Coverage | Without Coverage |
| Under 6 Years | 19 (100.0%) | 0 (0.0%) |
| 6 to 18 Years | 42 (100.0%) | 0 (0.0%) |
| 19 to 25 Years | 0 (0.0%) | 0 (0.0%) |
| 26 to 34 Years | 42 (93.3%) | 3 (6.7%) |
| 35 to 44 Years | 31 (79.5%) | 8 (20.5%) |
| 45 to 54 Years | 66 (88.0%) | 9 (12.0%) |
| 55 to 64 Years | 118 (100.0%) | 0 (0.0%) |
| 65 to 74 Years | 50 (100.0%) | 0 (0.0%) |
| 75 Years and older | 32 (100.0%) | 0 (0.0%) |
| Total | 400 (95.2%) | 20 (4.8%) |
Health Insurance Coverage by Citizenship Status in Snoqualmie Pass
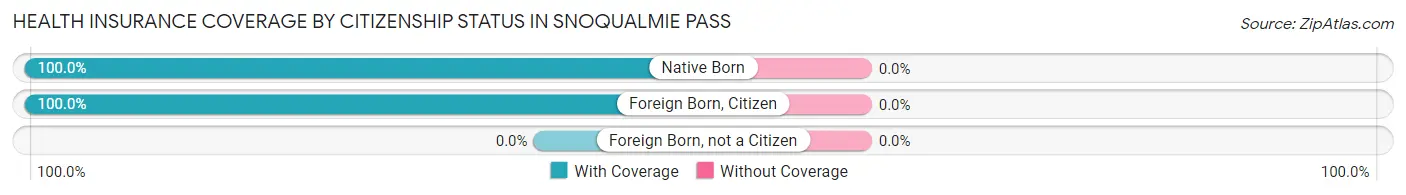
| Citizenship Status | With Coverage | Without Coverage |
| Native Born | 19 (100.0%) | 0 (0.0%) |
| Foreign Born, Citizen | 42 (100.0%) | 0 (0.0%) |
| Foreign Born, not a Citizen | 0 (0.0%) | 0 (0.0%) |
Health Insurance Coverage by Household Income in Snoqualmie Pass
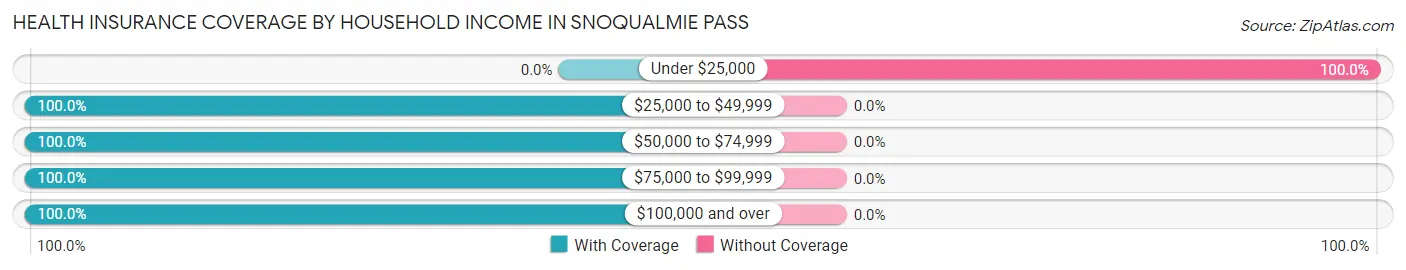
| Household Income | With Coverage | Without Coverage |
| Under $25,000 | 0 (0.0%) | 9 (100.0%) |
| $25,000 to $49,999 | 43 (100.0%) | 0 (0.0%) |
| $50,000 to $74,999 | 37 (100.0%) | 0 (0.0%) |
| $75,000 to $99,999 | 91 (100.0%) | 0 (0.0%) |
| $100,000 and over | 219 (100.0%) | 0 (0.0%) |
Public vs Private Health Insurance Coverage by Age in Snoqualmie Pass
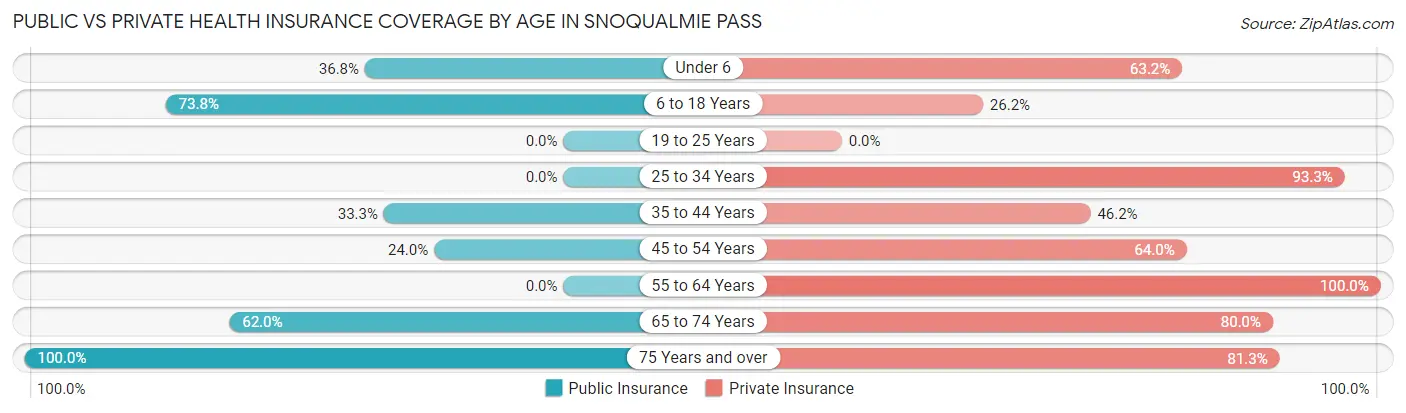
| Age Bracket | Public Insurance | Private Insurance |
| Under 6 | 7 (36.8%) | 12 (63.2%) |
| 6 to 18 Years | 31 (73.8%) | 11 (26.2%) |
| 19 to 25 Years | 0 (0.0%) | 0 (0.0%) |
| 25 to 34 Years | 0 (0.0%) | 42 (93.3%) |
| 35 to 44 Years | 13 (33.3%) | 18 (46.2%) |
| 45 to 54 Years | 18 (24.0%) | 48 (64.0%) |
| 55 to 64 Years | 0 (0.0%) | 118 (100.0%) |
| 65 to 74 Years | 31 (62.0%) | 40 (80.0%) |
| 75 Years and over | 32 (100.0%) | 26 (81.2%) |
| Total | 132 (31.4%) | 315 (75.0%) |
Disability Status by Sex by Age in Snoqualmie Pass
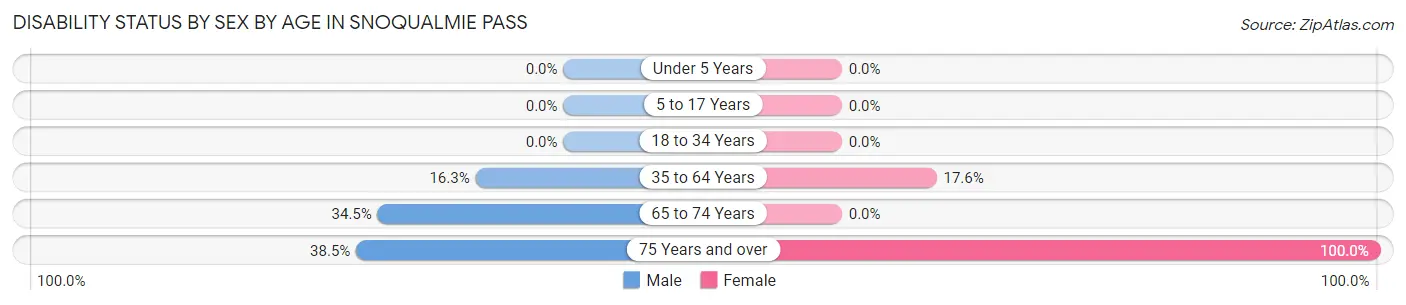
| Age Bracket | Male | Female |
| Under 5 Years | 0 (0.0%) | 0 (0.0%) |
| 5 to 17 Years | 0 (0.0%) | 0 (0.0%) |
| 18 to 34 Years | 0 (0.0%) | 0 (0.0%) |
| 35 to 64 Years | 23 (16.3%) | 16 (17.6%) |
| 65 to 74 Years | 10 (34.5%) | 0 (0.0%) |
| 75 Years and over | 5 (38.5%) | 19 (100.0%) |
Disability Class by Sex by Age in Snoqualmie Pass
Disability Class: Hearing Difficulty
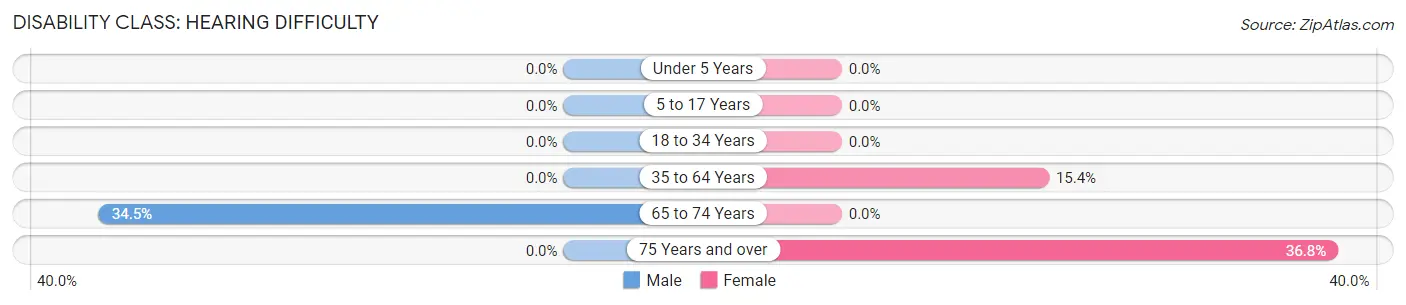
| Age Bracket | Male | Female |
| Under 5 Years | 0 (0.0%) | 0 (0.0%) |
| 5 to 17 Years | 0 (0.0%) | 0 (0.0%) |
| 18 to 34 Years | 0 (0.0%) | 0 (0.0%) |
| 35 to 64 Years | 0 (0.0%) | 14 (15.4%) |
| 65 to 74 Years | 10 (34.5%) | 0 (0.0%) |
| 75 Years and over | 0 (0.0%) | 7 (36.8%) |
Disability Class: Vision Difficulty

| Age Bracket | Male | Female |
| Under 5 Years | 0 (0.0%) | 0 (0.0%) |
| 5 to 17 Years | 0 (0.0%) | 0 (0.0%) |
| 18 to 34 Years | 0 (0.0%) | 0 (0.0%) |
| 35 to 64 Years | 19 (13.5%) | 0 (0.0%) |
| 65 to 74 Years | 0 (0.0%) | 0 (0.0%) |
| 75 Years and over | 5 (38.5%) | 0 (0.0%) |
Disability Class: Cognitive Difficulty
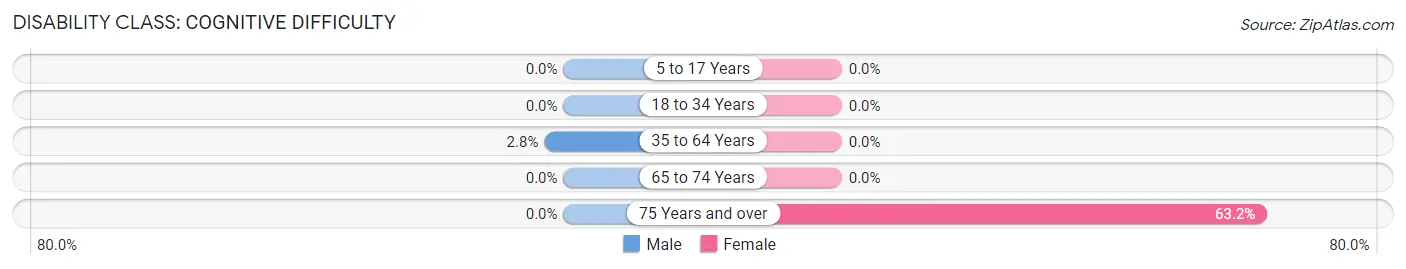
| Age Bracket | Male | Female |
| 5 to 17 Years | 0 (0.0%) | 0 (0.0%) |
| 18 to 34 Years | 0 (0.0%) | 0 (0.0%) |
| 35 to 64 Years | 4 (2.8%) | 0 (0.0%) |
| 65 to 74 Years | 0 (0.0%) | 0 (0.0%) |
| 75 Years and over | 0 (0.0%) | 12 (63.2%) |
Disability Class: Ambulatory Difficulty
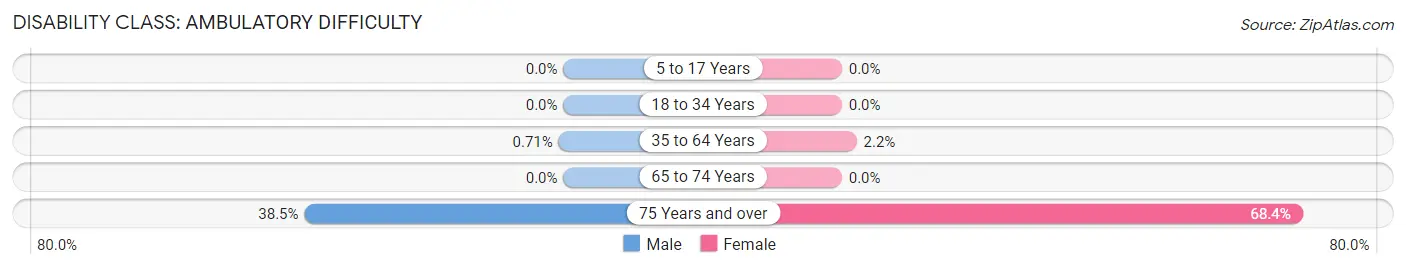
| Age Bracket | Male | Female |
| 5 to 17 Years | 0 (0.0%) | 0 (0.0%) |
| 18 to 34 Years | 0 (0.0%) | 0 (0.0%) |
| 35 to 64 Years | 1 (0.7%) | 2 (2.2%) |
| 65 to 74 Years | 0 (0.0%) | 0 (0.0%) |
| 75 Years and over | 5 (38.5%) | 13 (68.4%) |
Disability Class: Self-Care Difficulty
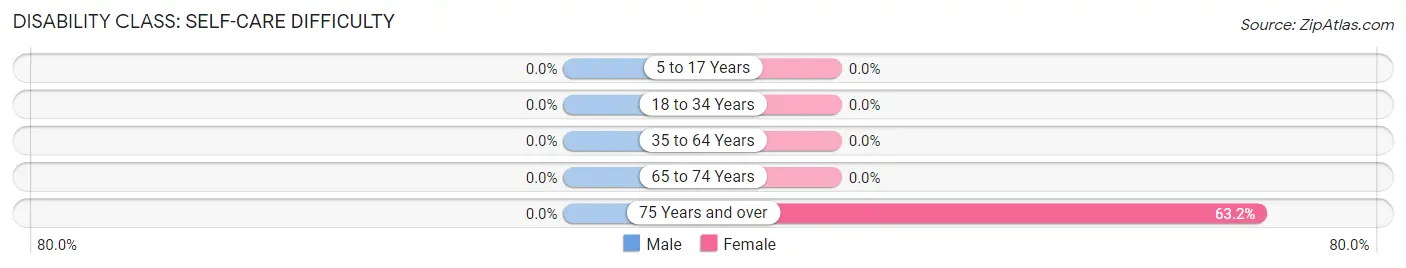
| Age Bracket | Male | Female |
| 5 to 17 Years | 0 (0.0%) | 0 (0.0%) |
| 18 to 34 Years | 0 (0.0%) | 0 (0.0%) |
| 35 to 64 Years | 0 (0.0%) | 0 (0.0%) |
| 65 to 74 Years | 0 (0.0%) | 0 (0.0%) |
| 75 Years and over | 0 (0.0%) | 12 (63.2%) |
Technology Access in Snoqualmie Pass
Computing Device Access in Snoqualmie Pass
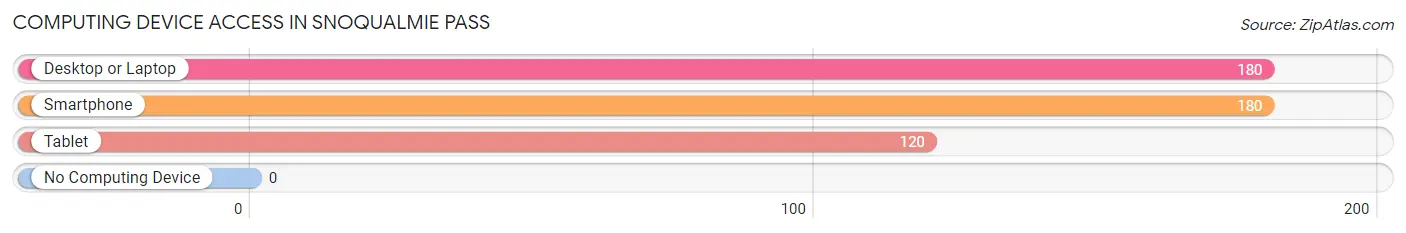
| Device Type | # Households | % Households |
| Desktop or Laptop | 180 | 95.2% |
| Smartphone | 180 | 95.2% |
| Tablet | 120 | 63.5% |
| No Computing Device | 0 | 0.0% |
| Total | 189 | 100.0% |
Internet Access in Snoqualmie Pass
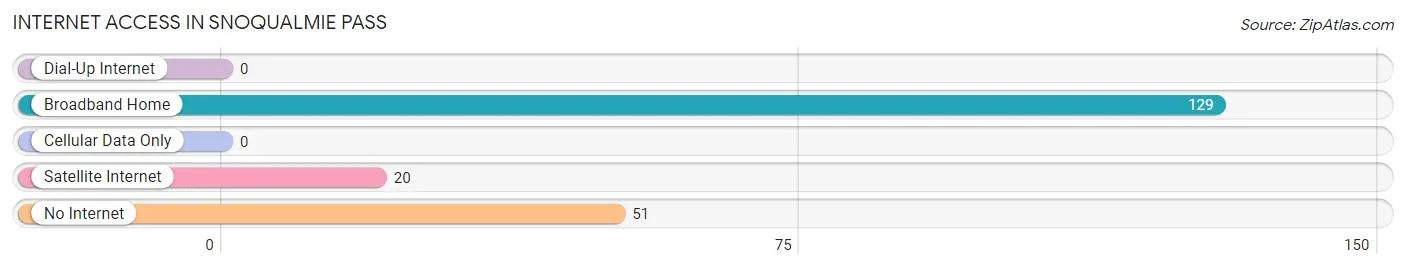
| Internet Type | # Households | % Households |
| Dial-Up Internet | 0 | 0.0% |
| Broadband Home | 129 | 68.2% |
| Cellular Data Only | 0 | 0.0% |
| Satellite Internet | 20 | 10.6% |
| No Internet | 51 | 27.0% |
| Total | 189 | 100.0% |
Snoqualmie Pass Summary
Snoqualmie Pass is a mountain pass located in the Cascade Mountains of Washington State, approximately 50 miles east of Seattle. It is the most direct route between Seattle and the eastern part of the state, and is a major transportation corridor for both freight and passenger traffic. The pass is also a popular destination for outdoor recreation, including skiing, snowboarding, hiking, and camping.
History
The Snoqualmie Pass area has been inhabited by Native American tribes for thousands of years. The Snoqualmie people, for whom the pass is named, were the most prominent tribe in the area. The Snoqualmie people used the pass as a trade route between the Puget Sound and the Columbia River.
The first recorded European exploration of the area was in 1853, when Lieutenant George B. McClellan of the U.S. Army Corps of Engineers surveyed the pass. In the late 1800s, the Northern Pacific Railroad began construction of a railway line through the pass, which was completed in 1893. The railway line was a major factor in the development of the region, as it allowed for the transportation of goods and people between Seattle and the eastern part of the state.
In the early 1900s, the area around Snoqualmie Pass became a popular destination for outdoor recreation. The first ski area in the area, the Snoqualmie Summit Ski Area, opened in 1937. The area has since become a major ski destination, with several ski resorts located in the vicinity.
Geography
Snoqualmie Pass is located in the Cascade Mountains of Washington State, approximately 50 miles east of Seattle. The pass is situated at an elevation of 3,022 feet, and is the lowest point in the Cascade Range. The pass is located at the intersection of Interstate 90 and State Route 18.
The pass is surrounded by the Snoqualmie National Forest, which covers an area of 1.3 million acres. The forest is home to a variety of wildlife, including black bears, cougars, elk, and deer. The forest is also home to several species of trees, including Douglas fir, western hemlock, western red cedar, and western white pine.
Economy
Snoqualmie Pass is a major transportation corridor for both freight and passenger traffic. The pass is served by Interstate 90, which is the main east-west highway in the state. The pass is also served by the Northern Pacific Railway, which runs through the pass and connects Seattle to the eastern part of the state.
The pass is also a major destination for outdoor recreation. The area is home to several ski resorts, including the Summit at Snoqualmie, Alpental, and Hyak. The resorts offer a variety of activities, including skiing, snowboarding, tubing, and snowshoeing. The area is also popular for hiking, camping, and fishing.
Demographics
As of the 2010 census, the population of Snoqualmie Pass was 1,717. The population is predominantly white (93.3%), with small percentages of other races, including Asian (2.2%), African American (1.2%), and Native American (0.7%). The median household income in the area is $63,917, and the median home value is $360,000. The unemployment rate in the area is 4.2%.
Common Questions
What is Per Capita Income in Snoqualmie Pass?
Per Capita income in Snoqualmie Pass is $62,398.
What is the Median Family Income in Snoqualmie Pass?
Median Family Income in Snoqualmie Pass is $176,806.
What is the Median Household income in Snoqualmie Pass?
Median Household Income in Snoqualmie Pass is $80,875.
What is Inequality or Gini Index in Snoqualmie Pass?
Inequality or Gini Index in Snoqualmie Pass is 0.42.
What is the Total Population of Snoqualmie Pass?
Total Population of Snoqualmie Pass is 420.
What is the Total Male Population of Snoqualmie Pass?
Total Male Population of Snoqualmie Pass is 232.
What is the Total Female Population of Snoqualmie Pass?
Total Female Population of Snoqualmie Pass is 188.
What is the Ratio of Males per 100 Females in Snoqualmie Pass?
There are 123.40 Males per 100 Females in Snoqualmie Pass.
What is the Ratio of Females per 100 Males in Snoqualmie Pass?
There are 81.03 Females per 100 Males in Snoqualmie Pass.
What is the Median Population Age in Snoqualmie Pass?
Median Population Age in Snoqualmie Pass is 50.7 Years.
What is the Average Family Size in Snoqualmie Pass
Average Family Size in Snoqualmie Pass is 3.0 People.
What is the Average Household Size in Snoqualmie Pass
Average Household Size in Snoqualmie Pass is 2.1 People.
How Large is the Labor Force in Snoqualmie Pass?
There are 230 People in the Labor Forcein in Snoqualmie Pass.
What is the Percentage of People in the Labor Force in Snoqualmie Pass?
64.1% of People are in the Labor Force in Snoqualmie Pass.
What is the Unemployment Rate in Snoqualmie Pass?
Unemployment Rate in Snoqualmie Pass is 3.9%.