Wollochet, WA Map & Demographics
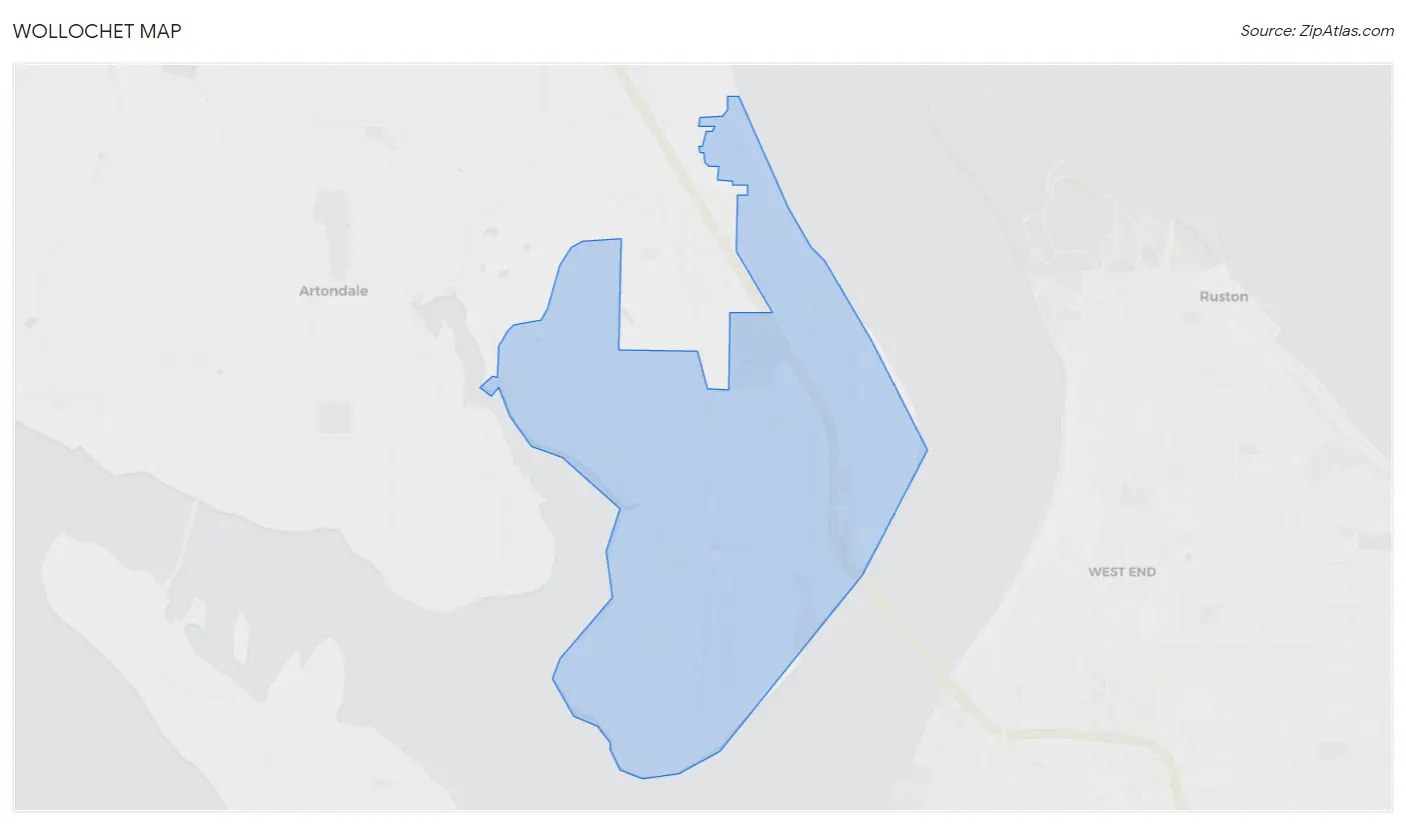
Wollochet Map
Wollochet Overview
$65,602
PER CAPITA INCOME
$152,421
AVG FAMILY INCOME
$132,069
AVG HOUSEHOLD INCOME
55.7%
WAGE / INCOME GAP [ % ]
44.3¢/ $1
WAGE / INCOME GAP [ $ ]
0.40
INEQUALITY / GINI INDEX
7,276
TOTAL POPULATION
3,520
MALE POPULATION
3,756
FEMALE POPULATION
93.72
MALES / 100 FEMALES
106.70
FEMALES / 100 MALES
48.3
MEDIAN AGE
2.9
AVG FAMILY SIZE
2.6
AVG HOUSEHOLD SIZE
3,908
LABOR FORCE [ PEOPLE ]
66.9%
PERCENT IN LABOR FORCE
1.9%
UNEMPLOYMENT RATE
Income in Wollochet
Income Overview in Wollochet
Per Capita Income in Wollochet is $65,602, while median incomes of families and households are $152,421 and $132,069 respectively.
| Characteristic | Number | Measure |
| Per Capita Income | 7,276 | $65,602 |
| Median Family Income | 2,214 | $152,421 |
| Mean Family Income | 2,214 | $195,420 |
| Median Household Income | 2,804 | $132,069 |
| Mean Household Income | 2,804 | $169,858 |
| Income Deficit | 2,214 | $0 |
| Wage / Income Gap (%) | 7,276 | 55.74% |
| Wage / Income Gap ($) | 7,276 | 44.26¢ per $1 |
| Gini / Inequality Index | 7,276 | 0.40 |
Earnings by Sex in Wollochet
Average Earnings in Wollochet are $54,254, $81,611 for men and $36,119 for women, a difference of 55.7%.
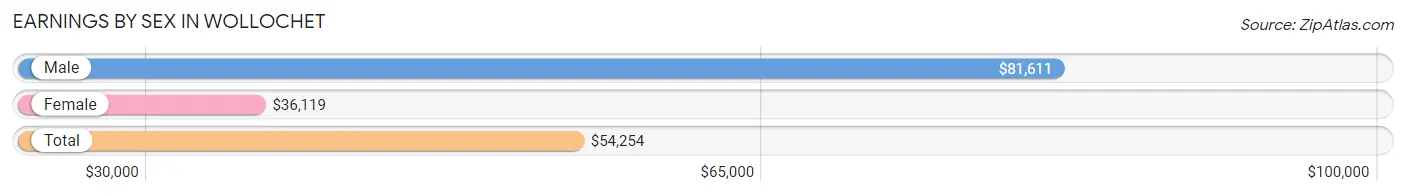
| Sex | Number | Average Earnings |
| Male | 2,070 (50.3%) | $81,611 |
| Female | 2,046 (49.7%) | $36,119 |
| Total | 4,116 (100.0%) | $54,254 |
Earnings by Sex by Income Bracket in Wollochet
The most common earnings brackets in Wollochet are $100,000+ for men (889 | 42.9%) and $100,000+ for women (381 | 18.6%).
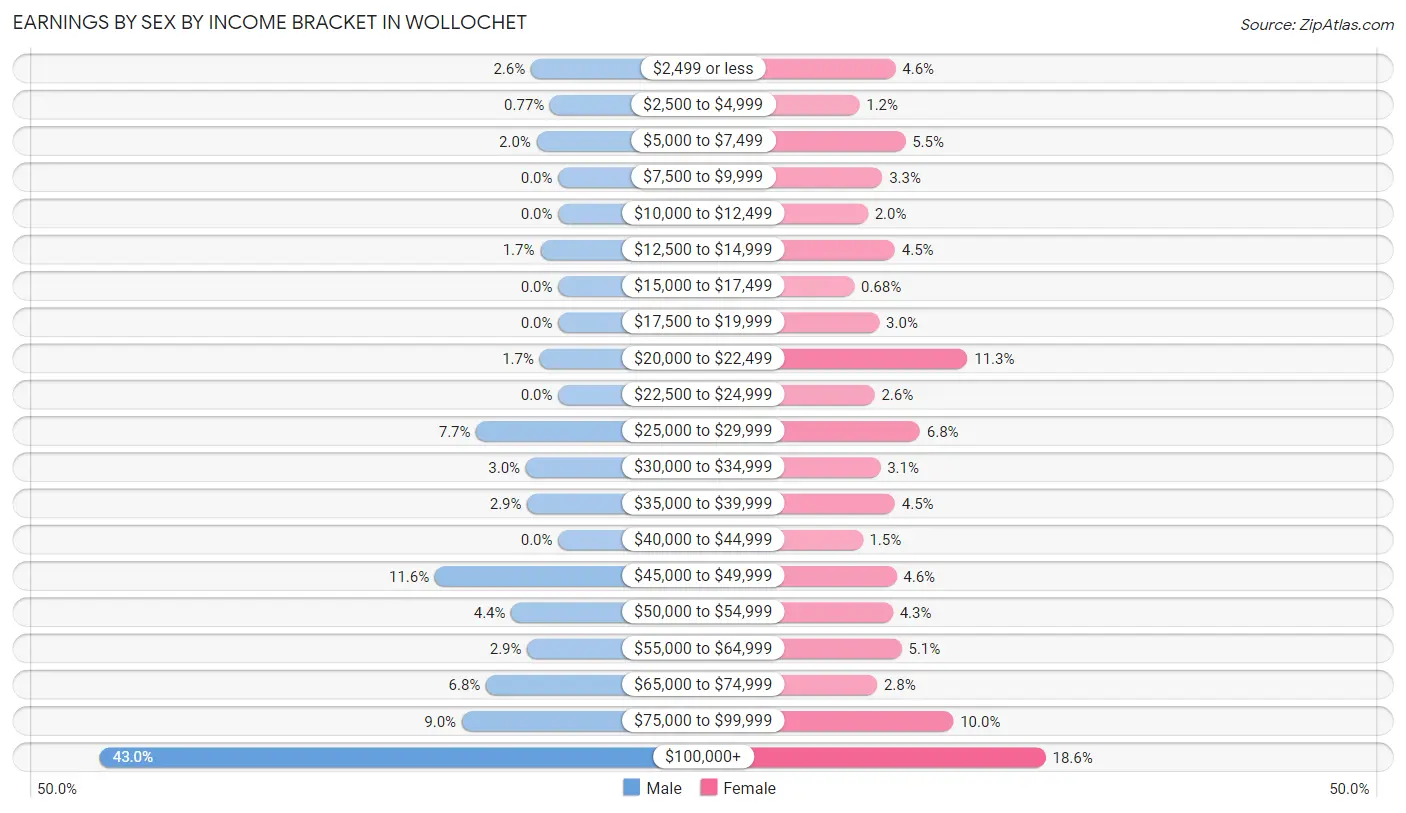
| Income | Male | Female |
| $2,499 or less | 53 (2.6%) | 93 (4.5%) |
| $2,500 to $4,999 | 16 (0.8%) | 24 (1.2%) |
| $5,000 to $7,499 | 42 (2.0%) | 112 (5.5%) |
| $7,500 to $9,999 | 0 (0.0%) | 68 (3.3%) |
| $10,000 to $12,499 | 0 (0.0%) | 40 (2.0%) |
| $12,500 to $14,999 | 35 (1.7%) | 92 (4.5%) |
| $15,000 to $17,499 | 0 (0.0%) | 14 (0.7%) |
| $17,500 to $19,999 | 0 (0.0%) | 62 (3.0%) |
| $20,000 to $22,499 | 36 (1.7%) | 231 (11.3%) |
| $22,500 to $24,999 | 0 (0.0%) | 53 (2.6%) |
| $25,000 to $29,999 | 159 (7.7%) | 140 (6.8%) |
| $30,000 to $34,999 | 63 (3.0%) | 64 (3.1%) |
| $35,000 to $39,999 | 60 (2.9%) | 92 (4.5%) |
| $40,000 to $44,999 | 0 (0.0%) | 30 (1.5%) |
| $45,000 to $49,999 | 239 (11.6%) | 95 (4.6%) |
| $50,000 to $54,999 | 91 (4.4%) | 88 (4.3%) |
| $55,000 to $64,999 | 60 (2.9%) | 105 (5.1%) |
| $65,000 to $74,999 | 140 (6.8%) | 58 (2.8%) |
| $75,000 to $99,999 | 187 (9.0%) | 204 (10.0%) |
| $100,000+ | 889 (42.9%) | 381 (18.6%) |
| Total | 2,070 (100.0%) | 2,046 (100.0%) |
Earnings by Sex by Educational Attainment in Wollochet
Average earnings in Wollochet are $96,225 for men and $42,596 for women, a difference of 55.7%. Men with an educational attainment of graduate degree enjoy the highest average annual earnings of $122,652, while those with college or associate's degree education earn the least with $45,288. Women with an educational attainment of graduate degree earn the most with the average annual earnings of $120,144, while those with college or associate's degree education have the smallest earnings of $25,198.
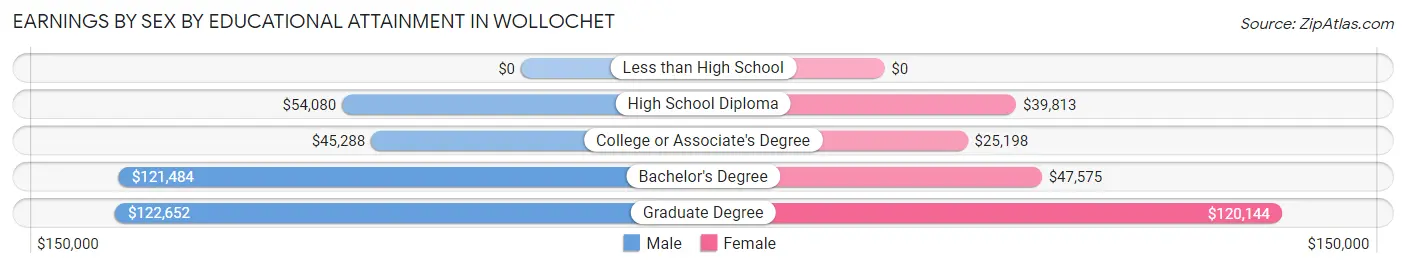
| Educational Attainment | Male Income | Female Income |
| Less than High School | - | - |
| High School Diploma | $54,080 | $39,813 |
| College or Associate's Degree | $45,288 | $25,198 |
| Bachelor's Degree | $121,484 | $47,575 |
| Graduate Degree | $122,652 | $120,144 |
| Total | $96,225 | $42,596 |
Family Income in Wollochet
Family Income Brackets in Wollochet
According to the Wollochet family income data, there are 790 families falling into the $200,000+ income range, which is the most common income bracket and makes up 35.7% of all families.
| Income Bracket | # Families | % Families |
| Less than $10,000 | 0 | 0.0% |
| $10,000 to $14,999 | 0 | 0.0% |
| $15,000 to $24,999 | 0 | 0.0% |
| $25,000 to $34,999 | 15 | 0.7% |
| $35,000 to $49,999 | 80 | 3.6% |
| $50,000 to $74,999 | 190 | 8.6% |
| $75,000 to $99,999 | 232 | 10.5% |
| $100,000 to $149,999 | 527 | 23.8% |
| $150,000 to $199,999 | 376 | 17.0% |
| $200,000+ | 790 | 35.7% |
Family Income by Famaliy Size in Wollochet
5-person families (76 | 3.4%) account for the highest median family income in Wollochet with $250,001 per family, while 2-person families (939 | 42.4%) have the highest median income of $77,476 per family member.
| Income Bracket | # Families | Median Income |
| 2-Person Families | 939 (42.4%) | $154,952 |
| 3-Person Families | 645 (29.1%) | $110,547 |
| 4-Person Families | 512 (23.1%) | $239,356 |
| 5-Person Families | 76 (3.4%) | $250,001 |
| 6-Person Families | 42 (1.9%) | $0 |
| 7+ Person Families | 0 (0.0%) | $0 |
| Total | 2,214 (100.0%) | $152,421 |
Family Income by Number of Earners in Wollochet
The median family income in Wollochet is $152,421, with families comprising 2 earners (1,083) having the highest median family income of $180,811, while families with no earners (312) have the lowest median family income of $106,000, accounting for 48.9% and 14.1% of families, respectively.
| Number of Earners | # Families | Median Income |
| No Earners | 312 (14.1%) | $106,000 |
| 1 Earner | 437 (19.7%) | $148,641 |
| 2 Earners | 1,083 (48.9%) | $180,811 |
| 3+ Earners | 382 (17.2%) | $114,636 |
| Total | 2,214 (100.0%) | $152,421 |
Household Income in Wollochet
Household Income Brackets in Wollochet
With 813 households falling in the category, the $200,000+ income range is the most frequent in Wollochet, accounting for 29.0% of all households. In contrast, only 14 households (0.5%) fall into the $10,000 to $14,999 income bracket, making it the least populous group.
| Income Bracket | # Households | % Households |
| Less than $10,000 | 59 | 2.1% |
| $10,000 to $14,999 | 14 | 0.5% |
| $15,000 to $24,999 | 48 | 1.7% |
| $25,000 to $34,999 | 62 | 2.2% |
| $35,000 to $49,999 | 168 | 6.0% |
| $50,000 to $74,999 | 283 | 10.1% |
| $75,000 to $99,999 | 348 | 12.4% |
| $100,000 to $149,999 | 589 | 21.0% |
| $150,000 to $199,999 | 418 | 14.9% |
| $200,000+ | 813 | 29.0% |
Household Income by Householder Age in Wollochet
The median household income in Wollochet is $132,069, with the highest median household income of $186,161 found in the 25 to 44 years age bracket for the primary householder. A total of 667 households (23.8%) fall into this category. Meanwhile, the 15 to 24 years age bracket for the primary householder has the lowest median household income of $0, with 61 households (2.2%) in this group.
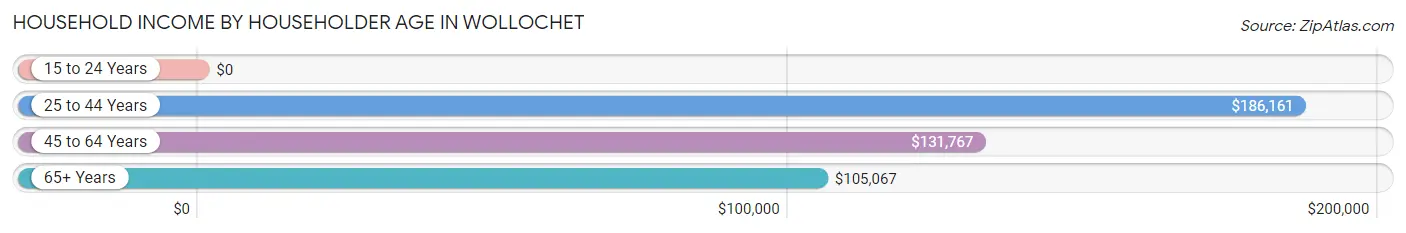
| Income Bracket | # Households | Median Income |
| 15 to 24 Years | 61 (2.2%) | $0 |
| 25 to 44 Years | 667 (23.8%) | $186,161 |
| 45 to 64 Years | 1,197 (42.7%) | $131,767 |
| 65+ Years | 879 (31.4%) | $105,067 |
| Total | 2,804 (100.0%) | $132,069 |
Poverty in Wollochet
Income Below Poverty by Sex and Age in Wollochet
With 0.9% poverty level for males and 1.8% for females among the residents of Wollochet, 75 year old and over males and 75 year old and over females are the most vulnerable to poverty, with 18 males (7.0%) and 40 females (10.3%) in their respective age groups living below the poverty level.
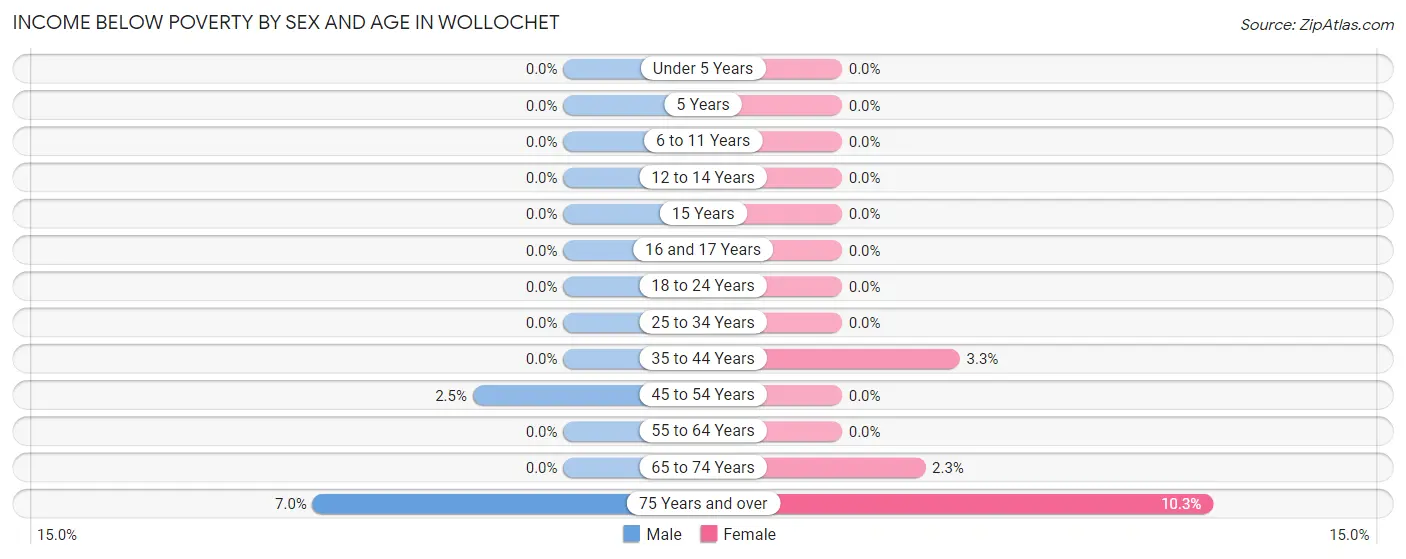
| Age Bracket | Male | Female |
| Under 5 Years | 0 (0.0%) | 0 (0.0%) |
| 5 Years | 0 (0.0%) | 0 (0.0%) |
| 6 to 11 Years | 0 (0.0%) | 0 (0.0%) |
| 12 to 14 Years | 0 (0.0%) | 0 (0.0%) |
| 15 Years | 0 (0.0%) | 0 (0.0%) |
| 16 and 17 Years | 0 (0.0%) | 0 (0.0%) |
| 18 to 24 Years | 0 (0.0%) | 0 (0.0%) |
| 25 to 34 Years | 0 (0.0%) | 0 (0.0%) |
| 35 to 44 Years | 0 (0.0%) | 12 (3.3%) |
| 45 to 54 Years | 12 (2.5%) | 0 (0.0%) |
| 55 to 64 Years | 0 (0.0%) | 0 (0.0%) |
| 65 to 74 Years | 0 (0.0%) | 16 (2.3%) |
| 75 Years and over | 18 (7.0%) | 40 (10.3%) |
| Total | 30 (0.9%) | 68 (1.8%) |
Income Above Poverty by Sex and Age in Wollochet
According to the poverty statistics in Wollochet, males aged under 5 years and females aged under 5 years are the age groups that are most secure financially, with 100.0% of males and 100.0% of females in these age groups living above the poverty line.
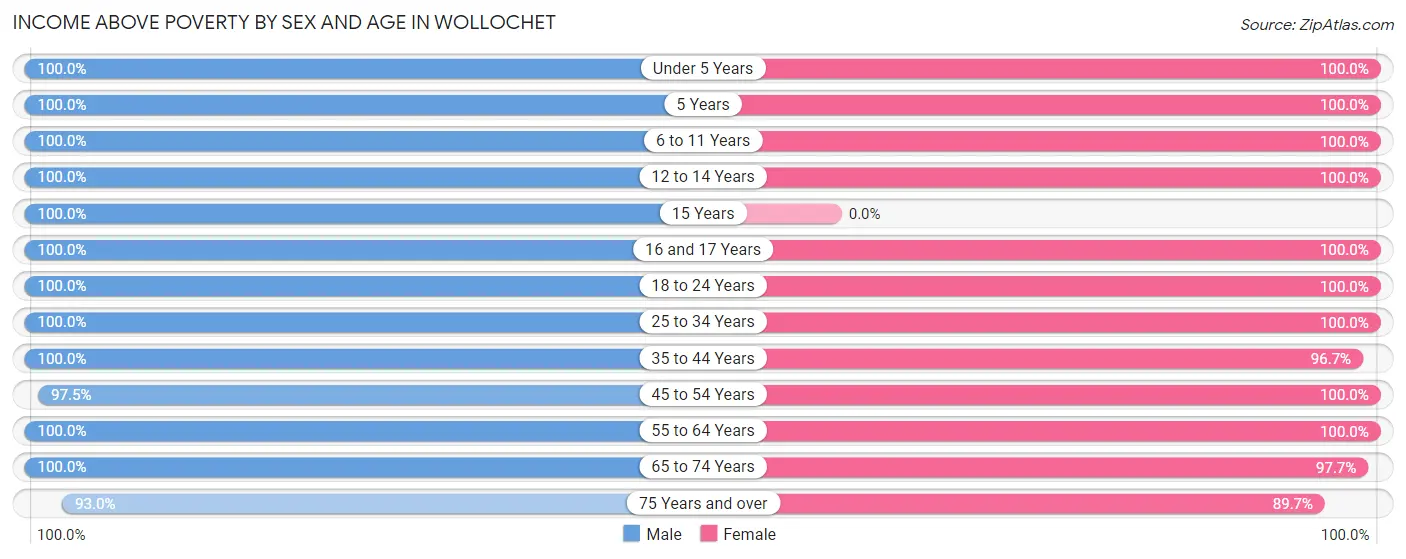
| Age Bracket | Male | Female |
| Under 5 Years | 286 (100.0%) | 188 (100.0%) |
| 5 Years | 91 (100.0%) | 44 (100.0%) |
| 6 to 11 Years | 285 (100.0%) | 163 (100.0%) |
| 12 to 14 Years | 26 (100.0%) | 197 (100.0%) |
| 15 Years | 154 (100.0%) | 0 (0.0%) |
| 16 and 17 Years | 28 (100.0%) | 93 (100.0%) |
| 18 to 24 Years | 157 (100.0%) | 251 (100.0%) |
| 25 to 34 Years | 399 (100.0%) | 362 (100.0%) |
| 35 to 44 Years | 363 (100.0%) | 354 (96.7%) |
| 45 to 54 Years | 465 (97.5%) | 527 (100.0%) |
| 55 to 64 Years | 621 (100.0%) | 403 (100.0%) |
| 65 to 74 Years | 355 (100.0%) | 674 (97.7%) |
| 75 Years and over | 240 (93.0%) | 347 (89.7%) |
| Total | 3,470 (99.1%) | 3,603 (98.2%) |
Income Below Poverty Among Married-Couple Families in Wollochet
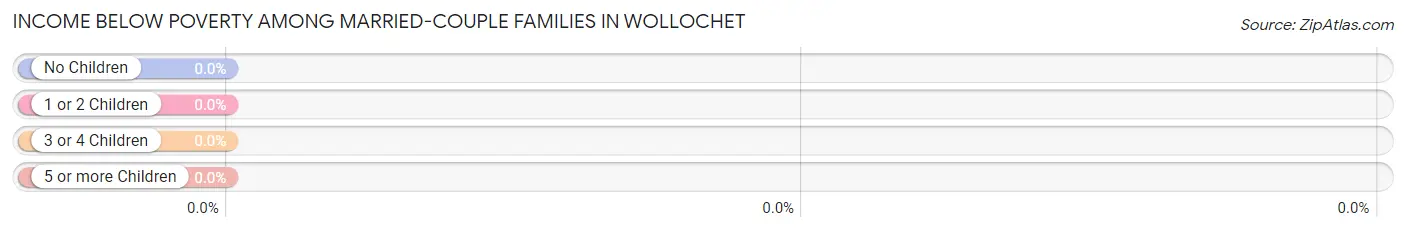
| Children | Above Poverty | Below Poverty |
| No Children | 1,290 (100.0%) | 0 (0.0%) |
| 1 or 2 Children | 676 (100.0%) | 0 (0.0%) |
| 3 or 4 Children | 100 (100.0%) | 0 (0.0%) |
| 5 or more Children | 0 (0.0%) | 0 (0.0%) |
| Total | 2,066 (100.0%) | 0 (0.0%) |
Income Below Poverty Among Single-Parent Households in Wollochet
| Children | Single Father | Single Mother |
| No Children | 0 (0.0%) | 0 (0.0%) |
| 1 or 2 Children | 0 (0.0%) | 0 (0.0%) |
| 3 or 4 Children | 0 (0.0%) | 0 (0.0%) |
| 5 or more Children | 0 (0.0%) | 0 (0.0%) |
| Total | 0 (0.0%) | 0 (0.0%) |
Income Below Poverty Among Married-Couple vs Single-Parent Households in Wollochet
| Children | Married-Couple Families | Single-Parent Households |
| No Children | 0 (0.0%) | 0 (0.0%) |
| 1 or 2 Children | 0 (0.0%) | 0 (0.0%) |
| 3 or 4 Children | 0 (0.0%) | 0 (0.0%) |
| 5 or more Children | 0 (0.0%) | 0 (0.0%) |
| Total | 0 (0.0%) | 0 (0.0%) |
Race in Wollochet
The most populous races in Wollochet are White / Caucasian (6,066 | 83.4%), Two or more Races (672 | 9.2%), and Hispanic or Latino (391 | 5.4%).
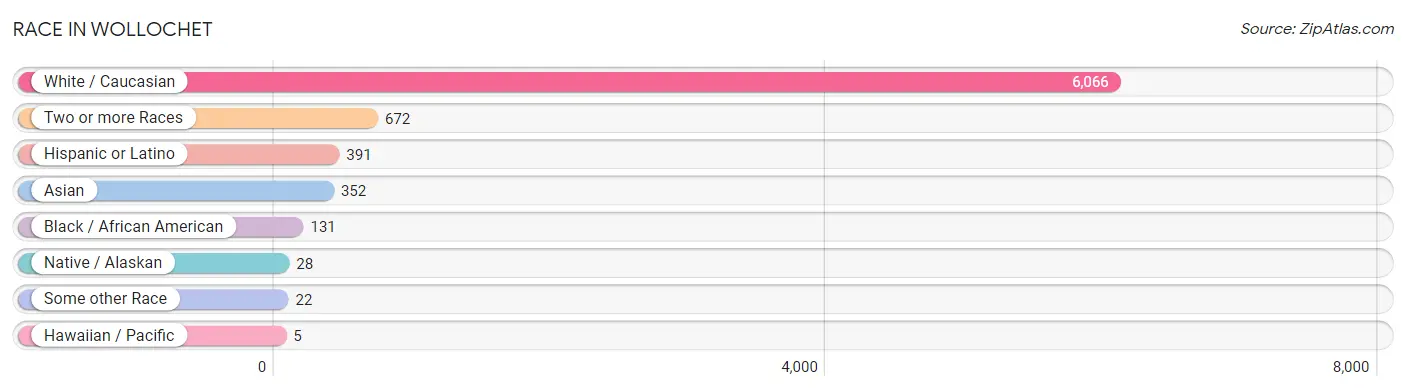
| Race | # Population | % Population |
| Asian | 352 | 4.8% |
| Black / African American | 131 | 1.8% |
| Hawaiian / Pacific | 5 | 0.1% |
| Hispanic or Latino | 391 | 5.4% |
| Native / Alaskan | 28 | 0.4% |
| White / Caucasian | 6,066 | 83.4% |
| Two or more Races | 672 | 9.2% |
| Some other Race | 22 | 0.3% |
| Total | 7,276 | 100.0% |
Ancestry in Wollochet
The most populous ancestries reported in Wollochet are English (1,138 | 15.6%), Norwegian (787 | 10.8%), German (665 | 9.1%), Irish (632 | 8.7%), and European (451 | 6.2%), together accounting for 50.5% of all Wollochet residents.
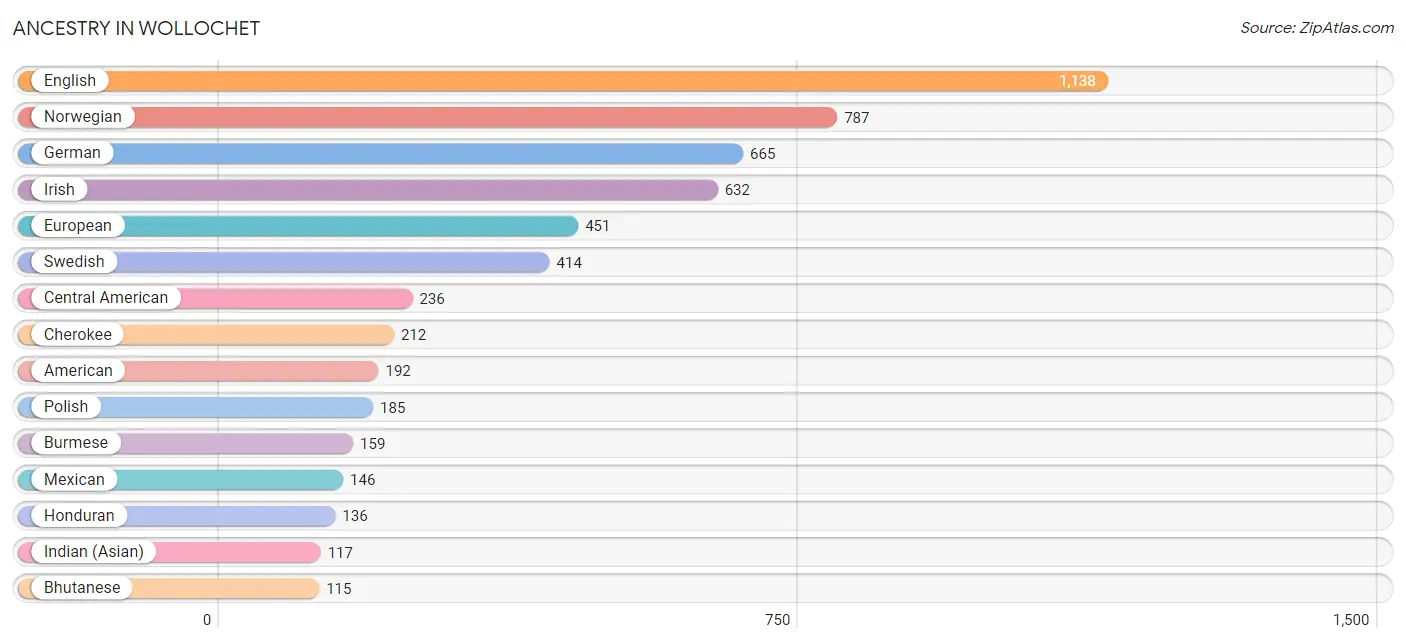
| Ancestry | # Population | % Population |
| African | 47 | 0.6% |
| American | 192 | 2.6% |
| Austrian | 21 | 0.3% |
| Bhutanese | 115 | 1.6% |
| Blackfeet | 17 | 0.2% |
| British | 57 | 0.8% |
| Burmese | 159 | 2.2% |
| Cajun | 72 | 1.0% |
| Canadian | 48 | 0.7% |
| Central American | 236 | 3.2% |
| Cherokee | 212 | 2.9% |
| Croatian | 100 | 1.4% |
| Cuban | 9 | 0.1% |
| Czech | 15 | 0.2% |
| Danish | 30 | 0.4% |
| Dutch | 14 | 0.2% |
| Eastern European | 22 | 0.3% |
| English | 1,138 | 15.6% |
| European | 451 | 6.2% |
| Finnish | 13 | 0.2% |
| French | 107 | 1.5% |
| French Canadian | 79 | 1.1% |
| German | 665 | 9.1% |
| German Russian | 12 | 0.2% |
| Greek | 25 | 0.3% |
| Honduran | 136 | 1.9% |
| Hungarian | 16 | 0.2% |
| Indian (Asian) | 117 | 1.6% |
| Irish | 632 | 8.7% |
| Italian | 102 | 1.4% |
| Japanese | 52 | 0.7% |
| Korean | 79 | 1.1% |
| Latvian | 14 | 0.2% |
| Mexican | 146 | 2.0% |
| Native Hawaiian | 62 | 0.9% |
| Navajo | 12 | 0.2% |
| Northern European | 52 | 0.7% |
| Norwegian | 787 | 10.8% |
| Polish | 185 | 2.5% |
| Salvadoran | 100 | 1.4% |
| Scandinavian | 31 | 0.4% |
| Scotch-Irish | 88 | 1.2% |
| Scottish | 51 | 0.7% |
| Slovak | 14 | 0.2% |
| Sri Lankan | 2 | 0.0% |
| Subsaharan African | 47 | 0.6% |
| Swedish | 414 | 5.7% |
| Thai | 36 | 0.5% |
| Welsh | 43 | 0.6% | View All 49 Rows |
Immigrants in Wollochet
The most numerous immigrant groups reported in Wollochet came from Asia (206 | 2.8%), Eastern Asia (202 | 2.8%), China (117 | 1.6%), Korea (70 | 1.0%), and Europe (53 | 0.7%), together accounting for 8.9% of all Wollochet residents.
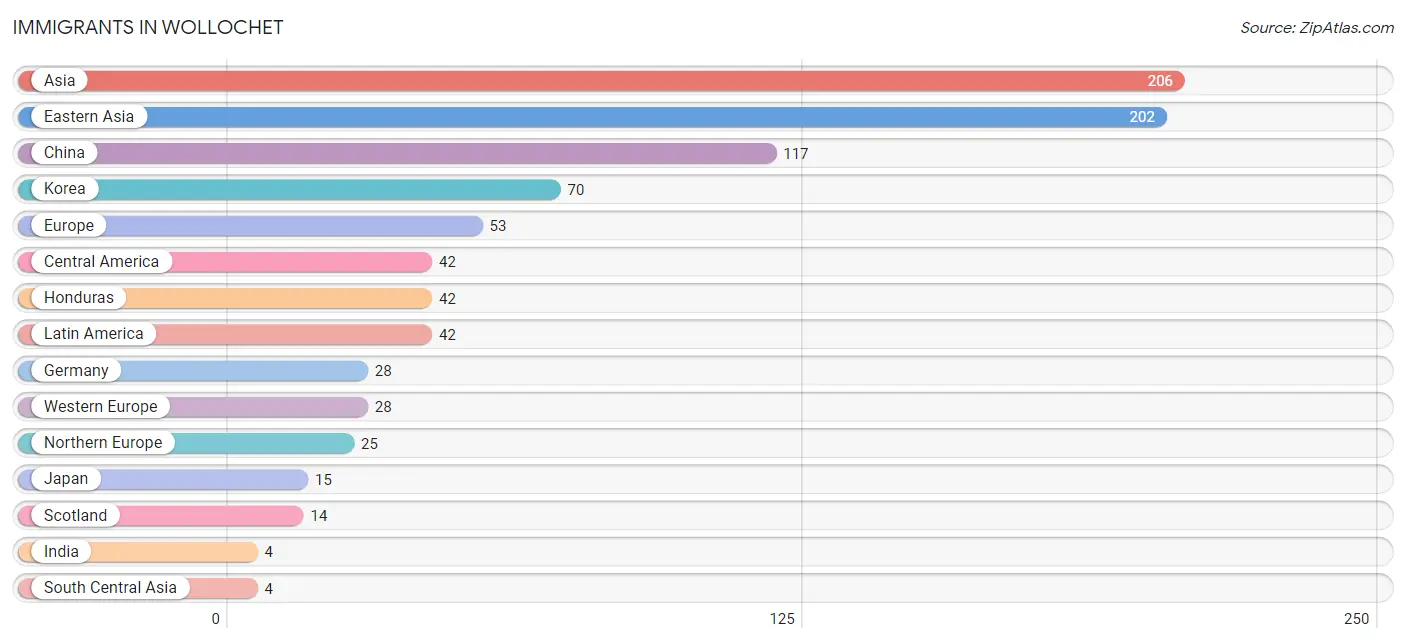
| Immigration Origin | # Population | % Population |
| Asia | 206 | 2.8% |
| Central America | 42 | 0.6% |
| China | 117 | 1.6% |
| Eastern Asia | 202 | 2.8% |
| Europe | 53 | 0.7% |
| Germany | 28 | 0.4% |
| Honduras | 42 | 0.6% |
| India | 4 | 0.1% |
| Japan | 15 | 0.2% |
| Korea | 70 | 1.0% |
| Latin America | 42 | 0.6% |
| Northern Europe | 25 | 0.3% |
| Scotland | 14 | 0.2% |
| South Central Asia | 4 | 0.1% |
| Western Europe | 28 | 0.4% | View All 15 Rows |
Sex and Age in Wollochet
Sex and Age in Wollochet
The most populous age groups in Wollochet are 60 to 64 Years (471 | 13.4%) for men and 65 to 69 Years (479 | 12.8%) for women.
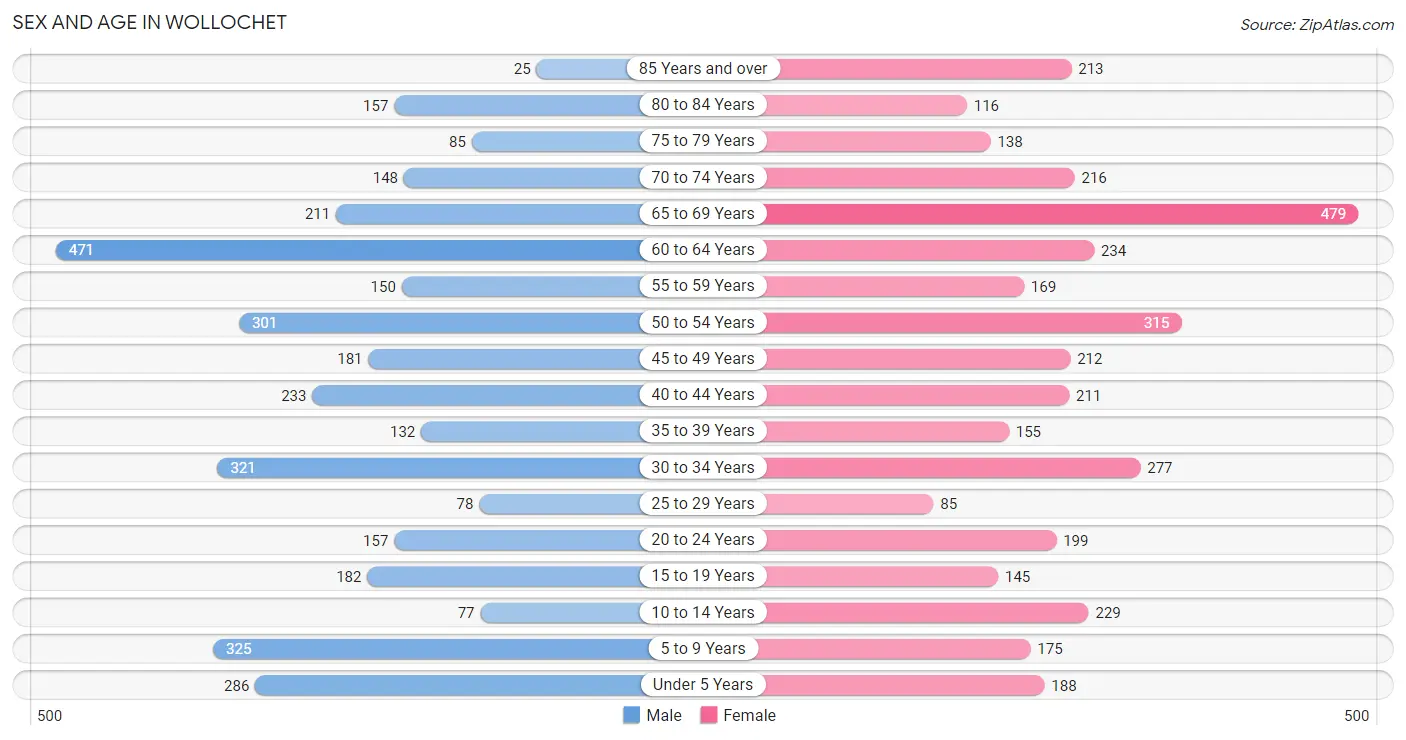
| Age Bracket | Male | Female |
| Under 5 Years | 286 (8.1%) | 188 (5.0%) |
| 5 to 9 Years | 325 (9.2%) | 175 (4.7%) |
| 10 to 14 Years | 77 (2.2%) | 229 (6.1%) |
| 15 to 19 Years | 182 (5.2%) | 145 (3.9%) |
| 20 to 24 Years | 157 (4.5%) | 199 (5.3%) |
| 25 to 29 Years | 78 (2.2%) | 85 (2.3%) |
| 30 to 34 Years | 321 (9.1%) | 277 (7.4%) |
| 35 to 39 Years | 132 (3.7%) | 155 (4.1%) |
| 40 to 44 Years | 233 (6.6%) | 211 (5.6%) |
| 45 to 49 Years | 181 (5.1%) | 212 (5.6%) |
| 50 to 54 Years | 301 (8.6%) | 315 (8.4%) |
| 55 to 59 Years | 150 (4.3%) | 169 (4.5%) |
| 60 to 64 Years | 471 (13.4%) | 234 (6.2%) |
| 65 to 69 Years | 211 (6.0%) | 479 (12.8%) |
| 70 to 74 Years | 148 (4.2%) | 216 (5.8%) |
| 75 to 79 Years | 85 (2.4%) | 138 (3.7%) |
| 80 to 84 Years | 157 (4.5%) | 116 (3.1%) |
| 85 Years and over | 25 (0.7%) | 213 (5.7%) |
| Total | 3,520 (100.0%) | 3,756 (100.0%) |
Families and Households in Wollochet
Median Family Size in Wollochet
The median family size in Wollochet is 2.93 persons per family, with married-couple families (2,066 | 93.3%) accounting for the largest median family size of 2.97 persons per family. On the other hand, single male/father families (57 | 2.6%) represent the smallest median family size with 1.88 persons per family.
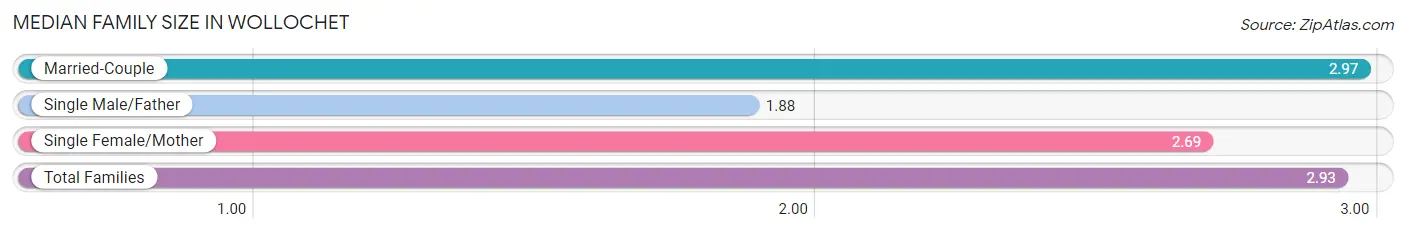
| Family Type | # Families | Family Size |
| Married-Couple | 2,066 (93.3%) | 2.97 |
| Single Male/Father | 57 (2.6%) | 1.88 |
| Single Female/Mother | 91 (4.1%) | 2.69 |
| Total Families | 2,214 (100.0%) | 2.93 |
Median Household Size in Wollochet
The median household size in Wollochet is 2.56 persons per household, with married-couple households (2,066 | 73.7%) accounting for the largest median household size of 2.97 persons per household. non-family households (590 | 21.0%) represent the smallest median household size with 1.15 persons per household.
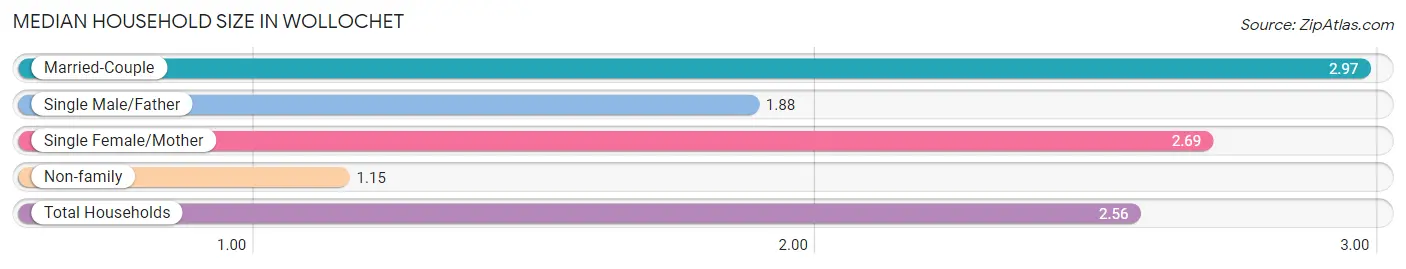
| Household Type | # Households | Household Size |
| Married-Couple | 2,066 (73.7%) | 2.97 |
| Single Male/Father | 57 (2.0%) | 1.88 |
| Single Female/Mother | 91 (3.3%) | 2.69 |
| Non-family | 590 (21.0%) | 1.15 |
| Total Households | 2,804 (100.0%) | 2.56 |
Household Size by Marriage Status in Wollochet
Out of a total of 2,804 households in Wollochet, 2,214 (79.0%) are family households, while 590 (21.0%) are nonfamily households. The most numerous type of family households are 2-person households, comprising 939, and the most common type of nonfamily households are 1-person households, comprising 498.
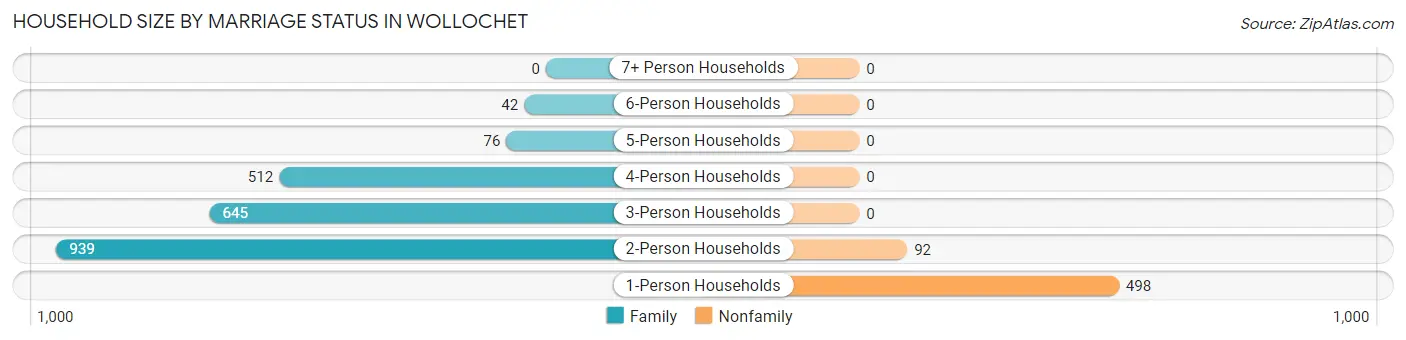
| Household Size | Family Households | Nonfamily Households |
| 1-Person Households | - | 498 (17.8%) |
| 2-Person Households | 939 (33.5%) | 92 (3.3%) |
| 3-Person Households | 645 (23.0%) | 0 (0.0%) |
| 4-Person Households | 512 (18.3%) | 0 (0.0%) |
| 5-Person Households | 76 (2.7%) | 0 (0.0%) |
| 6-Person Households | 42 (1.5%) | 0 (0.0%) |
| 7+ Person Households | 0 (0.0%) | 0 (0.0%) |
| Total | 2,214 (79.0%) | 590 (21.0%) |
Female Fertility in Wollochet
Fertility by Age in Wollochet
Average fertility rate in Wollochet is 44.0 births per 1,000 women. Women in the age bracket of 35 to 50 years have the highest fertility rate with 72.0 births per 1,000 women. Women in the age bracket of 35 to 50 years acount for 75.4% of all women with births.
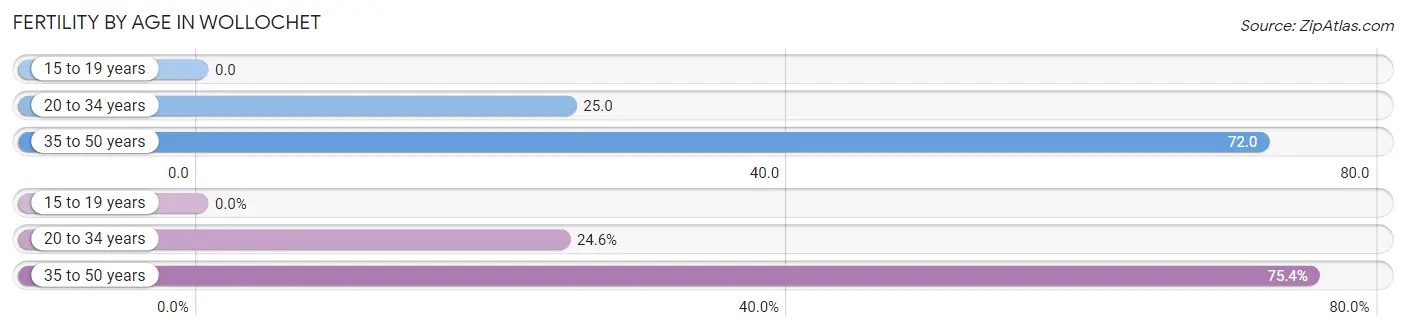
| Age Bracket | Women with Births | Births / 1,000 Women |
| 15 to 19 years | 0 (0.0%) | 0.0 |
| 20 to 34 years | 14 (24.6%) | 25.0 |
| 35 to 50 years | 43 (75.4%) | 72.0 |
| Total | 57 (100.0%) | 44.0 |
Fertility by Age by Marriage Status in Wollochet
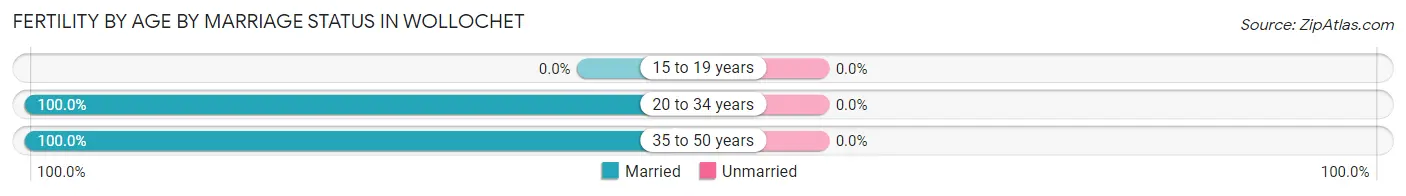
| Age Bracket | Married | Unmarried |
| 15 to 19 years | 0 (0.0%) | 0 (0.0%) |
| 20 to 34 years | 14 (100.0%) | 0 (0.0%) |
| 35 to 50 years | 43 (100.0%) | 0 (0.0%) |
| Total | 57 (100.0%) | 0 (0.0%) |
Fertility by Education in Wollochet
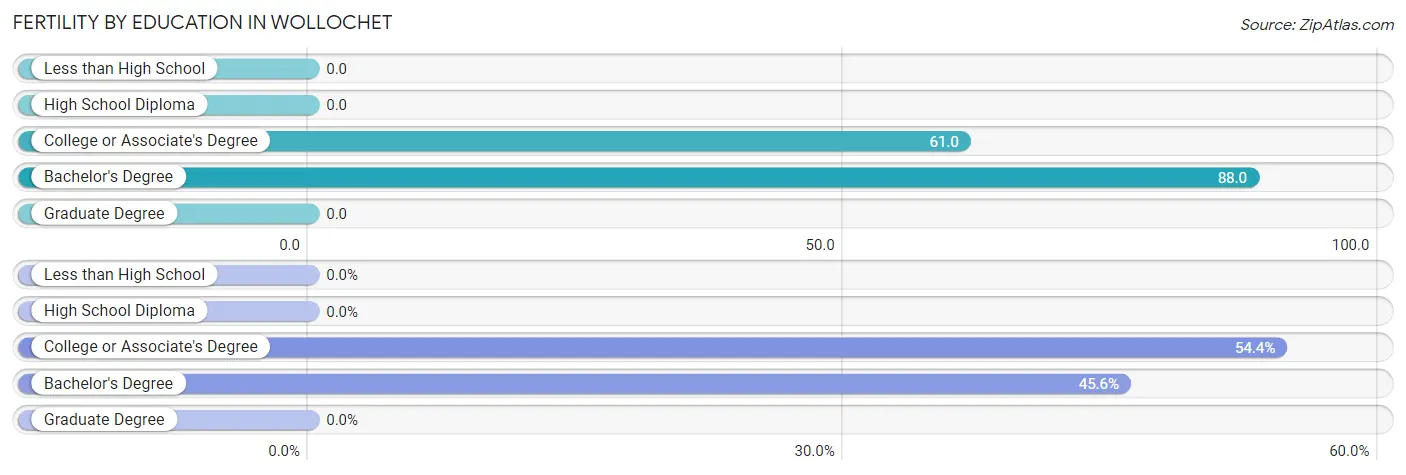
| Educational Attainment | Women with Births | Births / 1,000 Women |
| Less than High School | 0 (0.0%) | 0.0 |
| High School Diploma | 0 (0.0%) | 0.0 |
| College or Associate's Degree | 31 (54.4%) | 61.0 |
| Bachelor's Degree | 26 (45.6%) | 88.0 |
| Graduate Degree | 0 (0.0%) | 0.0 |
| Total | 57 (100.0%) | 44.0 |
Fertility by Education by Marriage Status in Wollochet
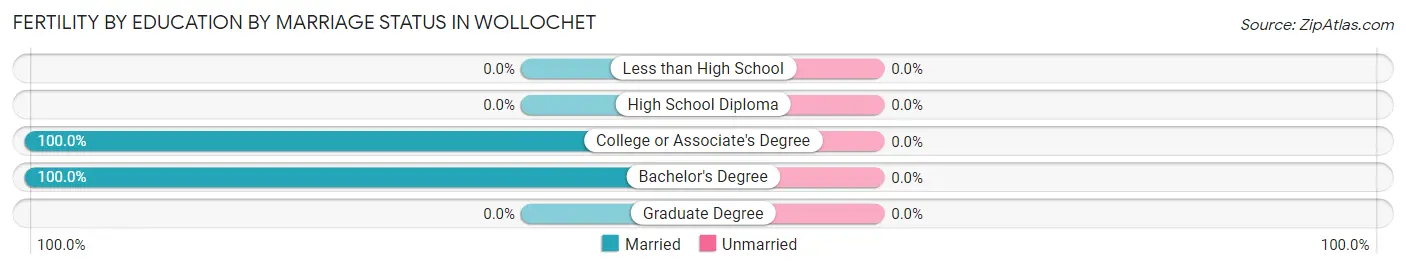
| Educational Attainment | Married | Unmarried |
| Less than High School | 0 (0.0%) | 0 (0.0%) |
| High School Diploma | 0 (0.0%) | 0 (0.0%) |
| College or Associate's Degree | 31 (100.0%) | 0 (0.0%) |
| Bachelor's Degree | 26 (100.0%) | 0 (0.0%) |
| Graduate Degree | 0 (0.0%) | 0 (0.0%) |
| Total | 57 (100.0%) | 0 (0.0%) |
Employment Characteristics in Wollochet
Employment by Class of Employer in Wollochet
Among the 3,719 employed individuals in Wollochet, private company employees (1,971 | 53.0%), not-for-profit organizations (598 | 16.1%), and local government employees (375 | 10.1%) make up the most common classes of employment.
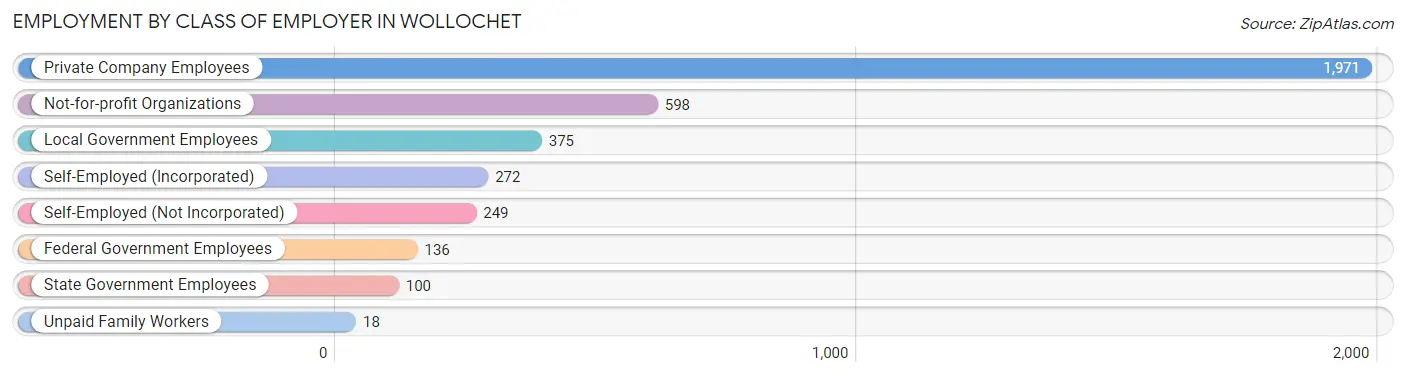
| Employer Class | # Employees | % Employees |
| Private Company Employees | 1,971 | 53.0% |
| Self-Employed (Incorporated) | 272 | 7.3% |
| Self-Employed (Not Incorporated) | 249 | 6.7% |
| Not-for-profit Organizations | 598 | 16.1% |
| Local Government Employees | 375 | 10.1% |
| State Government Employees | 100 | 2.7% |
| Federal Government Employees | 136 | 3.7% |
| Unpaid Family Workers | 18 | 0.5% |
| Total | 3,719 | 100.0% |
Employment Status by Age in Wollochet
According to the labor force statistics for Wollochet, out of the total population over 16 years of age (5,842), 66.9% or 3,908 individuals are in the labor force, with 1.9% or 74 of them unemployed. The age group with the highest labor force participation rate is 30 to 34 years, with 91.5% or 547 individuals in the labor force. Within the labor force, the 20 to 24 years age range has the highest percentage of unemployed individuals, with 20.8% or 52 of them being unemployed.
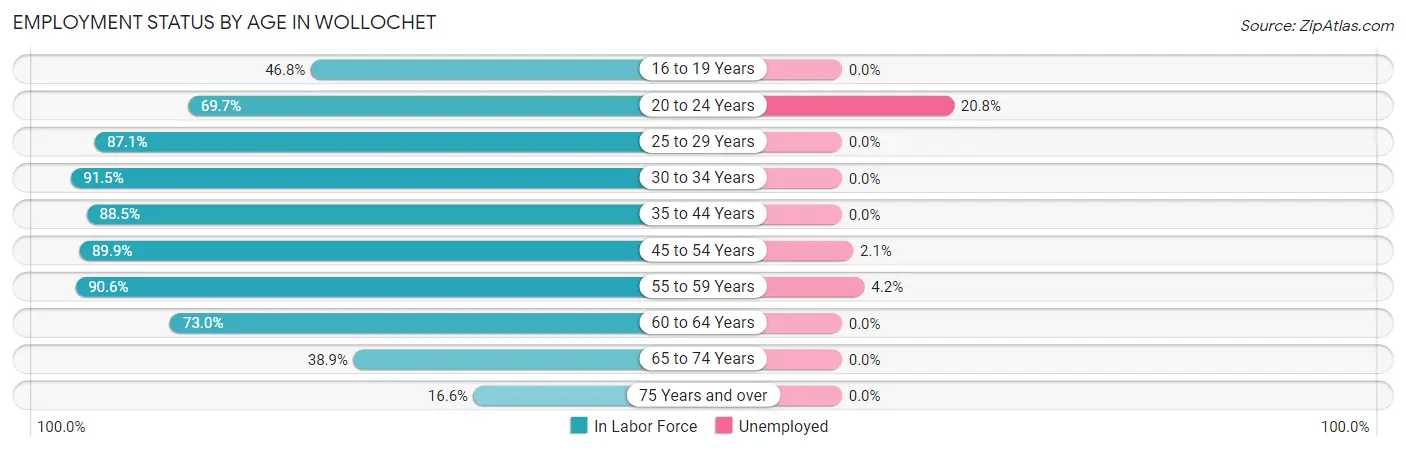
| Age Bracket | In Labor Force | Unemployed |
| 16 to 19 Years | 81 (46.8%) | 0 (0.0%) |
| 20 to 24 Years | 248 (69.7%) | 52 (20.8%) |
| 25 to 29 Years | 142 (87.1%) | 0 (0.0%) |
| 30 to 34 Years | 547 (91.5%) | 0 (0.0%) |
| 35 to 44 Years | 647 (88.5%) | 0 (0.0%) |
| 45 to 54 Years | 907 (89.9%) | 19 (2.1%) |
| 55 to 59 Years | 289 (90.6%) | 12 (4.2%) |
| 60 to 64 Years | 515 (73.0%) | 0 (0.0%) |
| 65 to 74 Years | 410 (38.9%) | 0 (0.0%) |
| 75 Years and over | 122 (16.6%) | 0 (0.0%) |
| Total | 3,908 (66.9%) | 74 (1.9%) |
Employment Status by Educational Attainment in Wollochet
According to labor force statistics for Wollochet, 86.4% of individuals (3,046) out of the total population between 25 and 64 years of age (3,525) are in the labor force, with 1.0% or 30 of them being unemployed. The group with the highest labor force participation rate are those with the educational attainment of high school diploma, with 93.1% or 499 individuals in the labor force. Within the labor force, individuals with college / associate degree education have the highest percentage of unemployment, with 1.2% or 12 of them being unemployed.
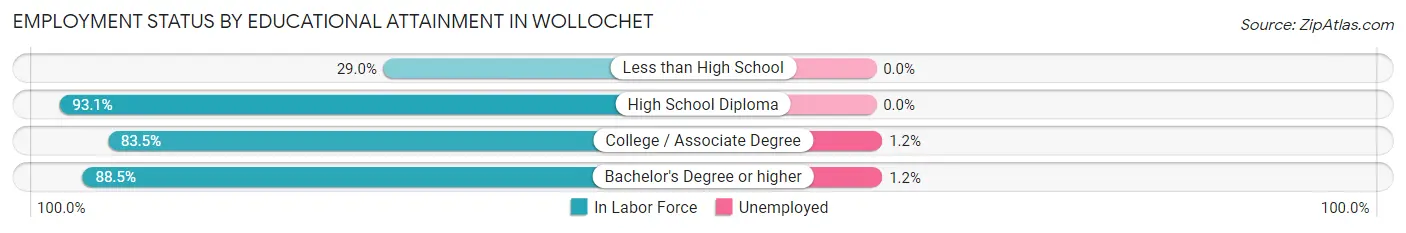
| Educational Attainment | In Labor Force | Unemployed |
| Less than High School | 18 (29.0%) | 0 (0.0%) |
| High School Diploma | 499 (93.1%) | 0 (0.0%) |
| College / Associate Degree | 1,005 (83.5%) | 14 (1.2%) |
| Bachelor's Degree or higher | 1,525 (88.5%) | 21 (1.2%) |
| Total | 3,046 (86.4%) | 35 (1.0%) |
Employment Occupations by Sex in Wollochet
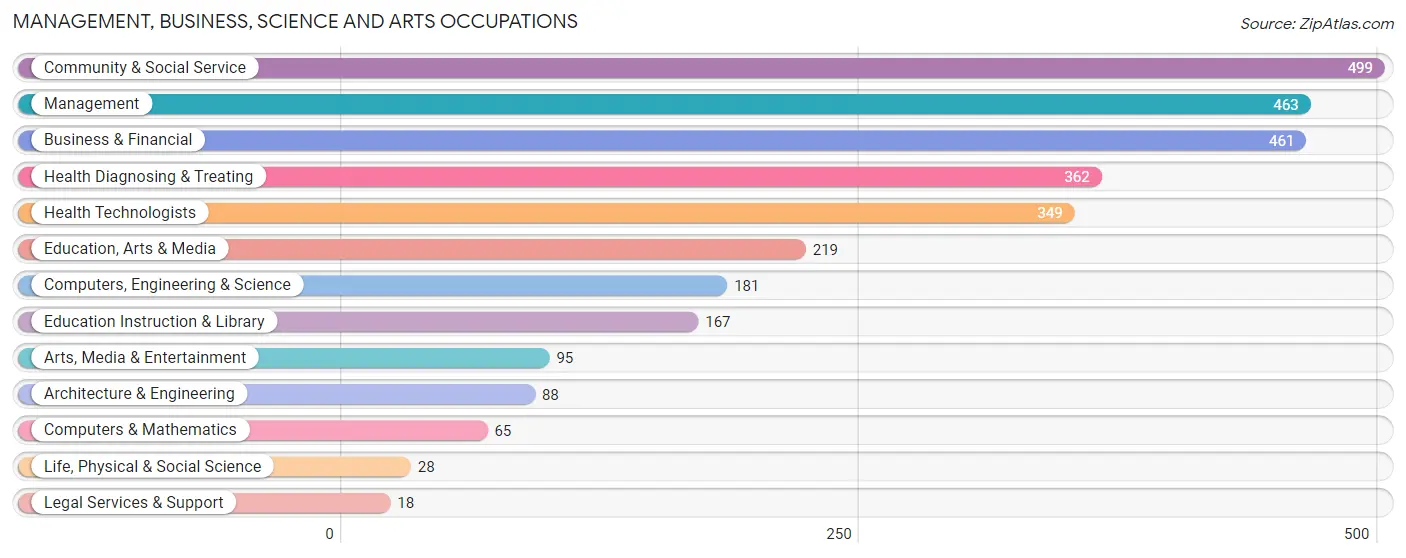
Management, Business, Science and Arts Occupations
The most common Management, Business, Science and Arts occupations in Wollochet are Community & Social Service (499 | 13.2%), Management (463 | 12.2%), Business & Financial (461 | 12.2%), Health Diagnosing & Treating (362 | 9.6%), and Health Technologists (349 | 9.2%).
Management, Business, Science and Arts Occupations by Sex
Within the Management, Business, Science and Arts occupations in Wollochet, the most male-oriented occupations are Architecture & Engineering (100.0%), Life, Physical & Social Science (100.0%), and Computers, Engineering & Science (89.5%), while the most female-oriented occupations are Legal Services & Support (100.0%), Arts, Media & Entertainment (100.0%), and Health Diagnosing & Treating (61.1%).
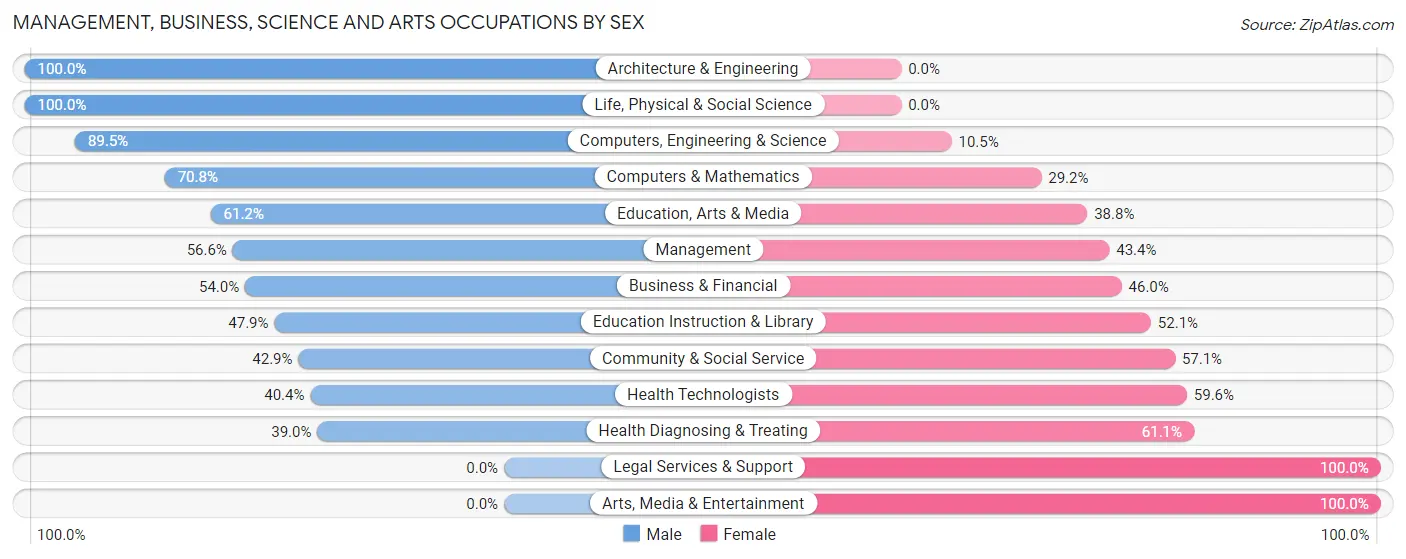
| Occupation | Male | Female |
| Management | 262 (56.6%) | 201 (43.4%) |
| Business & Financial | 249 (54.0%) | 212 (46.0%) |
| Computers, Engineering & Science | 162 (89.5%) | 19 (10.5%) |
| Computers & Mathematics | 46 (70.8%) | 19 (29.2%) |
| Architecture & Engineering | 88 (100.0%) | 0 (0.0%) |
| Life, Physical & Social Science | 28 (100.0%) | 0 (0.0%) |
| Community & Social Service | 214 (42.9%) | 285 (57.1%) |
| Education, Arts & Media | 134 (61.2%) | 85 (38.8%) |
| Legal Services & Support | 0 (0.0%) | 18 (100.0%) |
| Education Instruction & Library | 80 (47.9%) | 87 (52.1%) |
| Arts, Media & Entertainment | 0 (0.0%) | 95 (100.0%) |
| Health Diagnosing & Treating | 141 (39.0%) | 221 (61.1%) |
| Health Technologists | 141 (40.4%) | 208 (59.6%) |
| Total (Category) | 1,028 (52.3%) | 938 (47.7%) |
| Total (Overall) | 1,935 (51.1%) | 1,854 (48.9%) |
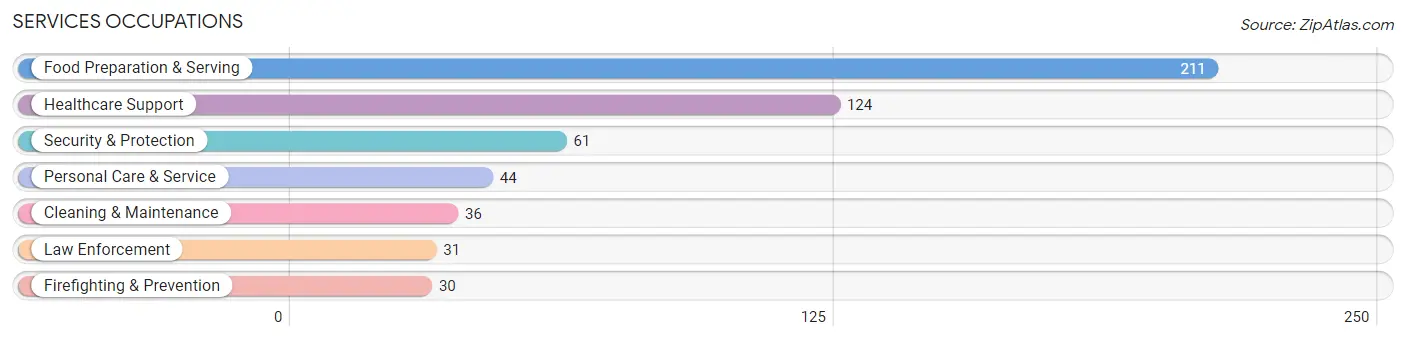
Services Occupations
The most common Services occupations in Wollochet are Food Preparation & Serving (211 | 5.6%), Healthcare Support (124 | 3.3%), Security & Protection (61 | 1.6%), Personal Care & Service (44 | 1.2%), and Cleaning & Maintenance (36 | 0.9%).
Services Occupations by Sex
Within the Services occupations in Wollochet, the most male-oriented occupations are Security & Protection (100.0%), Firefighting & Prevention (100.0%), and Law Enforcement (100.0%), while the most female-oriented occupations are Healthcare Support (100.0%), Personal Care & Service (72.7%), and Cleaning & Maintenance (41.7%).
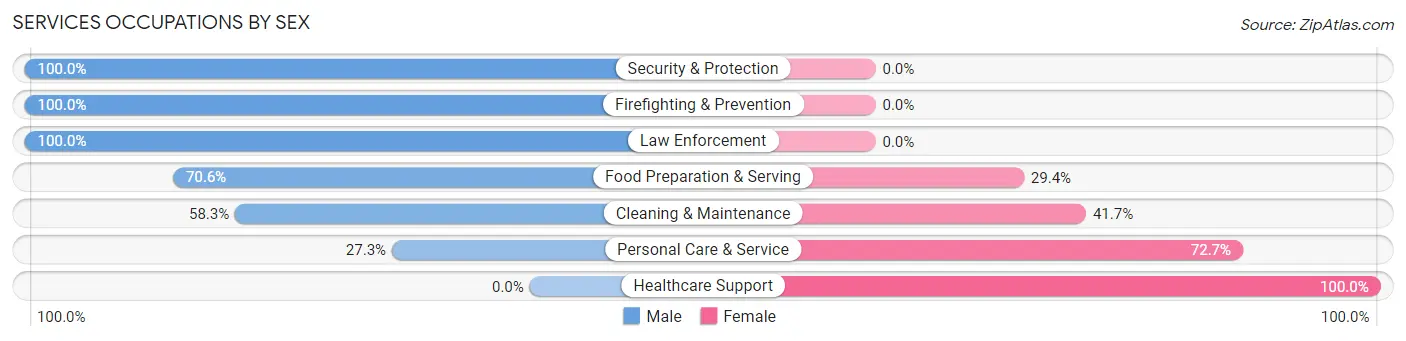
| Occupation | Male | Female |
| Healthcare Support | 0 (0.0%) | 124 (100.0%) |
| Security & Protection | 61 (100.0%) | 0 (0.0%) |
| Firefighting & Prevention | 30 (100.0%) | 0 (0.0%) |
| Law Enforcement | 31 (100.0%) | 0 (0.0%) |
| Food Preparation & Serving | 149 (70.6%) | 62 (29.4%) |
| Cleaning & Maintenance | 21 (58.3%) | 15 (41.7%) |
| Personal Care & Service | 12 (27.3%) | 32 (72.7%) |
| Total (Category) | 243 (51.0%) | 233 (48.9%) |
| Total (Overall) | 1,935 (51.1%) | 1,854 (48.9%) |
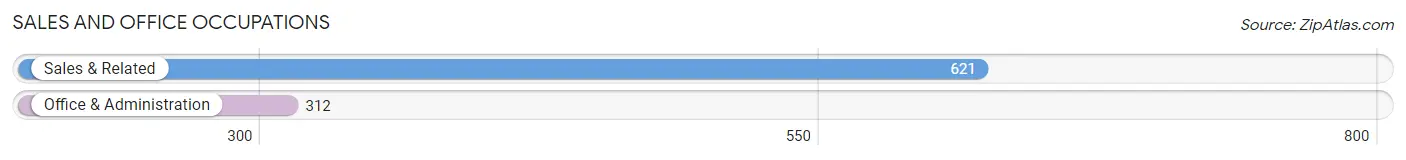
Sales and Office Occupations
The most common Sales and Office occupations in Wollochet are Sales & Related (621 | 16.4%), and Office & Administration (312 | 8.2%).
Sales and Office Occupations by Sex
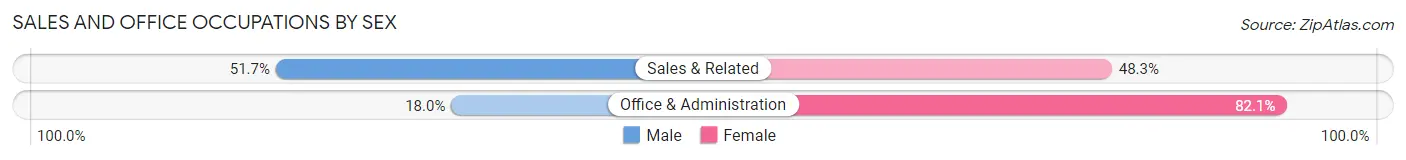
| Occupation | Male | Female |
| Sales & Related | 321 (51.7%) | 300 (48.3%) |
| Office & Administration | 56 (17.9%) | 256 (82.1%) |
| Total (Category) | 377 (40.4%) | 556 (59.6%) |
| Total (Overall) | 1,935 (51.1%) | 1,854 (48.9%) |
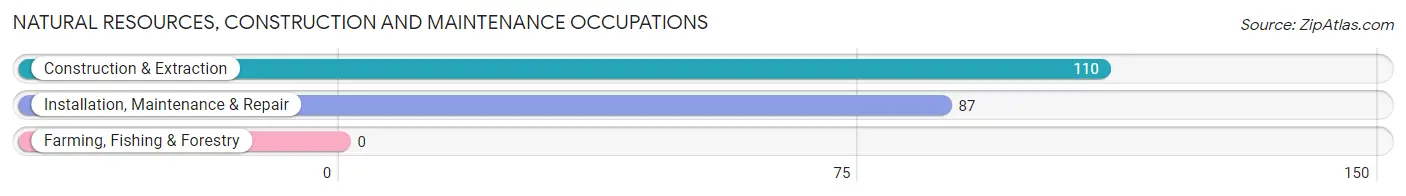
Natural Resources, Construction and Maintenance Occupations
The most common Natural Resources, Construction and Maintenance occupations in Wollochet are Construction & Extraction (110 | 2.9%), and Installation, Maintenance & Repair (87 | 2.3%).
Natural Resources, Construction and Maintenance Occupations by Sex
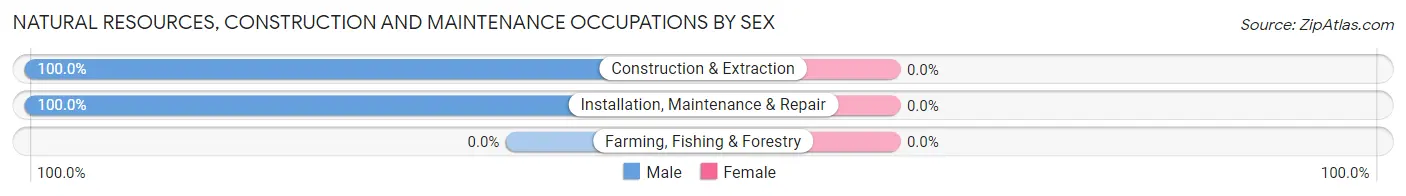
| Occupation | Male | Female |
| Farming, Fishing & Forestry | 0 (0.0%) | 0 (0.0%) |
| Construction & Extraction | 110 (100.0%) | 0 (0.0%) |
| Installation, Maintenance & Repair | 87 (100.0%) | 0 (0.0%) |
| Total (Category) | 197 (100.0%) | 0 (0.0%) |
| Total (Overall) | 1,935 (51.1%) | 1,854 (48.9%) |
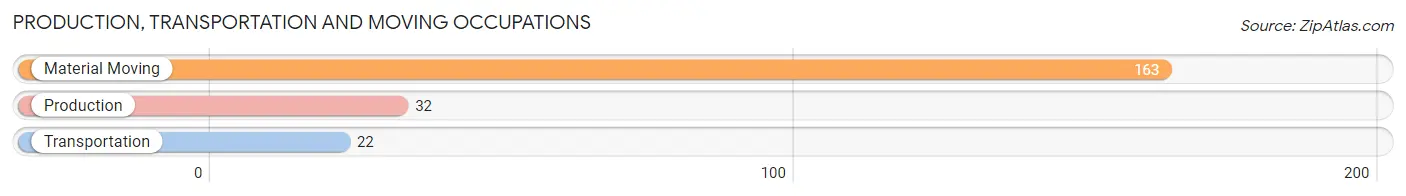
Production, Transportation and Moving Occupations
The most common Production, Transportation and Moving occupations in Wollochet are Material Moving (163 | 4.3%), Production (32 | 0.8%), and Transportation (22 | 0.6%).
Production, Transportation and Moving Occupations by Sex
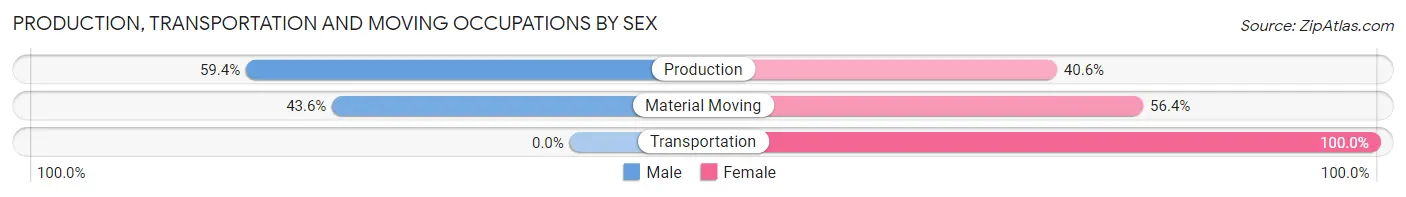
| Occupation | Male | Female |
| Production | 19 (59.4%) | 13 (40.6%) |
| Transportation | 0 (0.0%) | 22 (100.0%) |
| Material Moving | 71 (43.6%) | 92 (56.4%) |
| Total (Category) | 90 (41.5%) | 127 (58.5%) |
| Total (Overall) | 1,935 (51.1%) | 1,854 (48.9%) |
Employment Industries by Sex in Wollochet
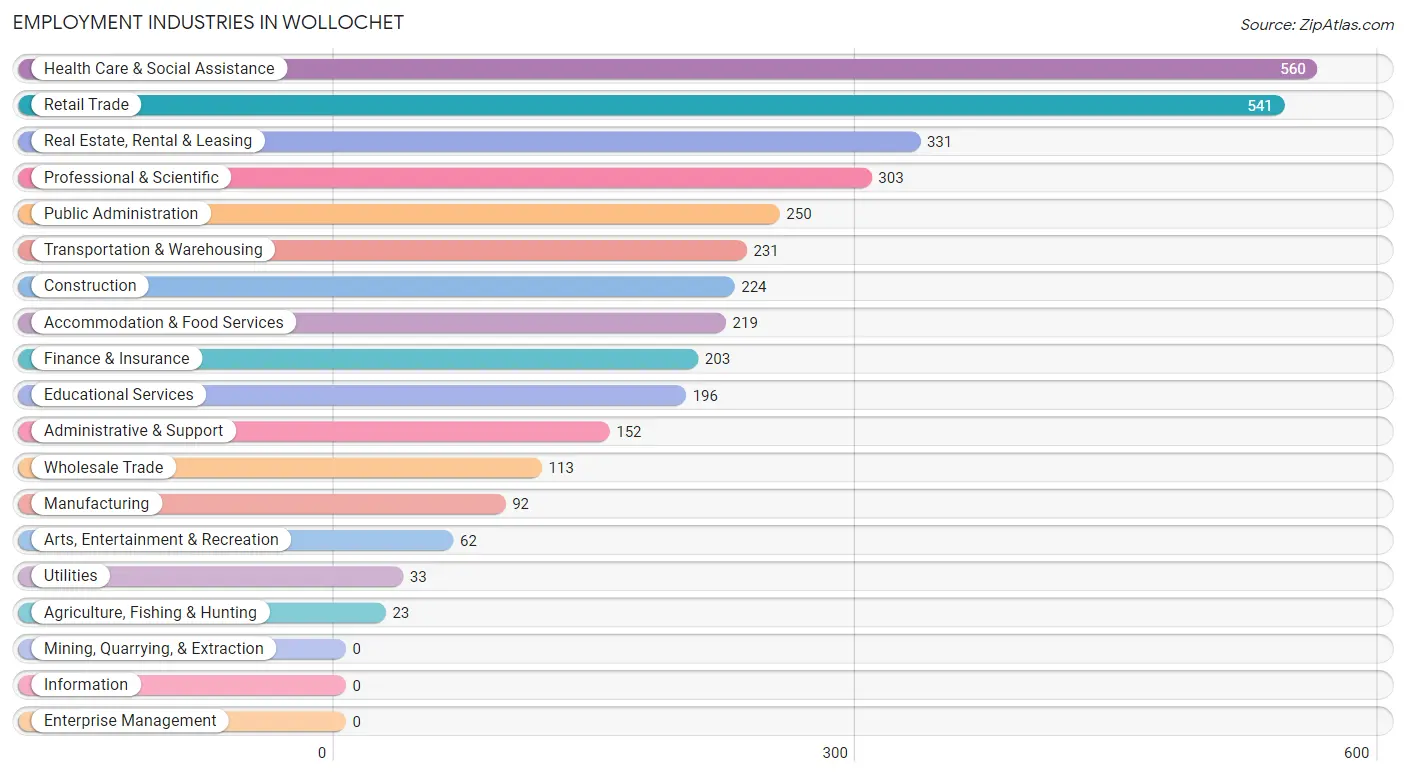
Employment Industries in Wollochet
The major employment industries in Wollochet include Health Care & Social Assistance (560 | 14.8%), Retail Trade (541 | 14.3%), Real Estate, Rental & Leasing (331 | 8.7%), Professional & Scientific (303 | 8.0%), and Public Administration (250 | 6.6%).
Employment Industries by Sex in Wollochet
The Wollochet industries that see more men than women are Agriculture, Fishing & Hunting (100.0%), Utilities (100.0%), and Finance & Insurance (90.6%), whereas the industries that tend to have a higher number of women are Arts, Entertainment & Recreation (100.0%), Health Care & Social Assistance (75.2%), and Professional & Scientific (70.3%).
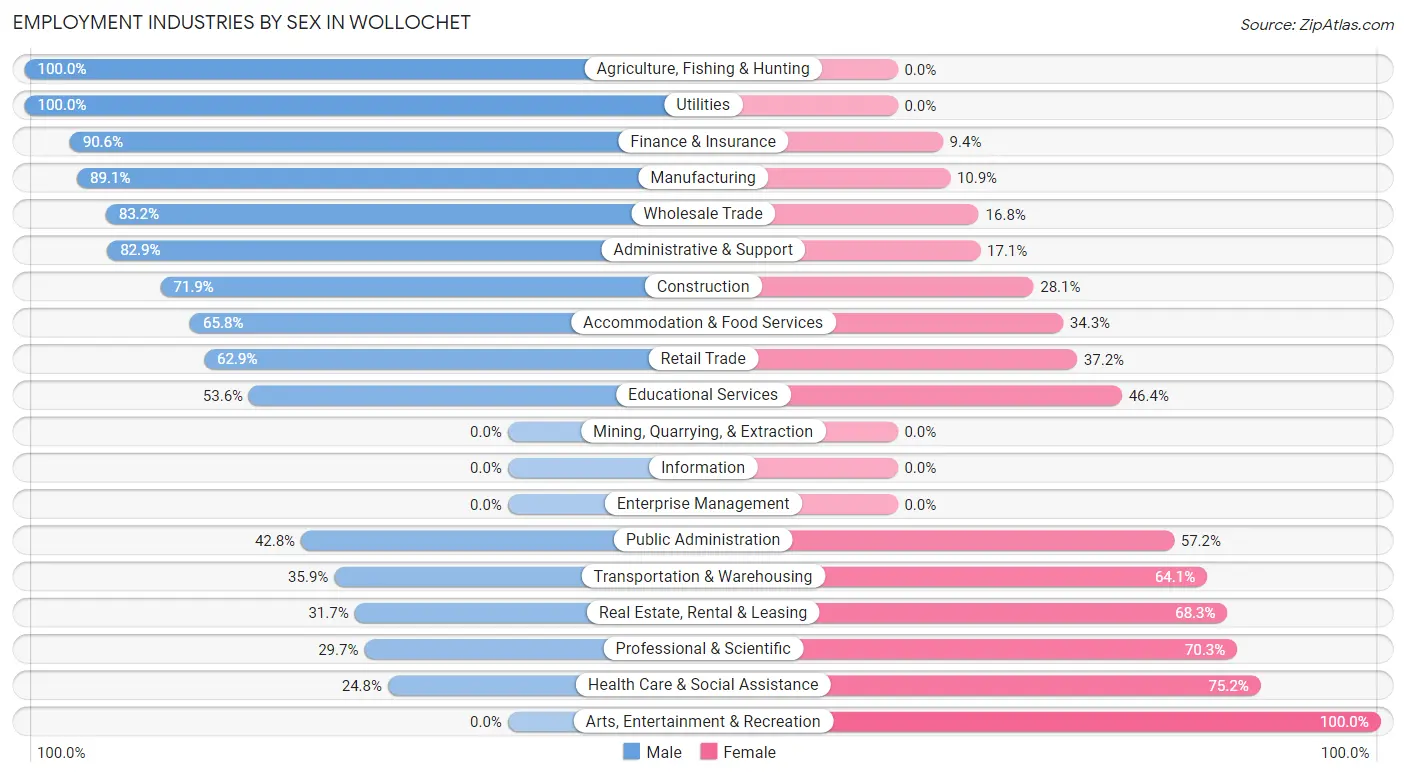
| Industry | Male | Female |
| Agriculture, Fishing & Hunting | 23 (100.0%) | 0 (0.0%) |
| Mining, Quarrying, & Extraction | 0 (0.0%) | 0 (0.0%) |
| Construction | 161 (71.9%) | 63 (28.1%) |
| Manufacturing | 82 (89.1%) | 10 (10.9%) |
| Wholesale Trade | 94 (83.2%) | 19 (16.8%) |
| Retail Trade | 340 (62.8%) | 201 (37.1%) |
| Transportation & Warehousing | 83 (35.9%) | 148 (64.1%) |
| Utilities | 33 (100.0%) | 0 (0.0%) |
| Information | 0 (0.0%) | 0 (0.0%) |
| Finance & Insurance | 184 (90.6%) | 19 (9.4%) |
| Real Estate, Rental & Leasing | 105 (31.7%) | 226 (68.3%) |
| Professional & Scientific | 90 (29.7%) | 213 (70.3%) |
| Enterprise Management | 0 (0.0%) | 0 (0.0%) |
| Administrative & Support | 126 (82.9%) | 26 (17.1%) |
| Educational Services | 105 (53.6%) | 91 (46.4%) |
| Health Care & Social Assistance | 139 (24.8%) | 421 (75.2%) |
| Arts, Entertainment & Recreation | 0 (0.0%) | 62 (100.0%) |
| Accommodation & Food Services | 144 (65.7%) | 75 (34.3%) |
| Public Administration | 107 (42.8%) | 143 (57.2%) |
| Total | 1,935 (51.1%) | 1,854 (48.9%) |
Education in Wollochet
School Enrollment in Wollochet
The most common levels of schooling among the 1,523 students in Wollochet are high school (352 | 23.1%), elementary school (325 | 21.3%), and college / undergraduate (263 | 17.3%).
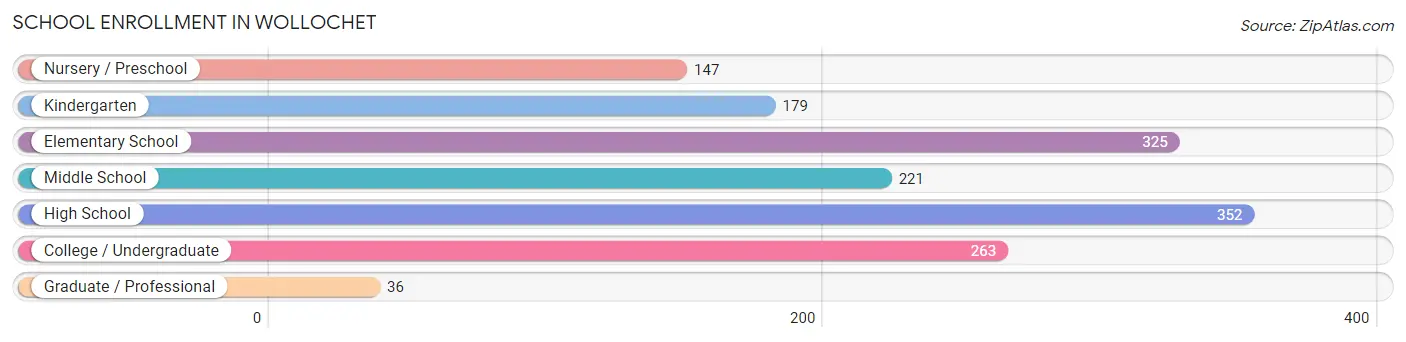
| School Level | # Students | % Students |
| Nursery / Preschool | 147 | 9.7% |
| Kindergarten | 179 | 11.7% |
| Elementary School | 325 | 21.3% |
| Middle School | 221 | 14.5% |
| High School | 352 | 23.1% |
| College / Undergraduate | 263 | 17.3% |
| Graduate / Professional | 36 | 2.4% |
| Total | 1,523 | 100.0% |
School Enrollment by Age by Funding Source in Wollochet
Out of a total of 1,523 students who are enrolled in schools in Wollochet, 299 (19.6%) attend a private institution, while the remaining 1,224 (80.4%) are enrolled in public schools. The age group of 3 to 4 year olds has the highest likelihood of being enrolled in private schools, with 64 (69.6% in the age bracket) enrolled. Conversely, the age group of 15 to 17 year olds has the lowest likelihood of being enrolled in a private school, with 275 (100.0% in the age bracket) attending a public institution.
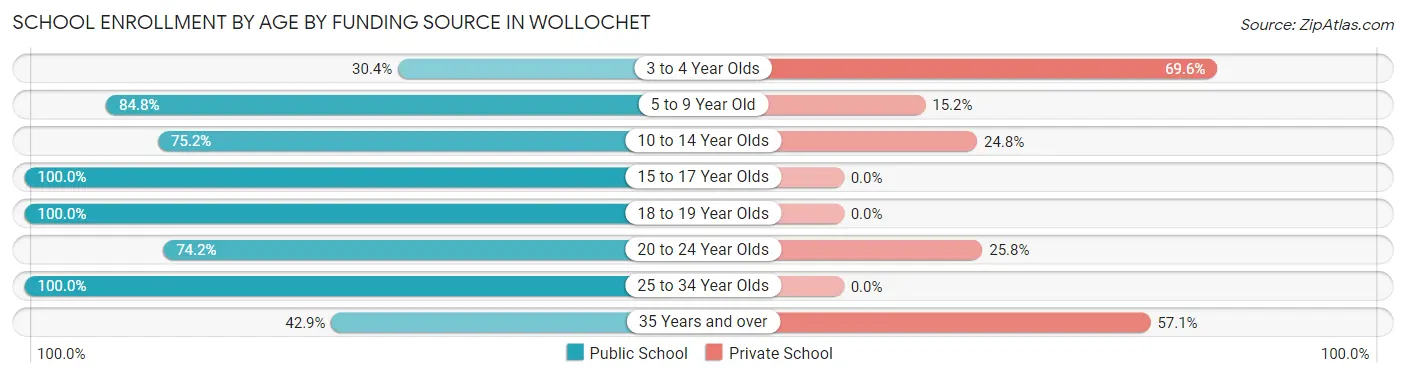
| Age Bracket | Public School | Private School |
| 3 to 4 Year Olds | 28 (30.4%) | 64 (69.6%) |
| 5 to 9 Year Old | 424 (84.8%) | 76 (15.2%) |
| 10 to 14 Year Olds | 230 (75.2%) | 76 (24.8%) |
| 15 to 17 Year Olds | 275 (100.0%) | 0 (0.0%) |
| 18 to 19 Year Olds | 52 (100.0%) | 0 (0.0%) |
| 20 to 24 Year Olds | 135 (74.2%) | 47 (25.8%) |
| 25 to 34 Year Olds | 53 (100.0%) | 0 (0.0%) |
| 35 Years and over | 27 (42.9%) | 36 (57.1%) |
| Total | 1,224 (80.4%) | 299 (19.6%) |
Educational Attainment by Field of Study in Wollochet
Social sciences (433 | 15.1%), psychology (367 | 12.8%), science & technology (319 | 11.1%), business (296 | 10.3%), and education (285 | 10.0%) are the most common fields of study among 2,863 individuals in Wollochet who have obtained a bachelor's degree or higher.
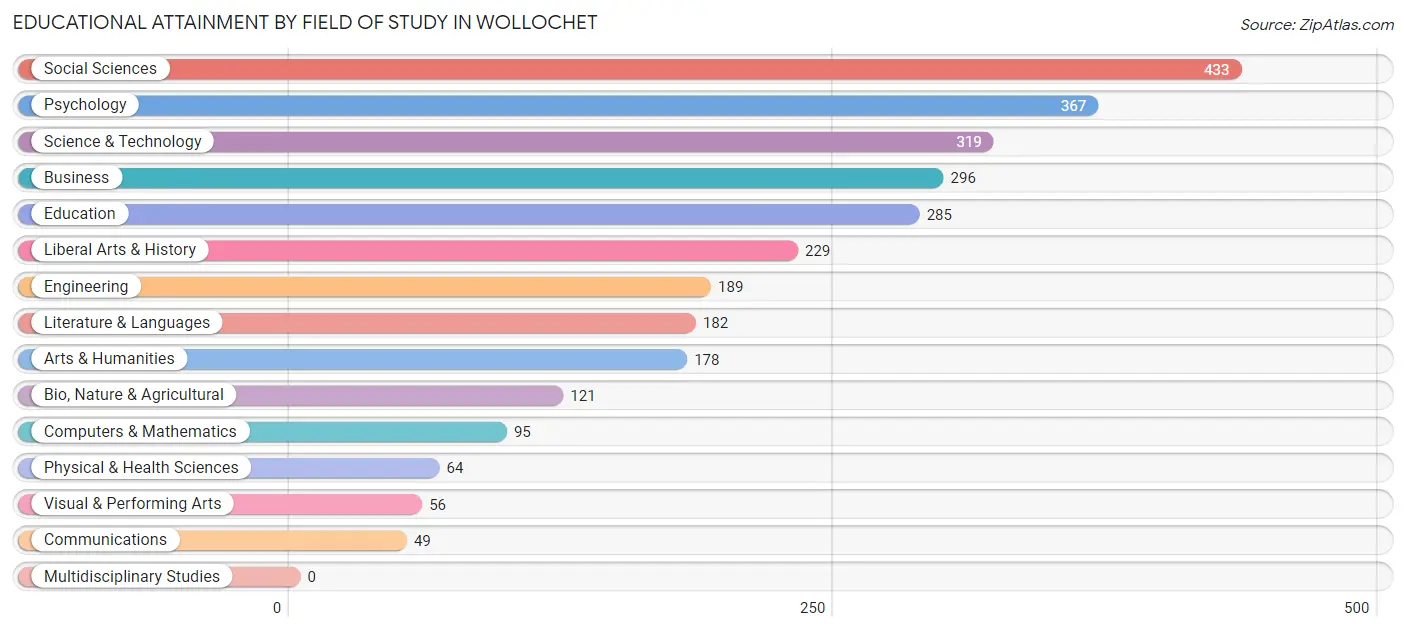
| Field of Study | # Graduates | % Graduates |
| Computers & Mathematics | 95 | 3.3% |
| Bio, Nature & Agricultural | 121 | 4.2% |
| Physical & Health Sciences | 64 | 2.2% |
| Psychology | 367 | 12.8% |
| Social Sciences | 433 | 15.1% |
| Engineering | 189 | 6.6% |
| Multidisciplinary Studies | 0 | 0.0% |
| Science & Technology | 319 | 11.1% |
| Business | 296 | 10.3% |
| Education | 285 | 10.0% |
| Literature & Languages | 182 | 6.4% |
| Liberal Arts & History | 229 | 8.0% |
| Visual & Performing Arts | 56 | 2.0% |
| Communications | 49 | 1.7% |
| Arts & Humanities | 178 | 6.2% |
| Total | 2,863 | 100.0% |
Transportation & Commute in Wollochet
Vehicle Availability by Sex in Wollochet
The most prevalent vehicle ownership categories in Wollochet are males with 2 vehicles (744, accounting for 37.9%) and females with 2 vehicles (824, making up 42.4%).
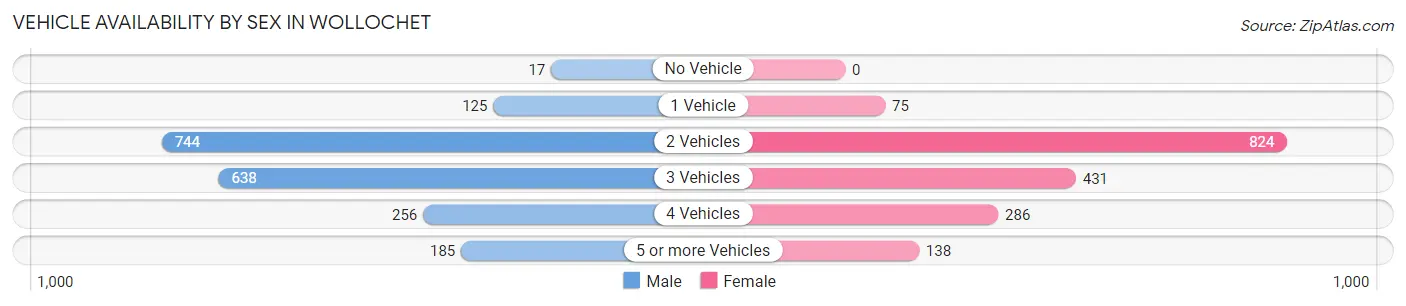
| Vehicles Available | Male | Female |
| No Vehicle | 17 (0.9%) | 0 (0.0%) |
| 1 Vehicle | 125 (6.4%) | 75 (4.3%) |
| 2 Vehicles | 744 (37.9%) | 824 (47.0%) |
| 3 Vehicles | 638 (32.5%) | 431 (24.6%) |
| 4 Vehicles | 256 (13.0%) | 286 (16.3%) |
| 5 or more Vehicles | 185 (9.4%) | 138 (7.9%) |
| Total | 1,965 (100.0%) | 1,754 (100.0%) |
Commute Time in Wollochet
The most frequently occuring commute durations in Wollochet are 30 to 34 minutes (597 commuters, 19.4%), 5 to 9 minutes (522 commuters, 17.0%), and 15 to 19 minutes (383 commuters, 12.4%).
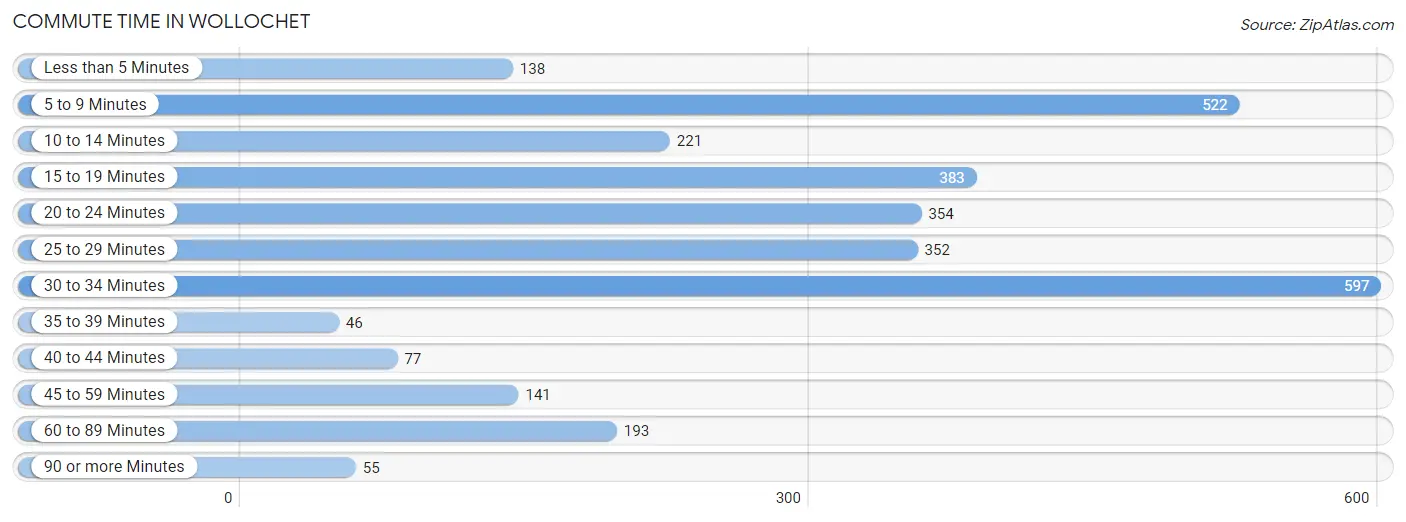
| Commute Time | # Commuters | % Commuters |
| Less than 5 Minutes | 138 | 4.5% |
| 5 to 9 Minutes | 522 | 17.0% |
| 10 to 14 Minutes | 221 | 7.2% |
| 15 to 19 Minutes | 383 | 12.4% |
| 20 to 24 Minutes | 354 | 11.5% |
| 25 to 29 Minutes | 352 | 11.4% |
| 30 to 34 Minutes | 597 | 19.4% |
| 35 to 39 Minutes | 46 | 1.5% |
| 40 to 44 Minutes | 77 | 2.5% |
| 45 to 59 Minutes | 141 | 4.6% |
| 60 to 89 Minutes | 193 | 6.3% |
| 90 or more Minutes | 55 | 1.8% |
Commute Time by Sex in Wollochet
The most common commute times in Wollochet are 30 to 34 minutes (522 commuters, 31.5%) for males and 5 to 9 minutes (324 commuters, 22.8%) for females.
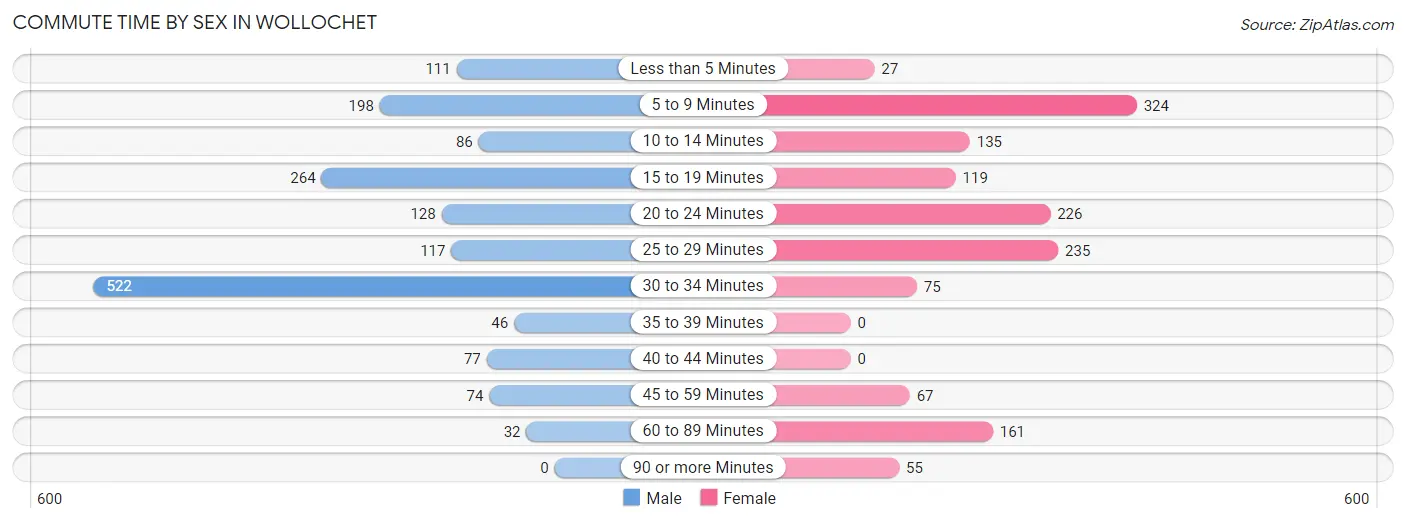
| Commute Time | Male | Female |
| Less than 5 Minutes | 111 (6.7%) | 27 (1.9%) |
| 5 to 9 Minutes | 198 (12.0%) | 324 (22.8%) |
| 10 to 14 Minutes | 86 (5.2%) | 135 (9.5%) |
| 15 to 19 Minutes | 264 (16.0%) | 119 (8.4%) |
| 20 to 24 Minutes | 128 (7.7%) | 226 (15.9%) |
| 25 to 29 Minutes | 117 (7.1%) | 235 (16.5%) |
| 30 to 34 Minutes | 522 (31.5%) | 75 (5.3%) |
| 35 to 39 Minutes | 46 (2.8%) | 0 (0.0%) |
| 40 to 44 Minutes | 77 (4.6%) | 0 (0.0%) |
| 45 to 59 Minutes | 74 (4.5%) | 67 (4.7%) |
| 60 to 89 Minutes | 32 (1.9%) | 161 (11.3%) |
| 90 or more Minutes | 0 (0.0%) | 55 (3.9%) |
Time of Departure to Work by Sex in Wollochet
The most frequent times of departure to work in Wollochet are 9:00 AM to 9:59 AM (349, 21.1%) for males and 7:00 AM to 7:29 AM (254, 17.8%) for females.
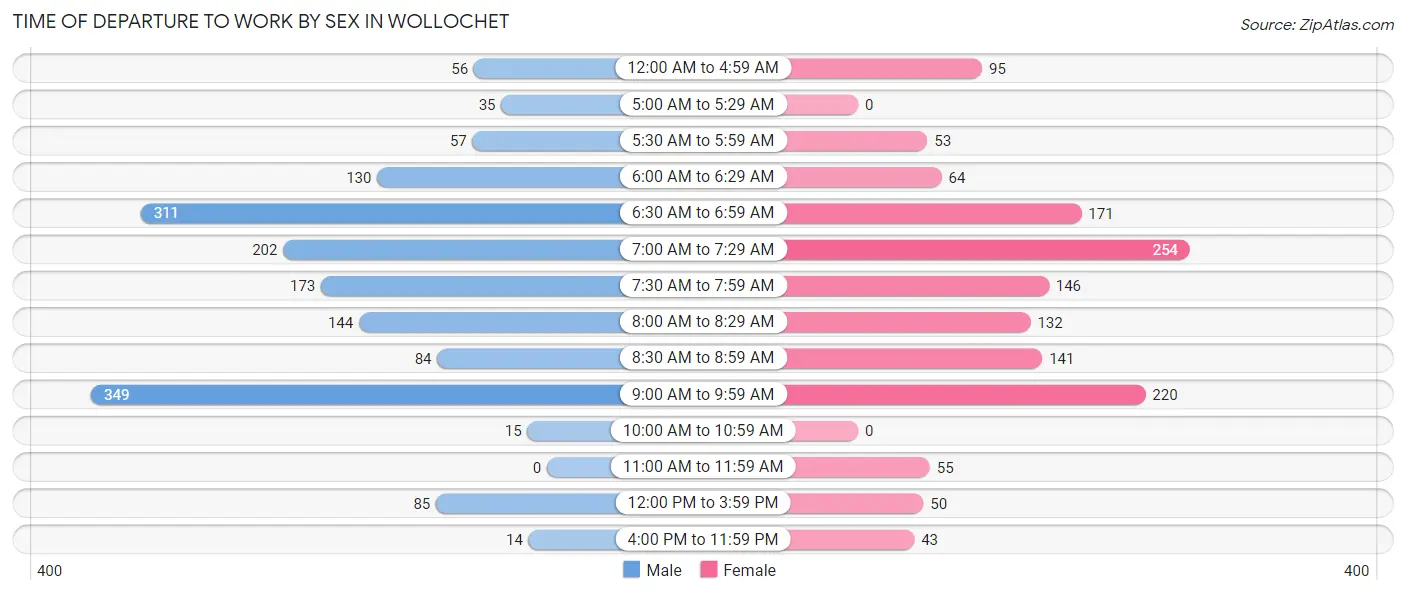
| Time of Departure | Male | Female |
| 12:00 AM to 4:59 AM | 56 (3.4%) | 95 (6.7%) |
| 5:00 AM to 5:29 AM | 35 (2.1%) | 0 (0.0%) |
| 5:30 AM to 5:59 AM | 57 (3.4%) | 53 (3.7%) |
| 6:00 AM to 6:29 AM | 130 (7.9%) | 64 (4.5%) |
| 6:30 AM to 6:59 AM | 311 (18.8%) | 171 (12.0%) |
| 7:00 AM to 7:29 AM | 202 (12.2%) | 254 (17.8%) |
| 7:30 AM to 7:59 AM | 173 (10.4%) | 146 (10.2%) |
| 8:00 AM to 8:29 AM | 144 (8.7%) | 132 (9.3%) |
| 8:30 AM to 8:59 AM | 84 (5.1%) | 141 (9.9%) |
| 9:00 AM to 9:59 AM | 349 (21.1%) | 220 (15.4%) |
| 10:00 AM to 10:59 AM | 15 (0.9%) | 0 (0.0%) |
| 11:00 AM to 11:59 AM | 0 (0.0%) | 55 (3.9%) |
| 12:00 PM to 3:59 PM | 85 (5.1%) | 50 (3.5%) |
| 4:00 PM to 11:59 PM | 14 (0.9%) | 43 (3.0%) |
| Total | 1,655 (100.0%) | 1,424 (100.0%) |
Housing Occupancy in Wollochet
Occupancy by Ownership in Wollochet
Of the total 2,804 dwellings in Wollochet, owner-occupied units account for 2,218 (79.1%), while renter-occupied units make up 586 (20.9%).
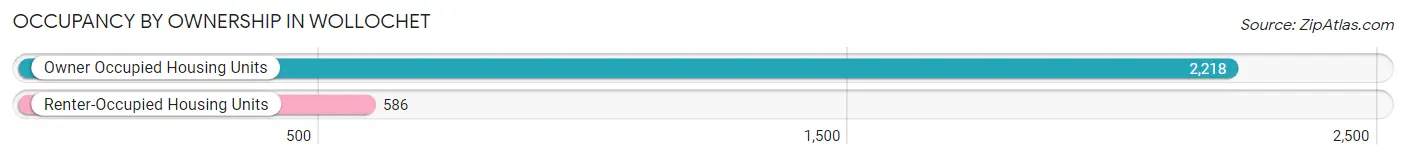
| Occupancy | # Housing Units | % Housing Units |
| Owner Occupied Housing Units | 2,218 | 79.1% |
| Renter-Occupied Housing Units | 586 | 20.9% |
| Total Occupied Housing Units | 2,804 | 100.0% |
Occupancy by Household Size in Wollochet
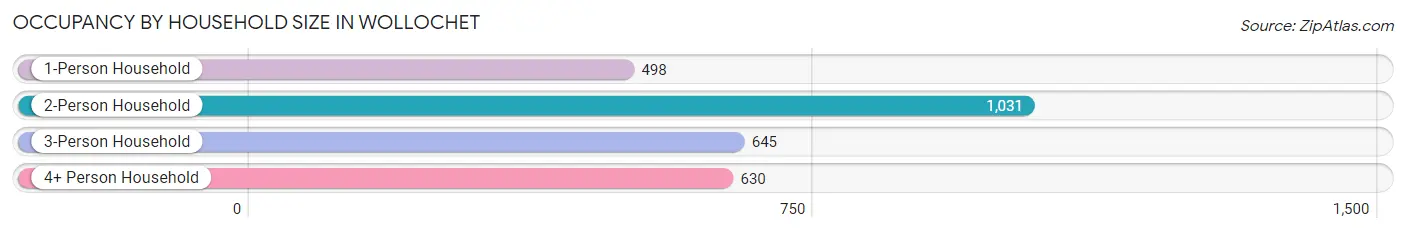
| Household Size | # Housing Units | % Housing Units |
| 1-Person Household | 498 | 17.8% |
| 2-Person Household | 1,031 | 36.8% |
| 3-Person Household | 645 | 23.0% |
| 4+ Person Household | 630 | 22.5% |
| Total Housing Units | 2,804 | 100.0% |
Occupancy by Ownership by Household Size in Wollochet
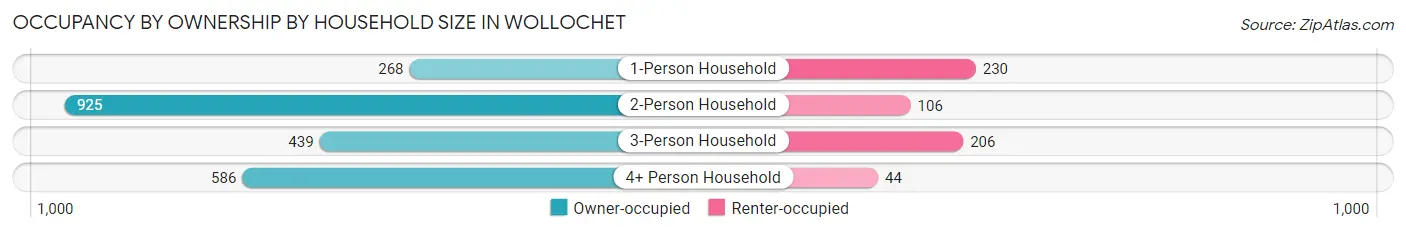
| Household Size | Owner-occupied | Renter-occupied |
| 1-Person Household | 268 (53.8%) | 230 (46.2%) |
| 2-Person Household | 925 (89.7%) | 106 (10.3%) |
| 3-Person Household | 439 (68.1%) | 206 (31.9%) |
| 4+ Person Household | 586 (93.0%) | 44 (7.0%) |
| Total Housing Units | 2,218 (79.1%) | 586 (20.9%) |
Occupancy by Educational Attainment in Wollochet
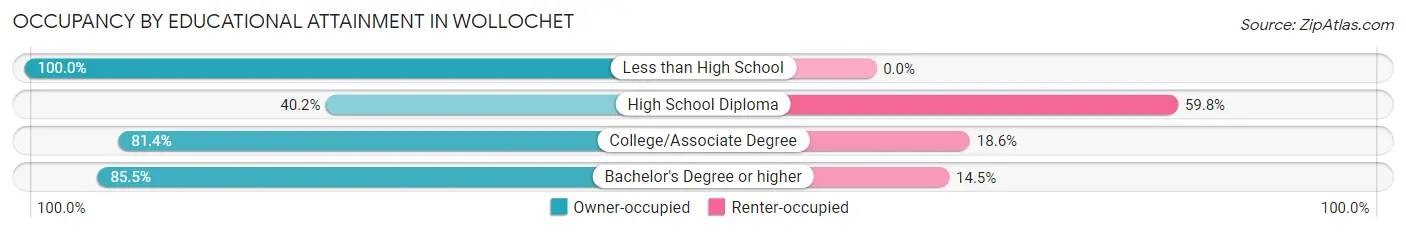
| Household Size | Owner-occupied | Renter-occupied |
| Less than High School | 122 (100.0%) | 0 (0.0%) |
| High School Diploma | 143 (40.2%) | 213 (59.8%) |
| College/Associate Degree | 723 (81.4%) | 165 (18.6%) |
| Bachelor's Degree or higher | 1,230 (85.5%) | 208 (14.5%) |
Occupancy by Age of Householder in Wollochet
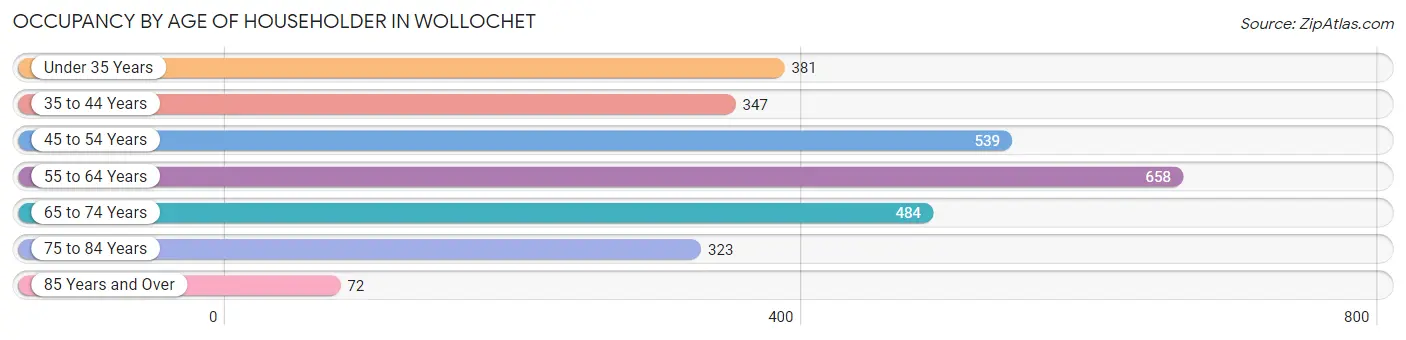
| Age Bracket | # Households | % Households |
| Under 35 Years | 381 | 13.6% |
| 35 to 44 Years | 347 | 12.4% |
| 45 to 54 Years | 539 | 19.2% |
| 55 to 64 Years | 658 | 23.5% |
| 65 to 74 Years | 484 | 17.3% |
| 75 to 84 Years | 323 | 11.5% |
| 85 Years and Over | 72 | 2.6% |
| Total | 2,804 | 100.0% |
Housing Finances in Wollochet
Median Income by Occupancy in Wollochet
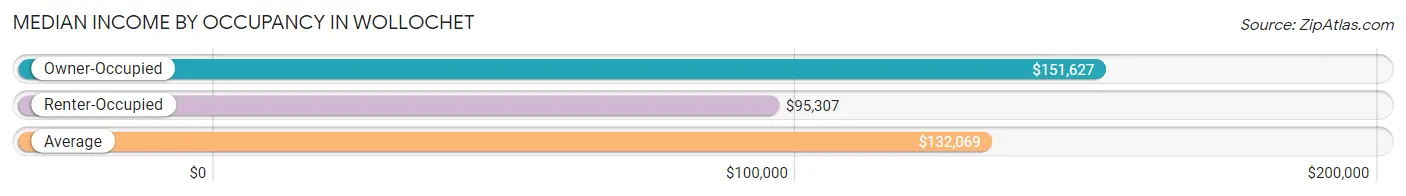
| Occupancy Type | # Households | Median Income |
| Owner-Occupied | 2,218 (79.1%) | $151,627 |
| Renter-Occupied | 586 (20.9%) | $95,307 |
| Average | 2,804 (100.0%) | $132,069 |
Occupancy by Householder Income Bracket in Wollochet
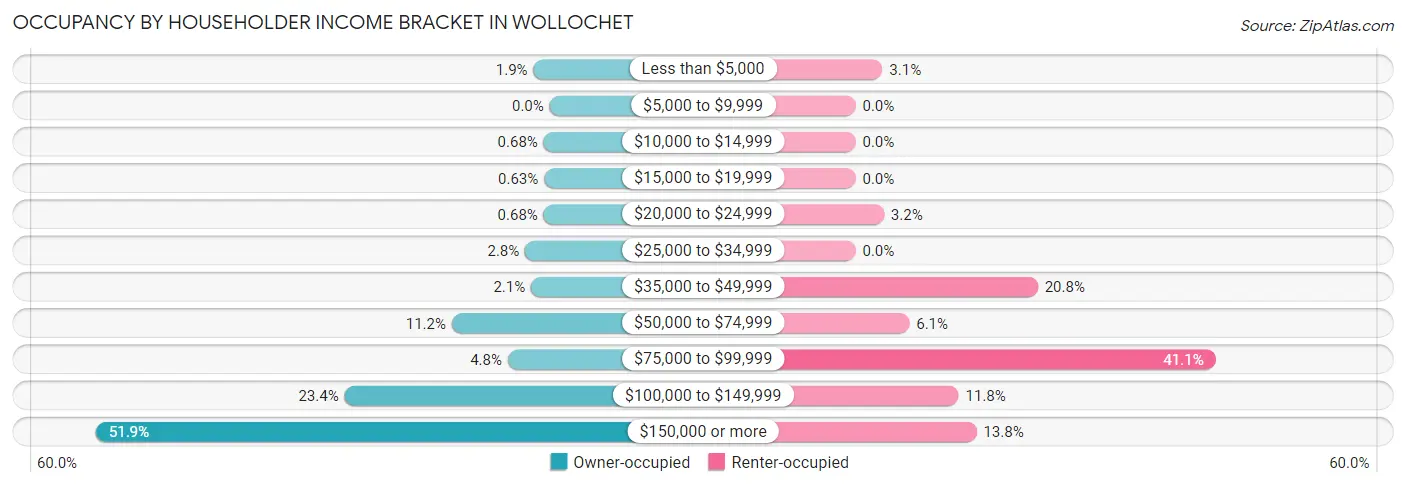
| Income Bracket | Owner-occupied | Renter-occupied |
| Less than $5,000 | 41 (1.8%) | 18 (3.1%) |
| $5,000 to $9,999 | 0 (0.0%) | 0 (0.0%) |
| $10,000 to $14,999 | 15 (0.7%) | 0 (0.0%) |
| $15,000 to $19,999 | 14 (0.6%) | 0 (0.0%) |
| $20,000 to $24,999 | 15 (0.7%) | 19 (3.2%) |
| $25,000 to $34,999 | 62 (2.8%) | 0 (0.0%) |
| $35,000 to $49,999 | 47 (2.1%) | 122 (20.8%) |
| $50,000 to $74,999 | 248 (11.2%) | 36 (6.1%) |
| $75,000 to $99,999 | 106 (4.8%) | 241 (41.1%) |
| $100,000 to $149,999 | 520 (23.4%) | 69 (11.8%) |
| $150,000 or more | 1,150 (51.8%) | 81 (13.8%) |
| Total | 2,218 (100.0%) | 586 (100.0%) |
Monthly Housing Cost Tiers in Wollochet
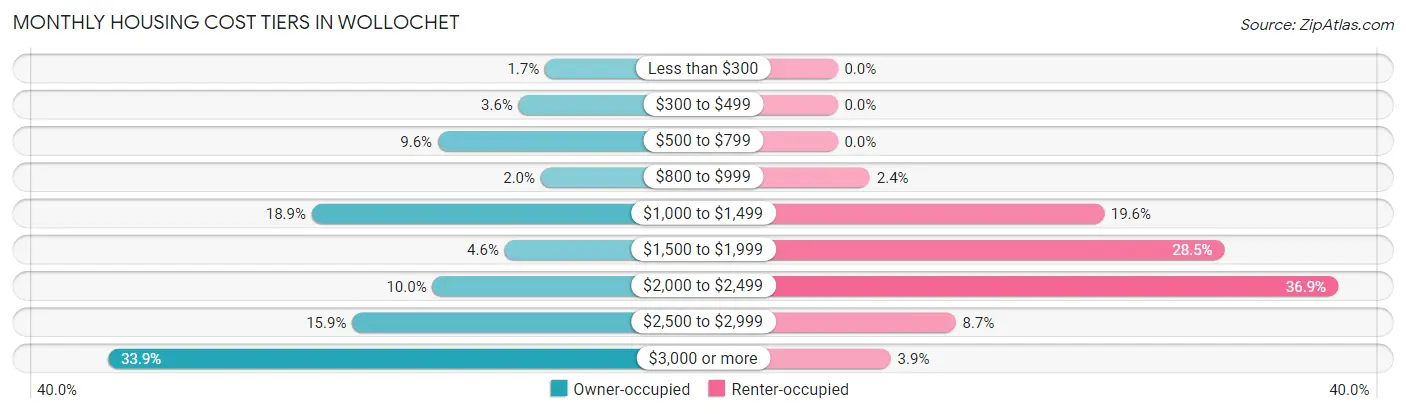
| Monthly Cost | Owner-occupied | Renter-occupied |
| Less than $300 | 37 (1.7%) | 0 (0.0%) |
| $300 to $499 | 80 (3.6%) | 0 (0.0%) |
| $500 to $799 | 212 (9.6%) | 0 (0.0%) |
| $800 to $999 | 44 (2.0%) | 14 (2.4%) |
| $1,000 to $1,499 | 418 (18.9%) | 115 (19.6%) |
| $1,500 to $1,999 | 103 (4.6%) | 167 (28.5%) |
| $2,000 to $2,499 | 221 (10.0%) | 216 (36.9%) |
| $2,500 to $2,999 | 352 (15.9%) | 51 (8.7%) |
| $3,000 or more | 751 (33.9%) | 23 (3.9%) |
| Total | 2,218 (100.0%) | 586 (100.0%) |
Physical Housing Characteristics in Wollochet
Housing Structures in Wollochet
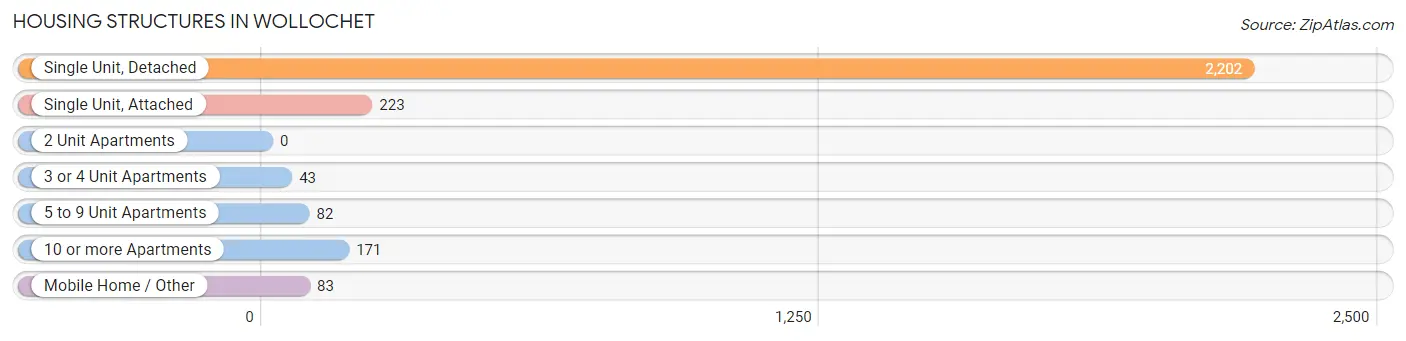
| Structure Type | # Housing Units | % Housing Units |
| Single Unit, Detached | 2,202 | 78.5% |
| Single Unit, Attached | 223 | 8.0% |
| 2 Unit Apartments | 0 | 0.0% |
| 3 or 4 Unit Apartments | 43 | 1.5% |
| 5 to 9 Unit Apartments | 82 | 2.9% |
| 10 or more Apartments | 171 | 6.1% |
| Mobile Home / Other | 83 | 3.0% |
| Total | 2,804 | 100.0% |
Housing Structures by Occupancy in Wollochet
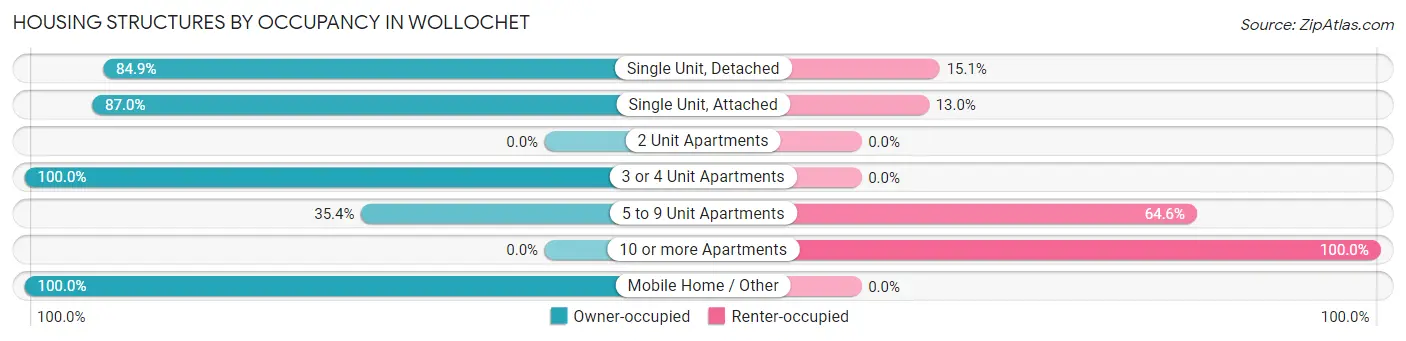
| Structure Type | Owner-occupied | Renter-occupied |
| Single Unit, Detached | 1,869 (84.9%) | 333 (15.1%) |
| Single Unit, Attached | 194 (87.0%) | 29 (13.0%) |
| 2 Unit Apartments | 0 (0.0%) | 0 (0.0%) |
| 3 or 4 Unit Apartments | 43 (100.0%) | 0 (0.0%) |
| 5 to 9 Unit Apartments | 29 (35.4%) | 53 (64.6%) |
| 10 or more Apartments | 0 (0.0%) | 171 (100.0%) |
| Mobile Home / Other | 83 (100.0%) | 0 (0.0%) |
| Total | 2,218 (79.1%) | 586 (20.9%) |
Housing Structures by Number of Rooms in Wollochet
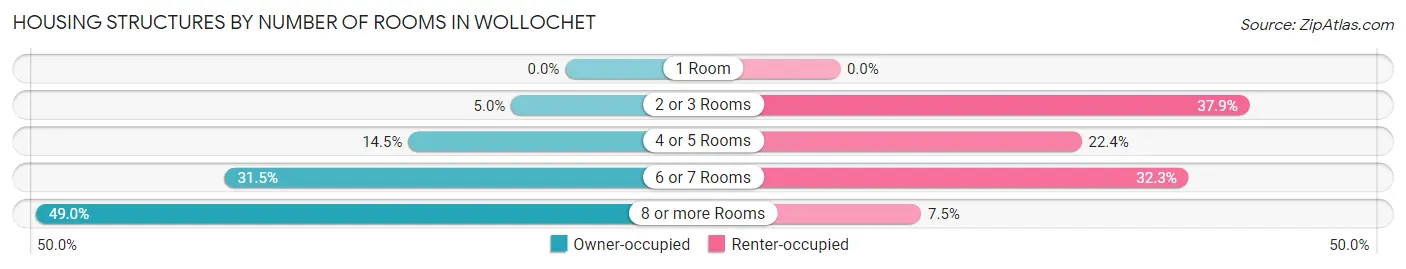
| Number of Rooms | Owner-occupied | Renter-occupied |
| 1 Room | 0 (0.0%) | 0 (0.0%) |
| 2 or 3 Rooms | 111 (5.0%) | 222 (37.9%) |
| 4 or 5 Rooms | 322 (14.5%) | 131 (22.4%) |
| 6 or 7 Rooms | 699 (31.5%) | 189 (32.3%) |
| 8 or more Rooms | 1,086 (49.0%) | 44 (7.5%) |
| Total | 2,218 (100.0%) | 586 (100.0%) |
Housing Structure by Heating Type in Wollochet
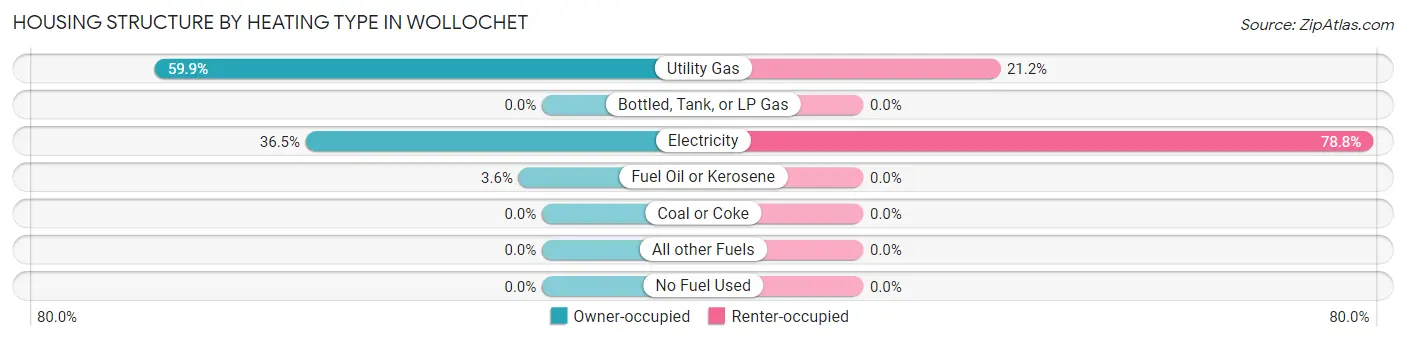
| Heating Type | Owner-occupied | Renter-occupied |
| Utility Gas | 1,328 (59.9%) | 124 (21.2%) |
| Bottled, Tank, or LP Gas | 0 (0.0%) | 0 (0.0%) |
| Electricity | 810 (36.5%) | 462 (78.8%) |
| Fuel Oil or Kerosene | 80 (3.6%) | 0 (0.0%) |
| Coal or Coke | 0 (0.0%) | 0 (0.0%) |
| All other Fuels | 0 (0.0%) | 0 (0.0%) |
| No Fuel Used | 0 (0.0%) | 0 (0.0%) |
| Total | 2,218 (100.0%) | 586 (100.0%) |
Household Vehicle Usage in Wollochet
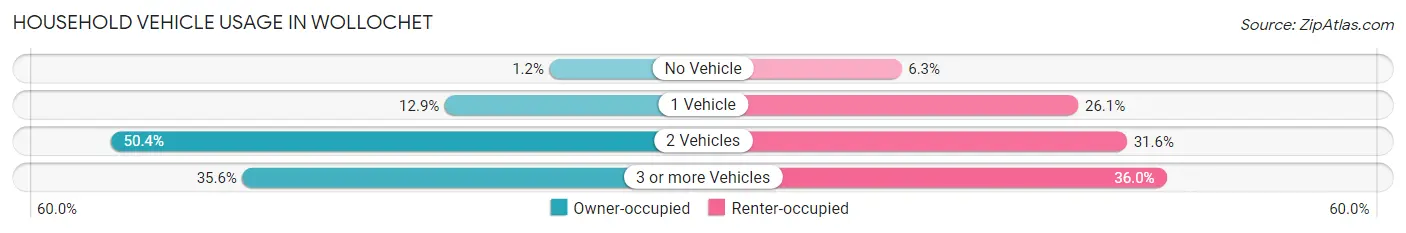
| Vehicles per Household | Owner-occupied | Renter-occupied |
| No Vehicle | 26 (1.2%) | 37 (6.3%) |
| 1 Vehicle | 286 (12.9%) | 153 (26.1%) |
| 2 Vehicles | 1,117 (50.4%) | 185 (31.6%) |
| 3 or more Vehicles | 789 (35.6%) | 211 (36.0%) |
| Total | 2,218 (100.0%) | 586 (100.0%) |
Real Estate & Mortgages in Wollochet
Real Estate and Mortgage Overview in Wollochet
| Characteristic | Without Mortgage | With Mortgage |
| Housing Units | 660 | 1,558 |
| Median Property Value | $721,600 | $737,500 |
| Median Household Income | $118,750 | $894 |
| Monthly Housing Costs | $803 | $751 |
| Real Estate Taxes | $5,765 | $17 |
Property Value by Mortgage Status in Wollochet
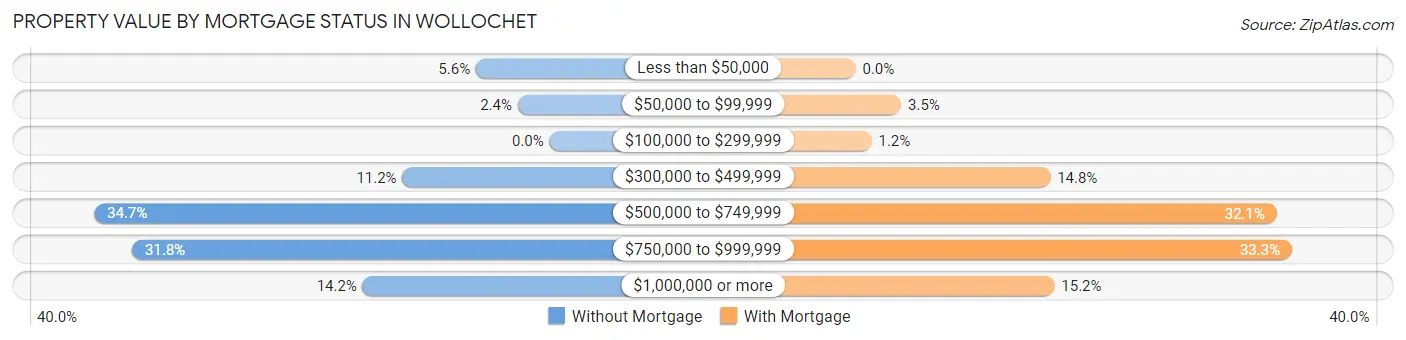
| Property Value | Without Mortgage | With Mortgage |
| Less than $50,000 | 37 (5.6%) | 0 (0.0%) |
| $50,000 to $99,999 | 16 (2.4%) | 54 (3.5%) |
| $100,000 to $299,999 | 0 (0.0%) | 19 (1.2%) |
| $300,000 to $499,999 | 74 (11.2%) | 231 (14.8%) |
| $500,000 to $749,999 | 229 (34.7%) | 500 (32.1%) |
| $750,000 to $999,999 | 210 (31.8%) | 518 (33.3%) |
| $1,000,000 or more | 94 (14.2%) | 236 (15.1%) |
| Total | 660 (100.0%) | 1,558 (100.0%) |
Household Income by Mortgage Status in Wollochet
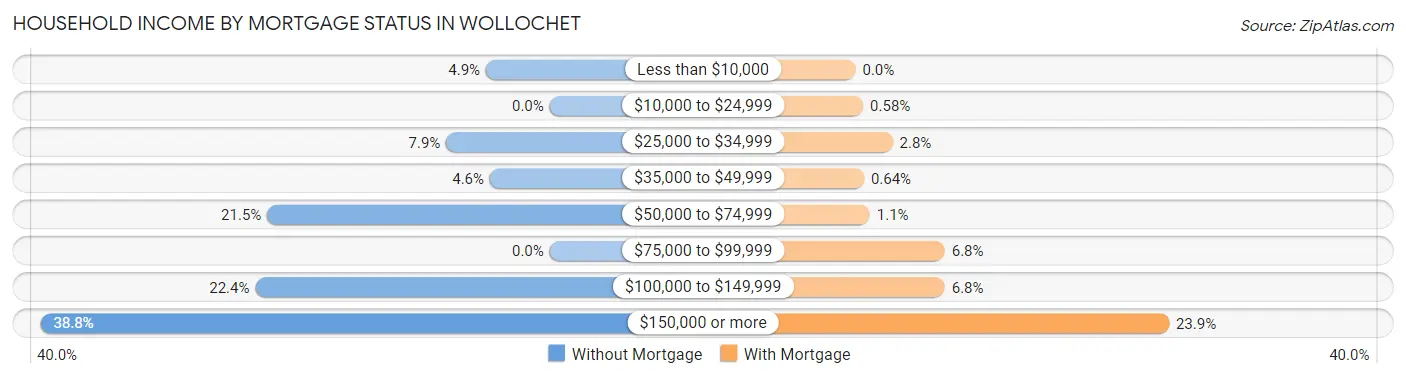
| Household Income | Without Mortgage | With Mortgage |
| Less than $10,000 | 32 (4.9%) | 0 (0.0%) |
| $10,000 to $24,999 | 0 (0.0%) | 9 (0.6%) |
| $25,000 to $34,999 | 52 (7.9%) | 44 (2.8%) |
| $35,000 to $49,999 | 30 (4.5%) | 10 (0.6%) |
| $50,000 to $74,999 | 142 (21.5%) | 17 (1.1%) |
| $75,000 to $99,999 | 0 (0.0%) | 106 (6.8%) |
| $100,000 to $149,999 | 148 (22.4%) | 106 (6.8%) |
| $150,000 or more | 256 (38.8%) | 372 (23.9%) |
| Total | 660 (100.0%) | 1,558 (100.0%) |
Property Value to Household Income Ratio in Wollochet
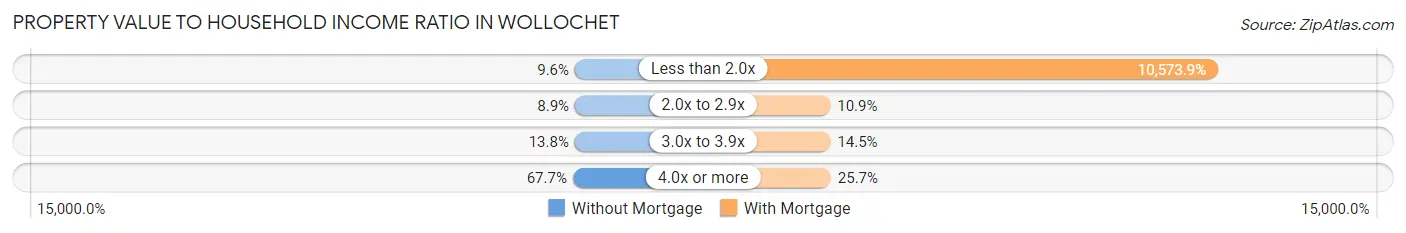
| Value-to-Income Ratio | Without Mortgage | With Mortgage |
| Less than 2.0x | 63 (9.6%) | 164,741 (10,573.9%) |
| 2.0x to 2.9x | 59 (8.9%) | 169 (10.8%) |
| 3.0x to 3.9x | 91 (13.8%) | 226 (14.5%) |
| 4.0x or more | 447 (67.7%) | 401 (25.7%) |
| Total | 660 (100.0%) | 1,558 (100.0%) |
Real Estate Taxes by Mortgage Status in Wollochet
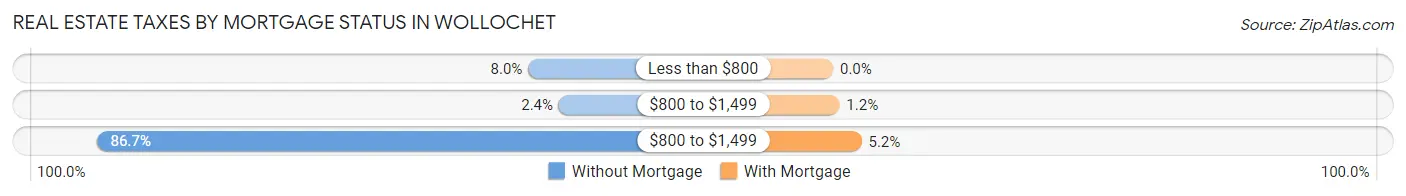
| Property Taxes | Without Mortgage | With Mortgage |
| Less than $800 | 53 (8.0%) | 0 (0.0%) |
| $800 to $1,499 | 16 (2.4%) | 18 (1.2%) |
| $800 to $1,499 | 572 (86.7%) | 81 (5.2%) |
| Total | 660 (100.0%) | 1,558 (100.0%) |
Health & Disability in Wollochet
Health Insurance Coverage by Age in Wollochet
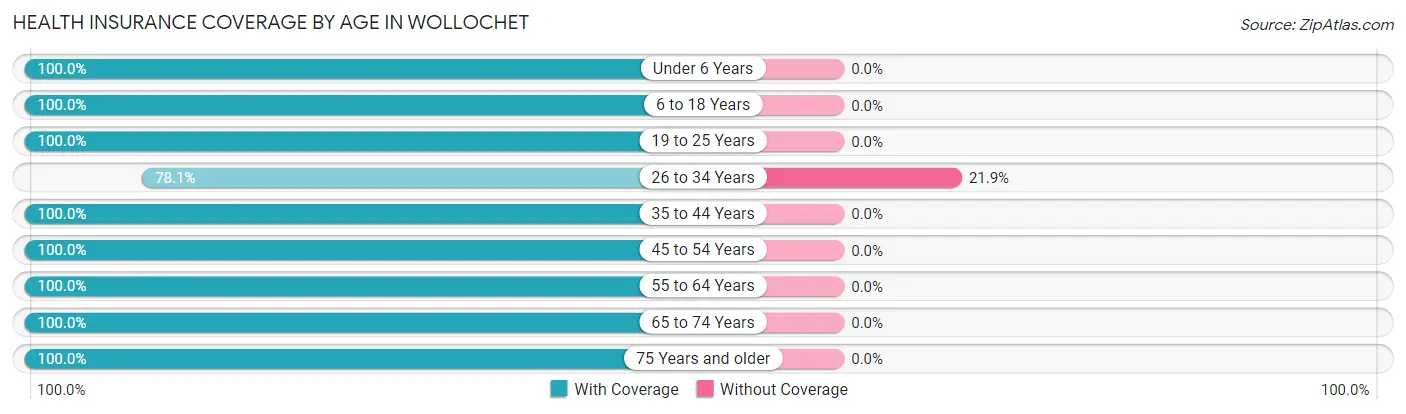
| Age Bracket | With Coverage | Without Coverage |
| Under 6 Years | 609 (100.0%) | 0 (0.0%) |
| 6 to 18 Years | 983 (100.0%) | 0 (0.0%) |
| 19 to 25 Years | 325 (100.0%) | 0 (0.0%) |
| 26 to 34 Years | 594 (78.1%) | 167 (21.9%) |
| 35 to 44 Years | 729 (100.0%) | 0 (0.0%) |
| 45 to 54 Years | 1,004 (100.0%) | 0 (0.0%) |
| 55 to 64 Years | 1,024 (100.0%) | 0 (0.0%) |
| 65 to 74 Years | 1,045 (100.0%) | 0 (0.0%) |
| 75 Years and older | 645 (100.0%) | 0 (0.0%) |
| Total | 6,958 (97.7%) | 167 (2.3%) |
Health Insurance Coverage by Citizenship Status in Wollochet
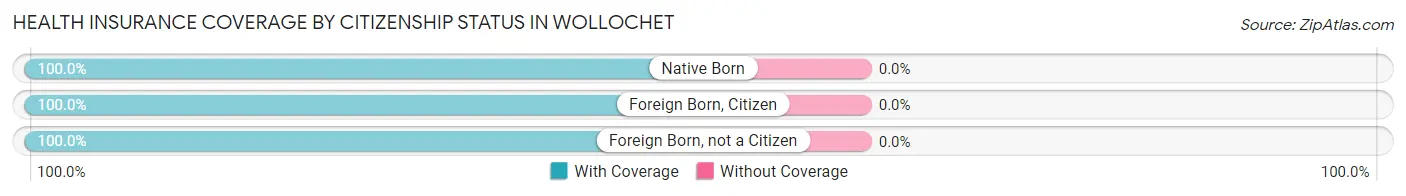
| Citizenship Status | With Coverage | Without Coverage |
| Native Born | 609 (100.0%) | 0 (0.0%) |
| Foreign Born, Citizen | 983 (100.0%) | 0 (0.0%) |
| Foreign Born, not a Citizen | 325 (100.0%) | 0 (0.0%) |
Health Insurance Coverage by Household Income in Wollochet
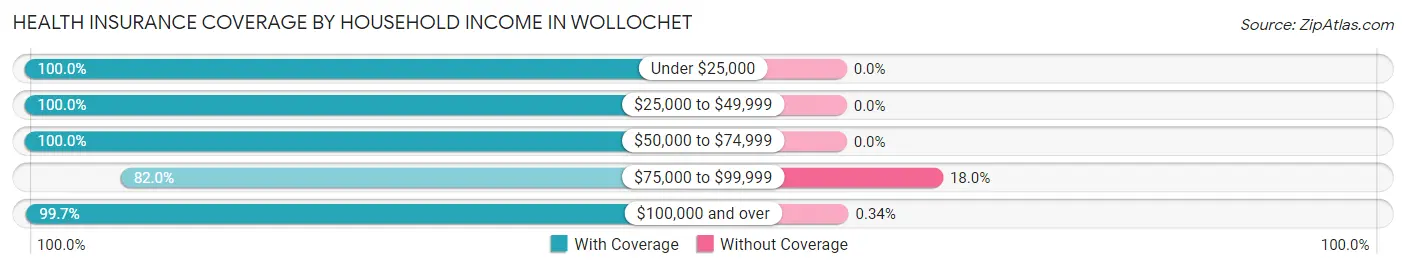
| Household Income | With Coverage | Without Coverage |
| Under $25,000 | 122 (100.0%) | 0 (0.0%) |
| $25,000 to $49,999 | 333 (100.0%) | 0 (0.0%) |
| $50,000 to $74,999 | 517 (100.0%) | 0 (0.0%) |
| $75,000 to $99,999 | 678 (82.0%) | 149 (18.0%) |
| $100,000 and over | 5,308 (99.7%) | 18 (0.3%) |
Public vs Private Health Insurance Coverage by Age in Wollochet
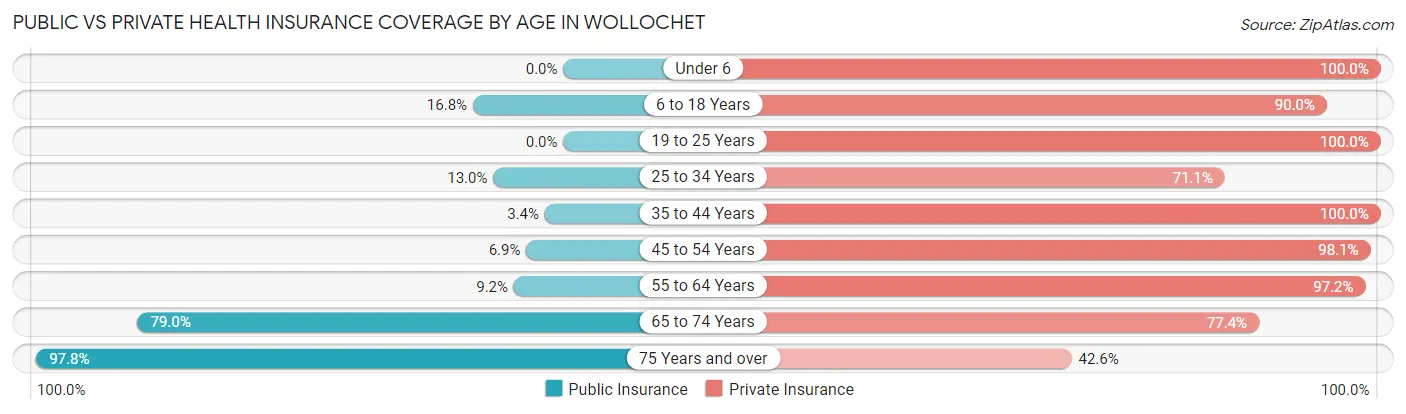
| Age Bracket | Public Insurance | Private Insurance |
| Under 6 | 0 (0.0%) | 609 (100.0%) |
| 6 to 18 Years | 165 (16.8%) | 885 (90.0%) |
| 19 to 25 Years | 0 (0.0%) | 325 (100.0%) |
| 25 to 34 Years | 99 (13.0%) | 541 (71.1%) |
| 35 to 44 Years | 25 (3.4%) | 729 (100.0%) |
| 45 to 54 Years | 69 (6.9%) | 985 (98.1%) |
| 55 to 64 Years | 94 (9.2%) | 995 (97.2%) |
| 65 to 74 Years | 826 (79.0%) | 809 (77.4%) |
| 75 Years and over | 631 (97.8%) | 275 (42.6%) |
| Total | 1,909 (26.8%) | 6,153 (86.4%) |
Disability Status by Sex by Age in Wollochet
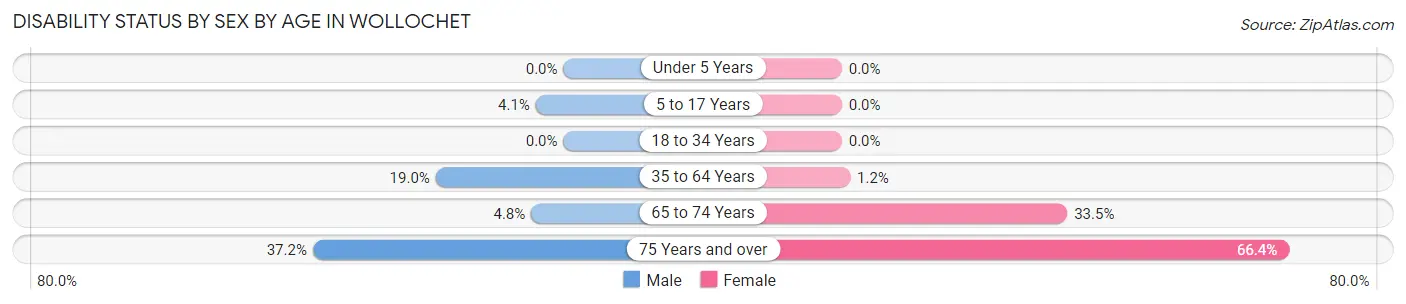
| Age Bracket | Male | Female |
| Under 5 Years | 0 (0.0%) | 0 (0.0%) |
| 5 to 17 Years | 24 (4.1%) | 0 (0.0%) |
| 18 to 34 Years | 0 (0.0%) | 0 (0.0%) |
| 35 to 64 Years | 277 (19.0%) | 16 (1.2%) |
| 65 to 74 Years | 17 (4.8%) | 231 (33.5%) |
| 75 Years and over | 96 (37.2%) | 257 (66.4%) |
Disability Class by Sex by Age in Wollochet
Disability Class: Hearing Difficulty
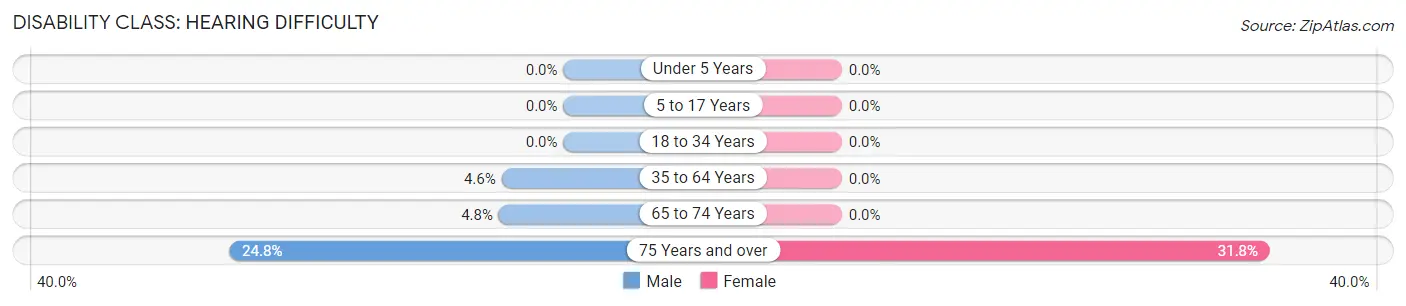
| Age Bracket | Male | Female |
| Under 5 Years | 0 (0.0%) | 0 (0.0%) |
| 5 to 17 Years | 0 (0.0%) | 0 (0.0%) |
| 18 to 34 Years | 0 (0.0%) | 0 (0.0%) |
| 35 to 64 Years | 67 (4.6%) | 0 (0.0%) |
| 65 to 74 Years | 17 (4.8%) | 0 (0.0%) |
| 75 Years and over | 64 (24.8%) | 123 (31.8%) |
Disability Class: Vision Difficulty
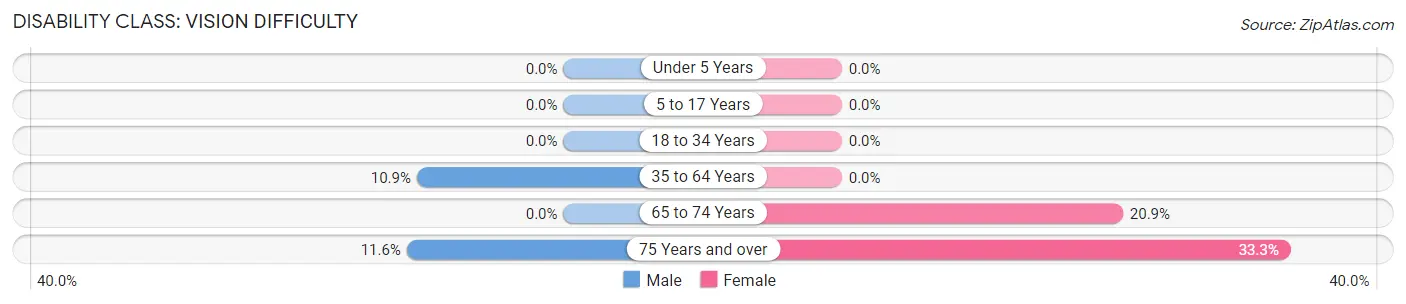
| Age Bracket | Male | Female |
| Under 5 Years | 0 (0.0%) | 0 (0.0%) |
| 5 to 17 Years | 0 (0.0%) | 0 (0.0%) |
| 18 to 34 Years | 0 (0.0%) | 0 (0.0%) |
| 35 to 64 Years | 159 (10.9%) | 0 (0.0%) |
| 65 to 74 Years | 0 (0.0%) | 144 (20.9%) |
| 75 Years and over | 30 (11.6%) | 129 (33.3%) |
Disability Class: Cognitive Difficulty
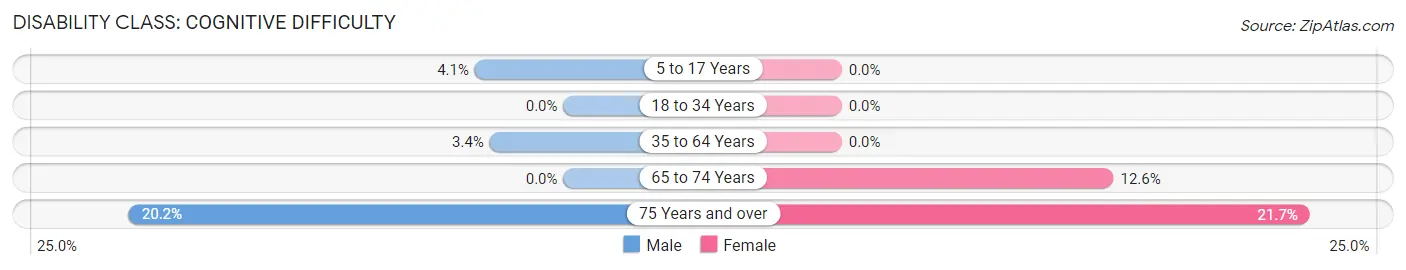
| Age Bracket | Male | Female |
| 5 to 17 Years | 24 (4.1%) | 0 (0.0%) |
| 18 to 34 Years | 0 (0.0%) | 0 (0.0%) |
| 35 to 64 Years | 50 (3.4%) | 0 (0.0%) |
| 65 to 74 Years | 0 (0.0%) | 87 (12.6%) |
| 75 Years and over | 52 (20.2%) | 84 (21.7%) |
Disability Class: Ambulatory Difficulty
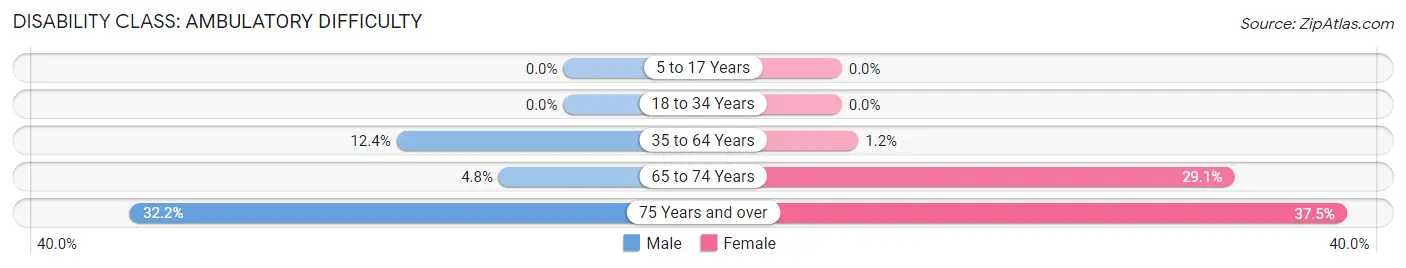
| Age Bracket | Male | Female |
| 5 to 17 Years | 0 (0.0%) | 0 (0.0%) |
| 18 to 34 Years | 0 (0.0%) | 0 (0.0%) |
| 35 to 64 Years | 181 (12.4%) | 16 (1.2%) |
| 65 to 74 Years | 17 (4.8%) | 201 (29.1%) |
| 75 Years and over | 83 (32.2%) | 145 (37.5%) |
Disability Class: Self-Care Difficulty
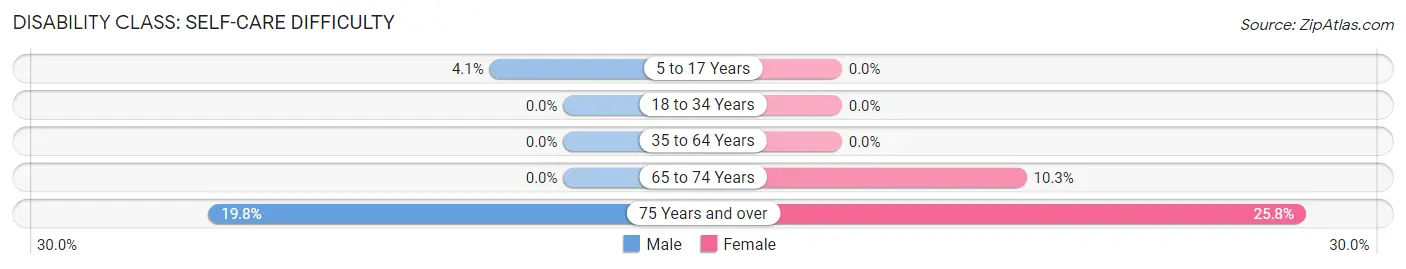
| Age Bracket | Male | Female |
| 5 to 17 Years | 24 (4.1%) | 0 (0.0%) |
| 18 to 34 Years | 0 (0.0%) | 0 (0.0%) |
| 35 to 64 Years | 0 (0.0%) | 0 (0.0%) |
| 65 to 74 Years | 0 (0.0%) | 71 (10.3%) |
| 75 Years and over | 51 (19.8%) | 100 (25.8%) |
Technology Access in Wollochet
Computing Device Access in Wollochet
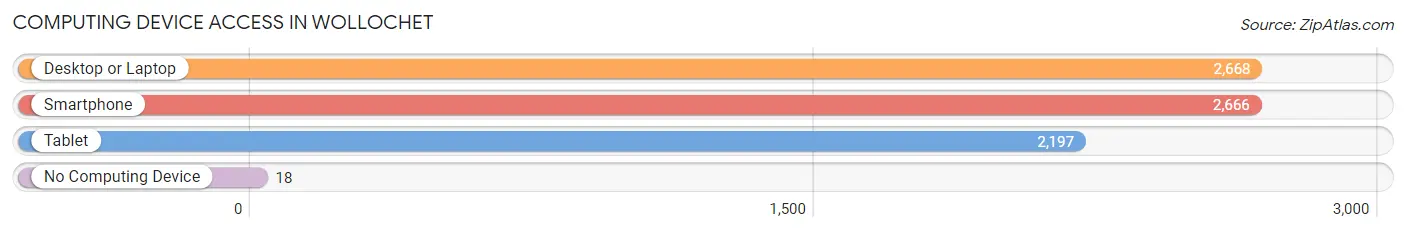
| Device Type | # Households | % Households |
| Desktop or Laptop | 2,668 | 95.2% |
| Smartphone | 2,666 | 95.1% |
| Tablet | 2,197 | 78.3% |
| No Computing Device | 18 | 0.6% |
| Total | 2,804 | 100.0% |
Internet Access in Wollochet
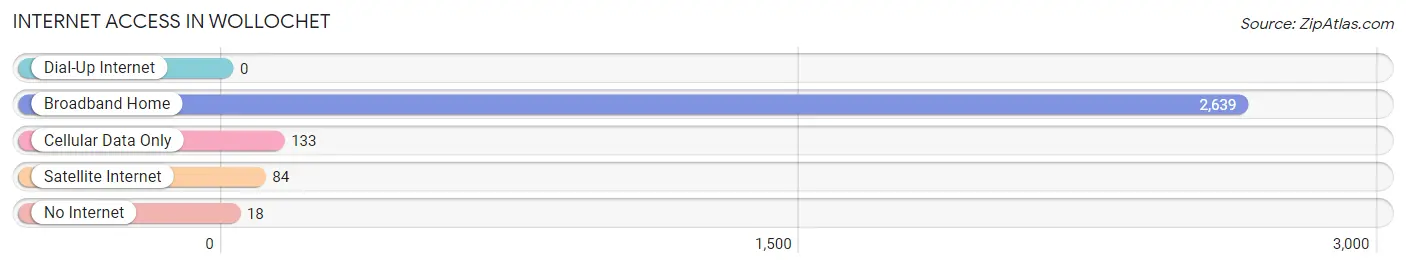
| Internet Type | # Households | % Households |
| Dial-Up Internet | 0 | 0.0% |
| Broadband Home | 2,639 | 94.1% |
| Cellular Data Only | 133 | 4.7% |
| Satellite Internet | 84 | 3.0% |
| No Internet | 18 | 0.6% |
| Total | 2,804 | 100.0% |
Wollochet Summary
Wollochet, Washington is a small unincorporated community located in Pierce County, Washington. It is situated on the shores of Puget Sound, just south of Tacoma. The population of Wollochet was estimated to be 1,845 in 2019.
History
The area now known as Wollochet was first inhabited by the Nisqually people, who lived in the area for thousands of years before the arrival of European settlers. The first European settlers arrived in the area in the mid-1800s, and the area was officially incorporated as a town in 1891. The town was named after the Wollochet Bay, which was named after a local Native American chief.
The town of Wollochet grew slowly over the years, and by the early 1900s, it had become a popular destination for tourists and vacationers. The town was home to several resorts, including the Wollochet Hotel, which was built in 1906. The hotel was a popular destination for visitors from Seattle and Tacoma, and it was a popular spot for fishing and boating.
In the 1950s, the town began to decline as the popularity of the resorts began to wane. The town was eventually annexed by the city of Tacoma in the 1970s, and it has since become a quiet residential community.
Geography
Wollochet is located in Pierce County, Washington, on the shores of Puget Sound. The town is situated just south of Tacoma, and it is bordered by the cities of Gig Harbor and University Place. The town is located in a hilly area, and it is surrounded by forests and wetlands. The town is home to several parks, including Wollochet Bay Park, which offers views of the Puget Sound and the Olympic Mountains.
Economy
The economy of Wollochet is largely based on tourism and retail. The town is home to several small businesses, including restaurants, shops, and galleries. The town is also home to several marinas, which offer boat rentals and fishing charters.
Demographics
As of 2019, the population of Wollochet was estimated to be 1,845. The town is predominantly white, with a small percentage of African American, Asian, and Hispanic residents. The median household income in Wollochet is $60,000, and the median home value is $400,000. The town has a low unemployment rate, and the majority of residents are employed in the retail and tourism industries.
Conclusion
Wollochet, Washington is a small unincorporated community located in Pierce County, Washington. It is situated on the shores of Puget Sound, just south of Tacoma. The population of Wollochet was estimated to be 1,845 in 2019. The town is predominantly white, with a small percentage of African American, Asian, and Hispanic residents. The economy of Wollochet is largely based on tourism and retail, and the town is home to several small businesses, including restaurants, shops, and galleries. The town is also home to several marinas, which offer boat rentals and fishing charters.
Common Questions
What is Per Capita Income in Wollochet?
Per Capita income in Wollochet is $65,602.
What is the Median Family Income in Wollochet?
Median Family Income in Wollochet is $152,421.
What is the Median Household income in Wollochet?
Median Household Income in Wollochet is $132,069.
What is Income or Wage Gap in Wollochet?
Income or Wage Gap in Wollochet is 55.7%.
Women in Wollochet earn 44.3 cents for every dollar earned by a man.
What is Inequality or Gini Index in Wollochet?
Inequality or Gini Index in Wollochet is 0.40.
What is the Total Population of Wollochet?
Total Population of Wollochet is 7,276.
What is the Total Male Population of Wollochet?
Total Male Population of Wollochet is 3,520.
What is the Total Female Population of Wollochet?
Total Female Population of Wollochet is 3,756.
What is the Ratio of Males per 100 Females in Wollochet?
There are 93.72 Males per 100 Females in Wollochet.
What is the Ratio of Females per 100 Males in Wollochet?
There are 106.70 Females per 100 Males in Wollochet.
What is the Median Population Age in Wollochet?
Median Population Age in Wollochet is 48.3 Years.
What is the Average Family Size in Wollochet
Average Family Size in Wollochet is 2.9 People.
What is the Average Household Size in Wollochet
Average Household Size in Wollochet is 2.6 People.
How Large is the Labor Force in Wollochet?
There are 3,908 People in the Labor Forcein in Wollochet.
What is the Percentage of People in the Labor Force in Wollochet?
66.9% of People are in the Labor Force in Wollochet.
What is the Unemployment Rate in Wollochet?
Unemployment Rate in Wollochet is 1.9%.