Easton, WA Map & Demographics
Easton Map
Easton Overview
$47,563
PER CAPITA INCOME
$61,000
AVG HOUSEHOLD INCOME
34.7%
WAGE / INCOME GAP [ % ]
65.3¢/ $1
WAGE / INCOME GAP [ $ ]
0.48
INEQUALITY / GINI INDEX
328
TOTAL POPULATION
193
MALE POPULATION
135
FEMALE POPULATION
142.96
MALES / 100 FEMALES
69.95
FEMALES / 100 MALES
53.7
MEDIAN AGE
2.4
AVG FAMILY SIZE
2.1
AVG HOUSEHOLD SIZE
178
LABOR FORCE [ PEOPLE ]
62.9%
PERCENT IN LABOR FORCE
16.9%
UNEMPLOYMENT RATE
Easton Zip Codes
Easton Area Codes
Income in Easton
Income Overview in Easton
| Characteristic | Number | Measure |
| Per Capita Income | 328 | $47,563 |
| Median Family Income | 95 | $0 |
| Mean Family Income | 95 | $120,354 |
| Median Household Income | 156 | $61,000 |
| Mean Household Income | 156 | $105,565 |
| Income Deficit | 95 | $0 |
| Wage / Income Gap (%) | 328 | 34.74% |
| Wage / Income Gap ($) | 328 | 65.26¢ per $1 |
| Gini / Inequality Index | 328 | 0.48 |
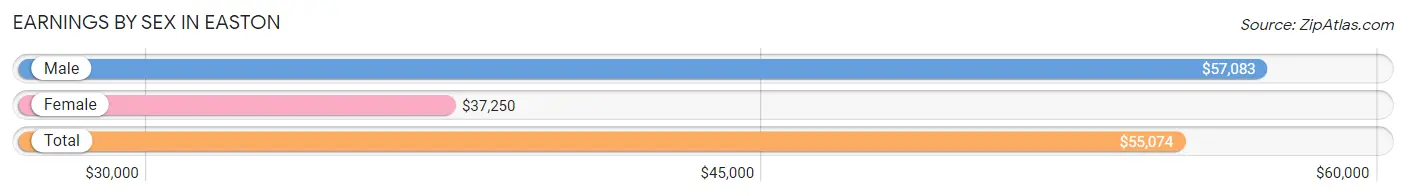
Earnings by Sex in Easton
Average Earnings in Easton are $55,074, $57,083 for men and $37,250 for women, a difference of 34.7%.
| Sex | Number | Average Earnings |
| Male | 98 (53.5%) | $57,083 |
| Female | 85 (46.5%) | $37,250 |
| Total | 183 (100.0%) | $55,074 |
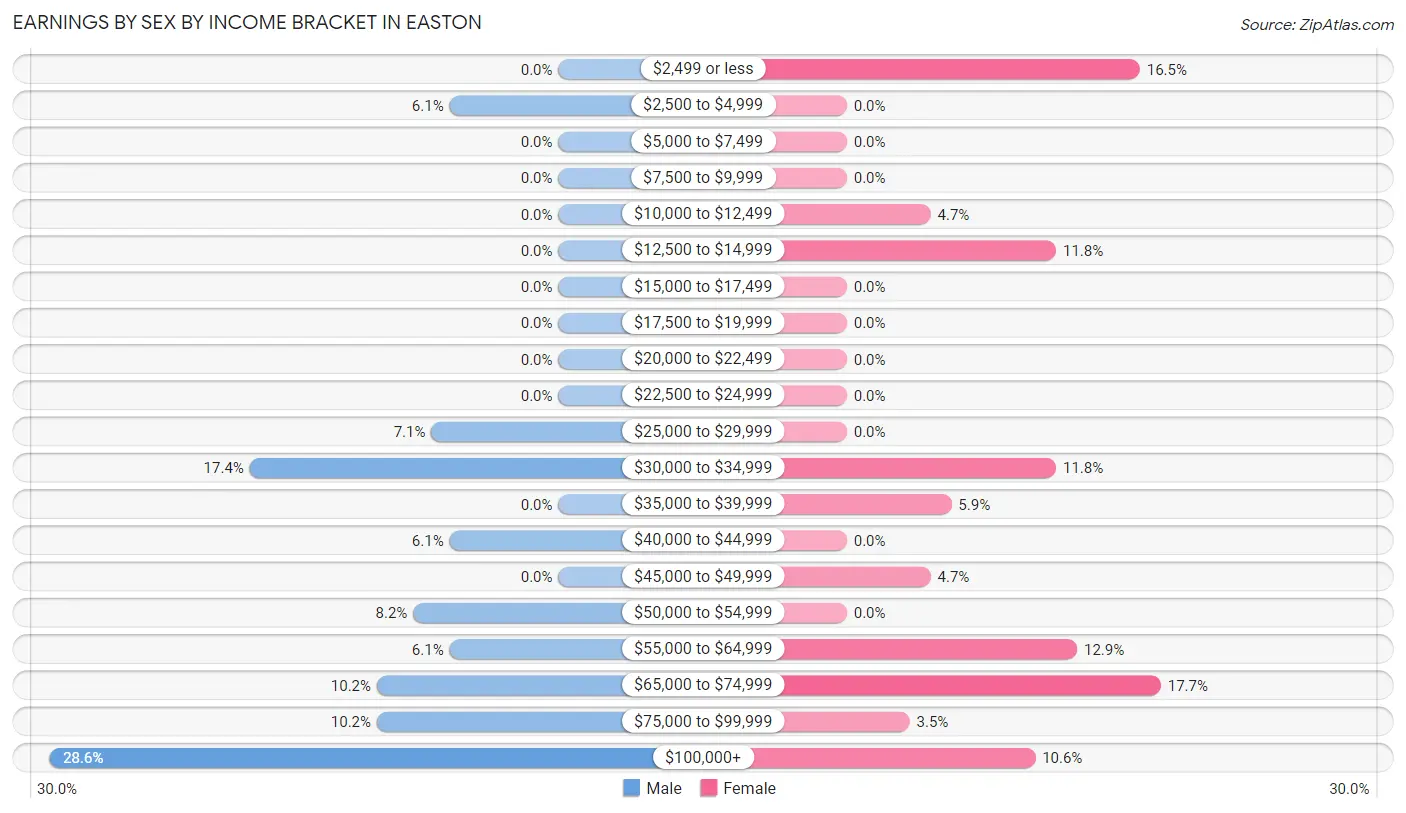
Earnings by Sex by Income Bracket in Easton
The most common earnings brackets in Easton are $100,000+ for men (28 | 28.6%) and $65,000 to $74,999 for women (15 | 17.6%).
| Income | Male | Female |
| $2,499 or less | 0 (0.0%) | 14 (16.5%) |
| $2,500 to $4,999 | 6 (6.1%) | 0 (0.0%) |
| $5,000 to $7,499 | 0 (0.0%) | 0 (0.0%) |
| $7,500 to $9,999 | 0 (0.0%) | 0 (0.0%) |
| $10,000 to $12,499 | 0 (0.0%) | 4 (4.7%) |
| $12,500 to $14,999 | 0 (0.0%) | 10 (11.8%) |
| $15,000 to $17,499 | 0 (0.0%) | 0 (0.0%) |
| $17,500 to $19,999 | 0 (0.0%) | 0 (0.0%) |
| $20,000 to $22,499 | 0 (0.0%) | 0 (0.0%) |
| $22,500 to $24,999 | 0 (0.0%) | 0 (0.0%) |
| $25,000 to $29,999 | 7 (7.1%) | 0 (0.0%) |
| $30,000 to $34,999 | 17 (17.3%) | 10 (11.8%) |
| $35,000 to $39,999 | 0 (0.0%) | 5 (5.9%) |
| $40,000 to $44,999 | 6 (6.1%) | 0 (0.0%) |
| $45,000 to $49,999 | 0 (0.0%) | 4 (4.7%) |
| $50,000 to $54,999 | 8 (8.2%) | 0 (0.0%) |
| $55,000 to $64,999 | 6 (6.1%) | 11 (12.9%) |
| $65,000 to $74,999 | 10 (10.2%) | 15 (17.6%) |
| $75,000 to $99,999 | 10 (10.2%) | 3 (3.5%) |
| $100,000+ | 28 (28.6%) | 9 (10.6%) |
| Total | 98 (100.0%) | 85 (100.0%) |
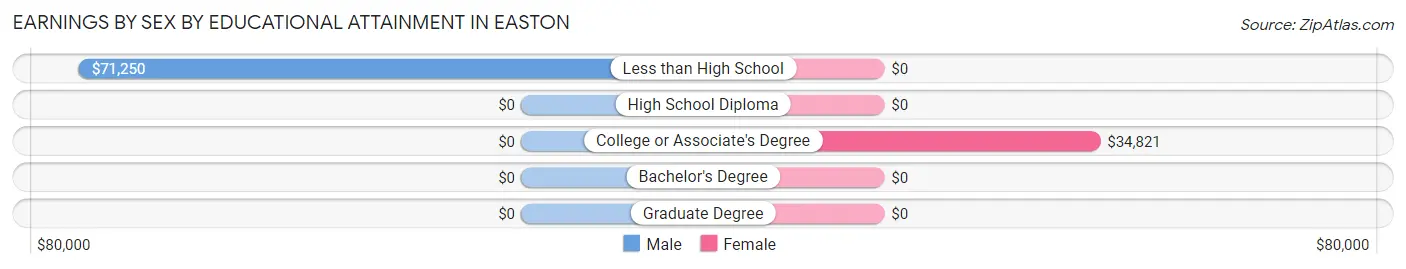
Earnings by Sex by Educational Attainment in Easton
Average earnings in Easton are $71,500 for men and $35,000 for women, a difference of 51.0%. Men with an educational attainment of less than high school enjoy the highest average annual earnings of $71,250, while those with less than high school education earn the least with $71,250. Women with an educational attainment of college or associate's degree earn the most with the average annual earnings of $34,821, while those with college or associate's degree education have the smallest earnings of $34,821.
| Educational Attainment | Male Income | Female Income |
| Less than High School | $71,250 | $0 |
| High School Diploma | - | - |
| College or Associate's Degree | - | - |
| Bachelor's Degree | - | - |
| Graduate Degree | - | - |
| Total | $71,500 | $35,000 |
Family Income in Easton
Family Income Brackets in Easton
According to the Easton family income data, there are 26 families falling into the $200,000+ income range, which is the most common income bracket and makes up 27.4% of all families.
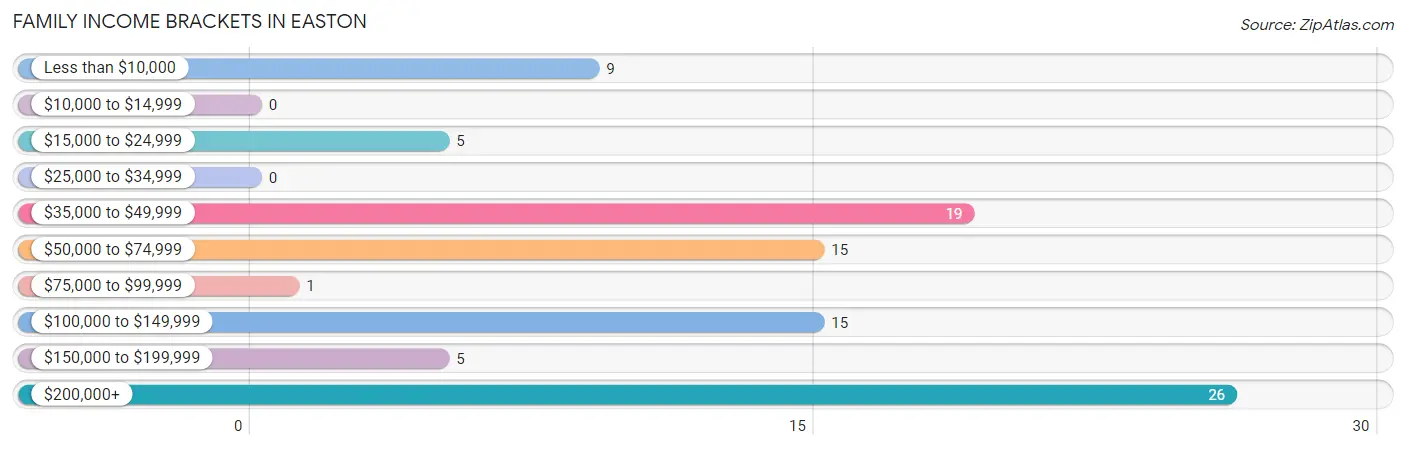
| Income Bracket | # Families | % Families |
| Less than $10,000 | 9 | 9.5% |
| $10,000 to $14,999 | 0 | 0.0% |
| $15,000 to $24,999 | 5 | 5.3% |
| $25,000 to $34,999 | 0 | 0.0% |
| $35,000 to $49,999 | 19 | 20.0% |
| $50,000 to $74,999 | 15 | 15.8% |
| $75,000 to $99,999 | 1 | 1.1% |
| $100,000 to $149,999 | 15 | 15.8% |
| $150,000 to $199,999 | 5 | 5.3% |
| $200,000+ | 26 | 27.4% |
Family Income by Famaliy Size in Easton
3-person families (20 | 21.0%) account for the highest median family income in Easton with $80,000 per family, while 3-person families (20 | 21.0%) have the highest median income of $26,667 per family member.
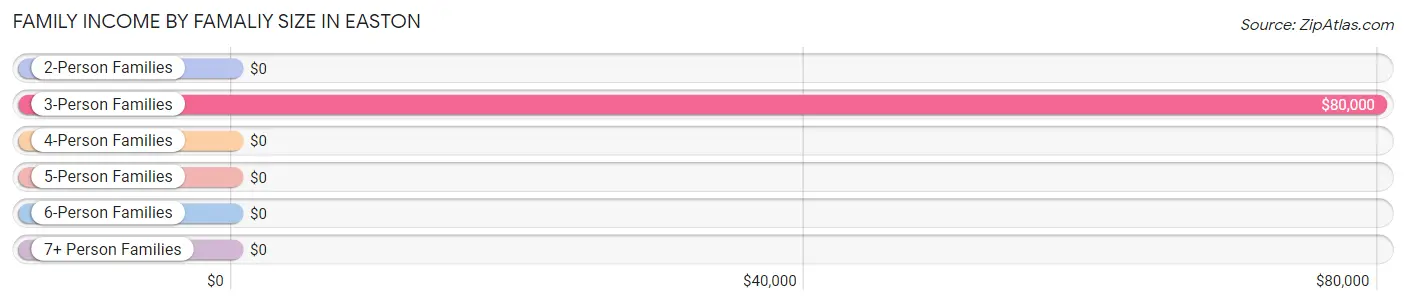
| Income Bracket | # Families | Median Income |
| 2-Person Families | 65 (68.4%) | $0 |
| 3-Person Families | 20 (21.0%) | $80,000 |
| 4-Person Families | 5 (5.3%) | $0 |
| 5-Person Families | 0 (0.0%) | $0 |
| 6-Person Families | 5 (5.3%) | $0 |
| 7+ Person Families | 0 (0.0%) | $0 |
| Total | 95 (100.0%) | $0 |
Family Income by Number of Earners in Easton
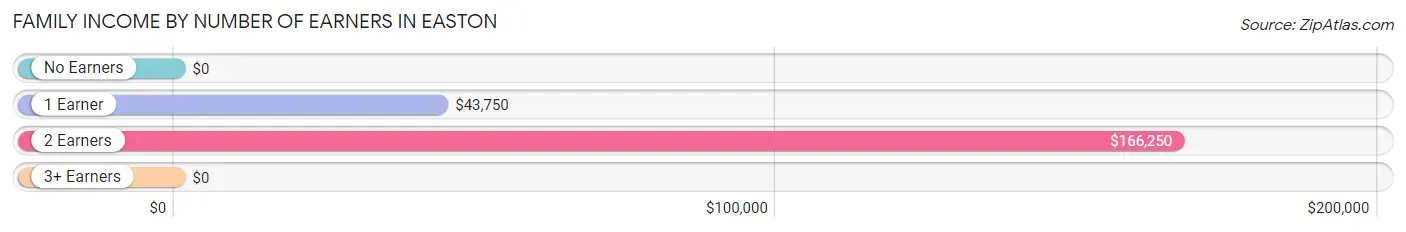
| Number of Earners | # Families | Median Income |
| No Earners | 19 (20.0%) | $0 |
| 1 Earner | 19 (20.0%) | $43,750 |
| 2 Earners | 52 (54.7%) | $166,250 |
| 3+ Earners | 5 (5.3%) | $0 |
| Total | 95 (100.0%) | $0 |
Household Income in Easton
Household Income Brackets in Easton
With 35 households falling in the category, the $200,000+ income range is the most frequent in Easton, accounting for 22.4% of all households.
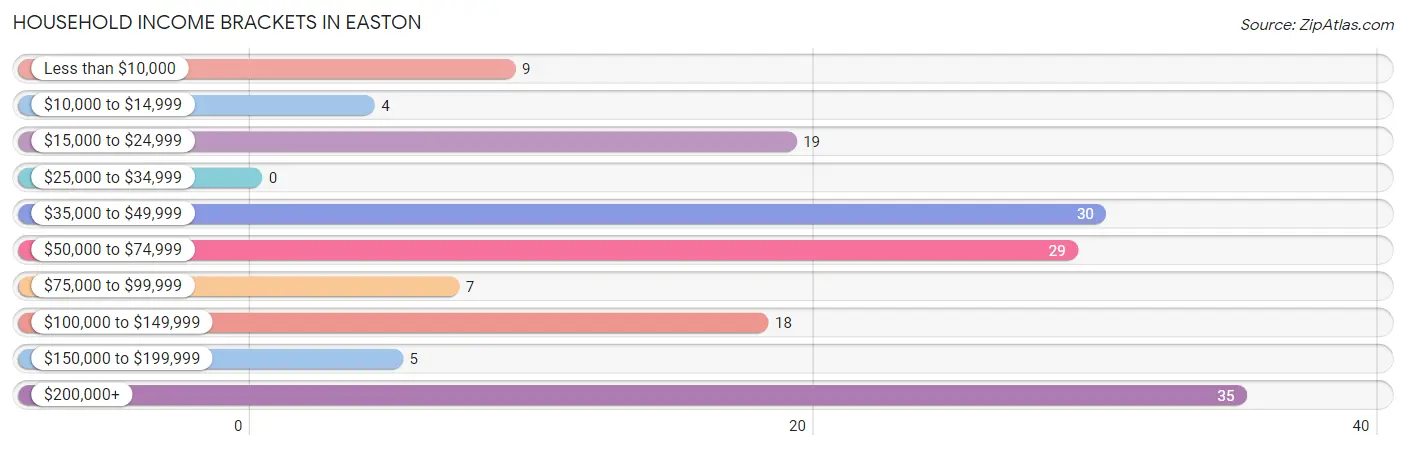
| Income Bracket | # Households | % Households |
| Less than $10,000 | 9 | 5.8% |
| $10,000 to $14,999 | 4 | 2.6% |
| $15,000 to $24,999 | 19 | 12.2% |
| $25,000 to $34,999 | 0 | 0.0% |
| $35,000 to $49,999 | 30 | 19.2% |
| $50,000 to $74,999 | 29 | 18.6% |
| $75,000 to $99,999 | 7 | 4.5% |
| $100,000 to $149,999 | 18 | 11.5% |
| $150,000 to $199,999 | 5 | 3.2% |
| $200,000+ | 35 | 22.4% |
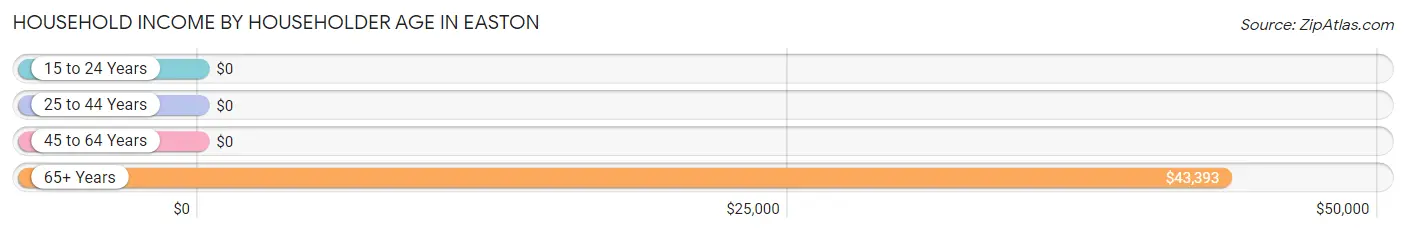
Household Income by Householder Age in Easton
The median household income in Easton is $61,000, with the highest median household income of $43,393 found in the 65+ years age bracket for the primary householder. A total of 53 households (34.0%) fall into this category. Meanwhile, the 15 to 24 years age bracket for the primary householder has the lowest median household income of $0, with 13 households (8.3%) in this group.
| Income Bracket | # Households | Median Income |
| 15 to 24 Years | 13 (8.3%) | $0 |
| 25 to 44 Years | 14 (9.0%) | $0 |
| 45 to 64 Years | 76 (48.7%) | $0 |
| 65+ Years | 53 (34.0%) | $43,393 |
| Total | 156 (100.0%) | $61,000 |
Poverty in Easton
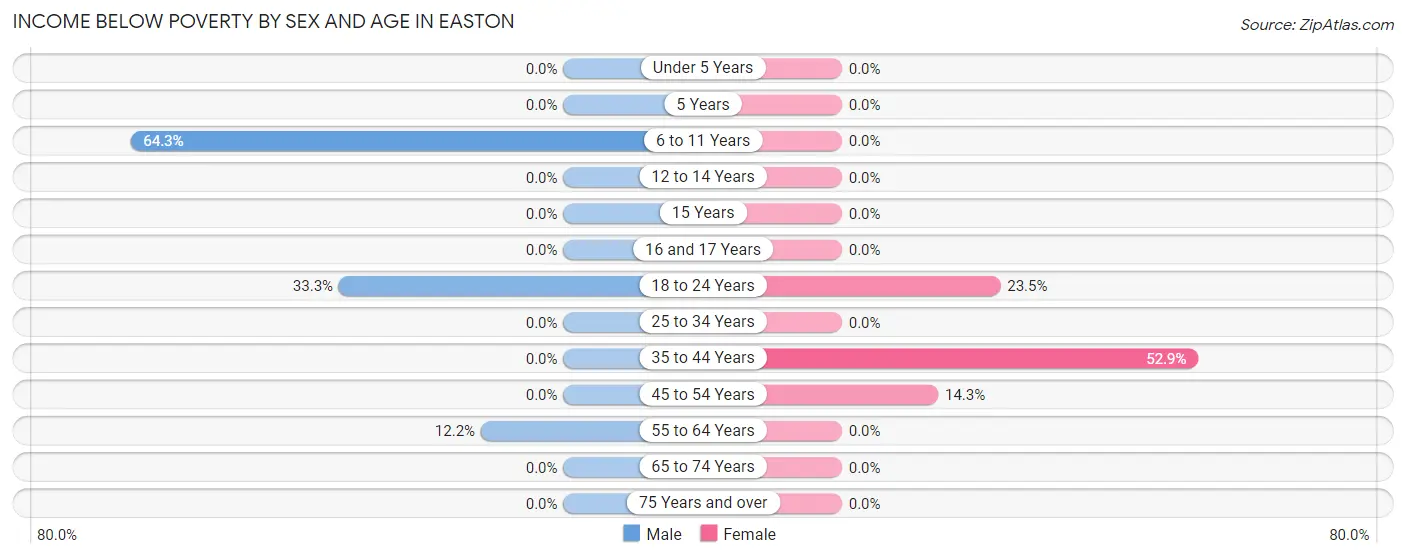
Income Below Poverty by Sex and Age in Easton
With 10.9% poverty level for males and 11.8% for females among the residents of Easton, 6 to 11 year old males and 35 to 44 year old females are the most vulnerable to poverty, with 9 males (64.3%) and 9 females (52.9%) in their respective age groups living below the poverty level.
| Age Bracket | Male | Female |
| Under 5 Years | 0 (0.0%) | 0 (0.0%) |
| 5 Years | 0 (0.0%) | 0 (0.0%) |
| 6 to 11 Years | 9 (64.3%) | 0 (0.0%) |
| 12 to 14 Years | 0 (0.0%) | 0 (0.0%) |
| 15 Years | 0 (0.0%) | 0 (0.0%) |
| 16 and 17 Years | 0 (0.0%) | 0 (0.0%) |
| 18 to 24 Years | 6 (33.3%) | 4 (23.5%) |
| 25 to 34 Years | 0 (0.0%) | 0 (0.0%) |
| 35 to 44 Years | 0 (0.0%) | 9 (52.9%) |
| 45 to 54 Years | 0 (0.0%) | 3 (14.3%) |
| 55 to 64 Years | 6 (12.2%) | 0 (0.0%) |
| 65 to 74 Years | 0 (0.0%) | 0 (0.0%) |
| 75 Years and over | 0 (0.0%) | 0 (0.0%) |
| Total | 21 (10.9%) | 16 (11.8%) |
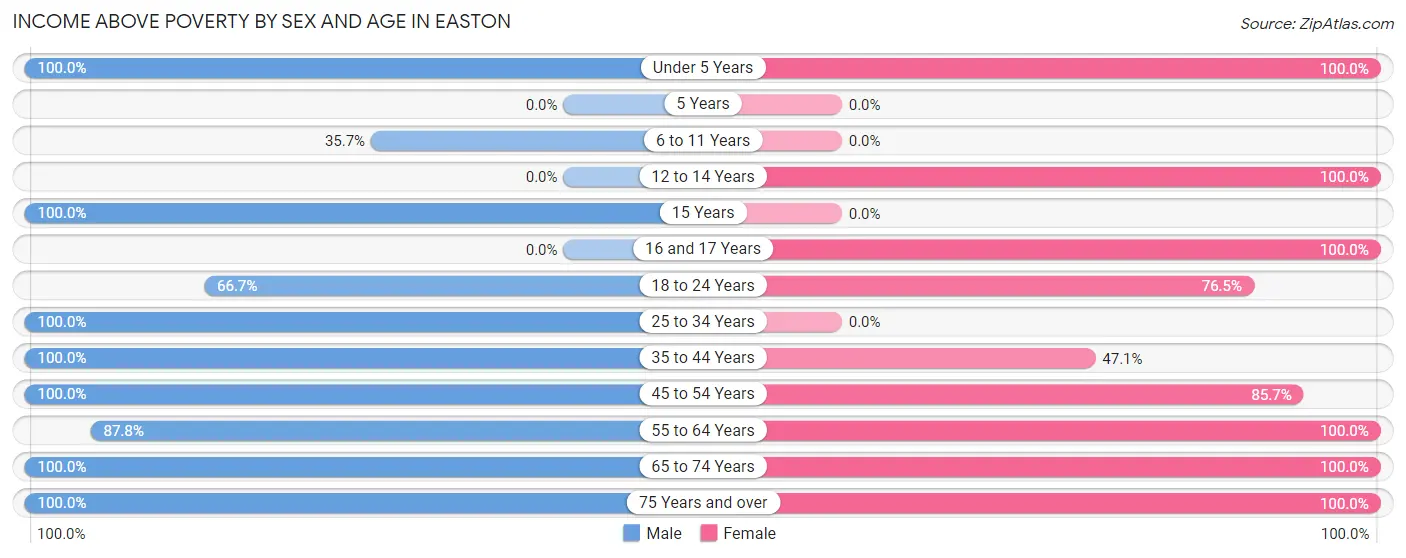
Income Above Poverty by Sex and Age in Easton
According to the poverty statistics in Easton, males aged under 5 years and females aged under 5 years are the age groups that are most secure financially, with 100.0% of males and 100.0% of females in these age groups living above the poverty line.
| Age Bracket | Male | Female |
| Under 5 Years | 12 (100.0%) | 6 (100.0%) |
| 5 Years | 0 (0.0%) | 0 (0.0%) |
| 6 to 11 Years | 5 (35.7%) | 0 (0.0%) |
| 12 to 14 Years | 0 (0.0%) | 8 (100.0%) |
| 15 Years | 5 (100.0%) | 0 (0.0%) |
| 16 and 17 Years | 0 (0.0%) | 3 (100.0%) |
| 18 to 24 Years | 12 (66.7%) | 13 (76.5%) |
| 25 to 34 Years | 11 (100.0%) | 0 (0.0%) |
| 35 to 44 Years | 11 (100.0%) | 8 (47.1%) |
| 45 to 54 Years | 27 (100.0%) | 18 (85.7%) |
| 55 to 64 Years | 43 (87.8%) | 36 (100.0%) |
| 65 to 74 Years | 21 (100.0%) | 18 (100.0%) |
| 75 Years and over | 25 (100.0%) | 9 (100.0%) |
| Total | 172 (89.1%) | 119 (88.1%) |
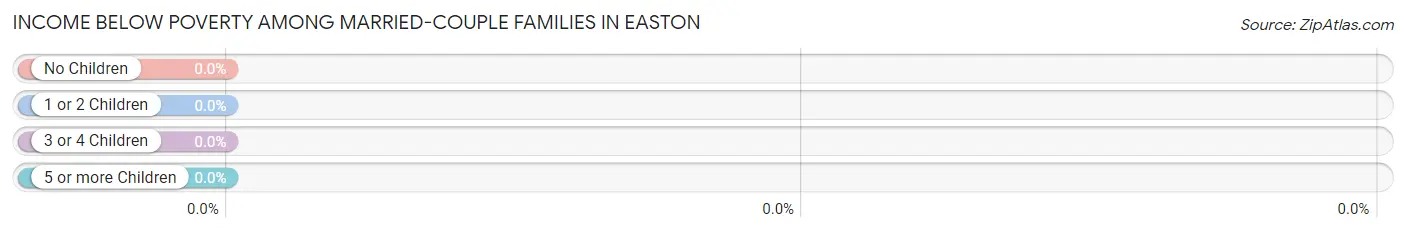
Income Below Poverty Among Married-Couple Families in Easton
| Children | Above Poverty | Below Poverty |
| No Children | 48 (100.0%) | 0 (0.0%) |
| 1 or 2 Children | 9 (100.0%) | 0 (0.0%) |
| 3 or 4 Children | 5 (100.0%) | 0 (0.0%) |
| 5 or more Children | 0 (0.0%) | 0 (0.0%) |
| Total | 62 (100.0%) | 0 (0.0%) |
Income Below Poverty Among Single-Parent Households in Easton
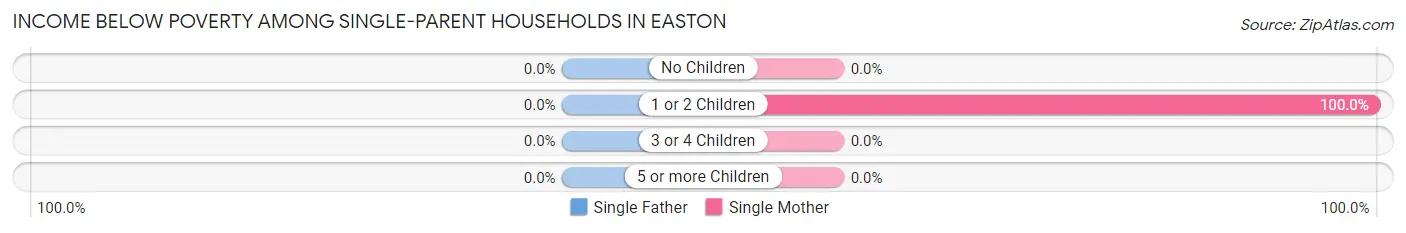
| Children | Single Father | Single Mother |
| No Children | 0 (0.0%) | 0 (0.0%) |
| 1 or 2 Children | 0 (0.0%) | 9 (100.0%) |
| 3 or 4 Children | 0 (0.0%) | 0 (0.0%) |
| 5 or more Children | 0 (0.0%) | 0 (0.0%) |
| Total | 0 (0.0%) | 9 (39.1%) |
Income Below Poverty Among Married-Couple vs Single-Parent Households in Easton
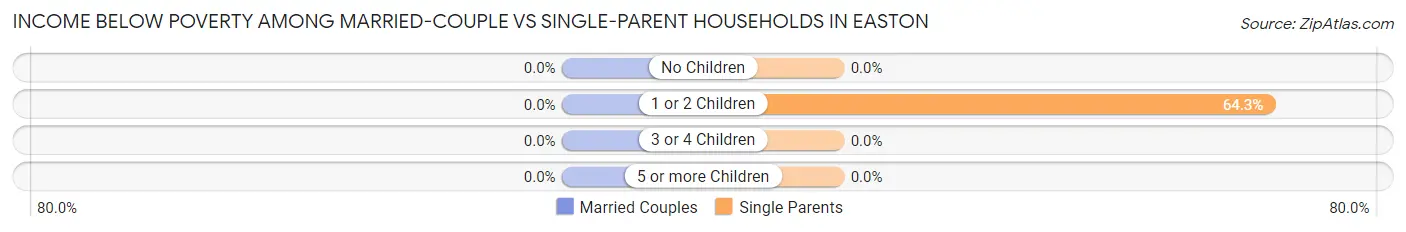
| Children | Married-Couple Families | Single-Parent Households |
| No Children | 0 (0.0%) | 0 (0.0%) |
| 1 or 2 Children | 0 (0.0%) | 9 (64.3%) |
| 3 or 4 Children | 0 (0.0%) | 0 (0.0%) |
| 5 or more Children | 0 (0.0%) | 0 (0.0%) |
| Total | 0 (0.0%) | 9 (27.3%) |
Race in Easton
The most populous races in Easton are White / Caucasian (258 | 78.7%), Two or more Races (43 | 13.1%), and Hispanic or Latino (33 | 10.1%).
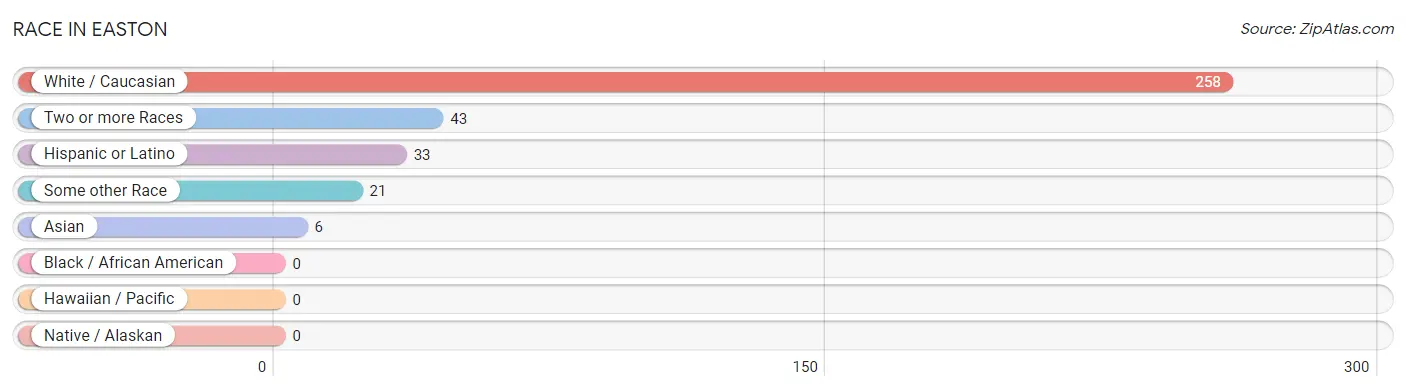
| Race | # Population | % Population |
| Asian | 6 | 1.8% |
| Black / African American | 0 | 0.0% |
| Hawaiian / Pacific | 0 | 0.0% |
| Hispanic or Latino | 33 | 10.1% |
| Native / Alaskan | 0 | 0.0% |
| White / Caucasian | 258 | 78.7% |
| Two or more Races | 43 | 13.1% |
| Some other Race | 21 | 6.4% |
| Total | 328 | 100.0% |
Ancestry in Easton
The most populous ancestries reported in Easton are European (59 | 18.0%), Irish (42 | 12.8%), Mexican (33 | 10.1%), German (32 | 9.8%), and Indian (Asian) (21 | 6.4%), together accounting for 57.0% of all Easton residents.
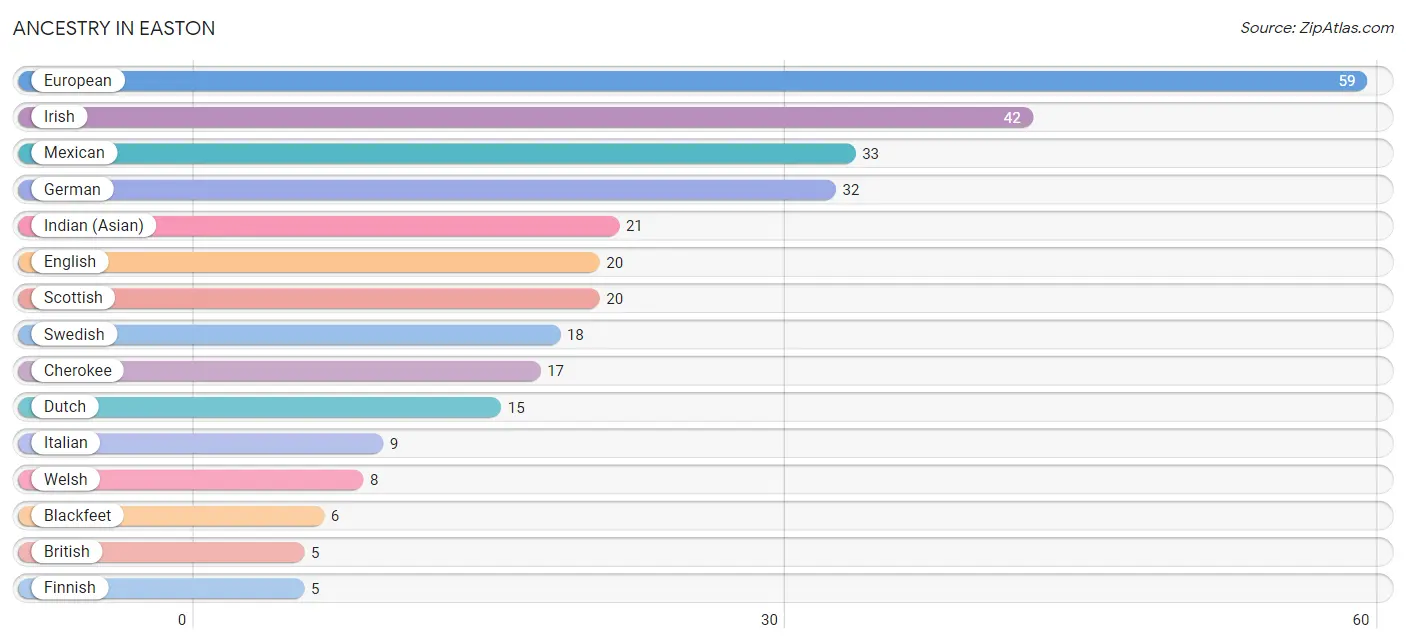
| Ancestry | # Population | % Population |
| Blackfeet | 6 | 1.8% |
| British | 5 | 1.5% |
| Canadian | 1 | 0.3% |
| Cherokee | 17 | 5.2% |
| Czech | 1 | 0.3% |
| Dutch | 15 | 4.6% |
| English | 20 | 6.1% |
| European | 59 | 18.0% |
| Finnish | 5 | 1.5% |
| German | 32 | 9.8% |
| Hungarian | 1 | 0.3% |
| Indian (Asian) | 21 | 6.4% |
| Irish | 42 | 12.8% |
| Italian | 9 | 2.7% |
| Korean | 2 | 0.6% |
| Mexican | 33 | 10.1% |
| Scotch-Irish | 4 | 1.2% |
| Scottish | 20 | 6.1% |
| Swedish | 18 | 5.5% |
| Welsh | 8 | 2.4% | View All 20 Rows |
Immigrants in Easton
The most numerous immigrant groups reported in Easton came from Central America (12 | 3.7%), Latin America (12 | 3.7%), Mexico (12 | 3.7%), Asia (8 | 2.4%), and China (6 | 1.8%), together accounting for 15.3% of all Easton residents.
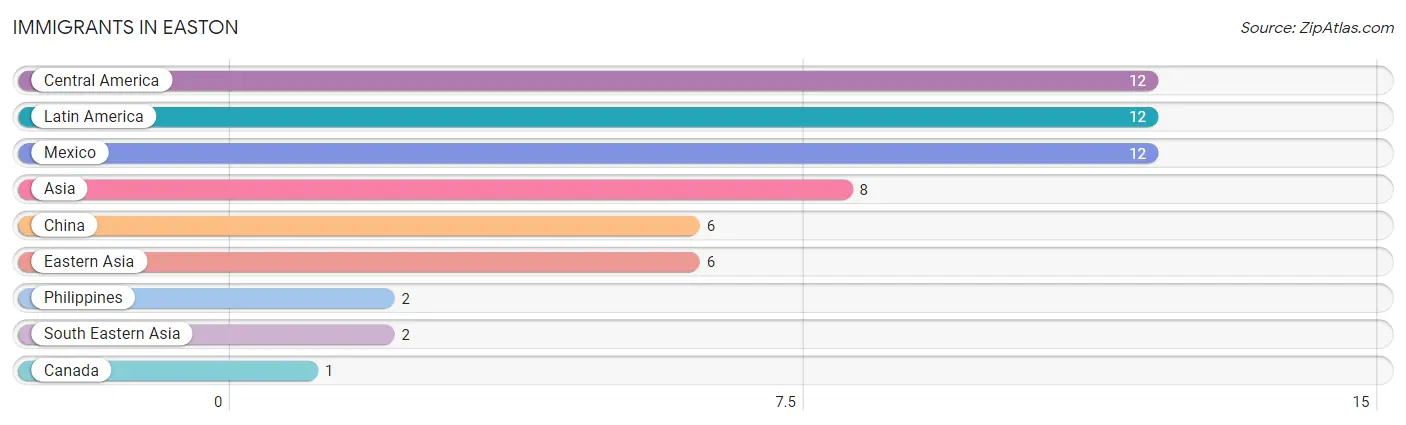
| Immigration Origin | # Population | % Population |
| Asia | 8 | 2.4% |
| Canada | 1 | 0.3% |
| Central America | 12 | 3.7% |
| China | 6 | 1.8% |
| Eastern Asia | 6 | 1.8% |
| Latin America | 12 | 3.7% |
| Mexico | 12 | 3.7% |
| Philippines | 2 | 0.6% |
| South Eastern Asia | 2 | 0.6% | View All 9 Rows |
Sex and Age in Easton
Sex and Age in Easton
The most populous age groups in Easton are 60 to 64 Years (44 | 22.8%) for men and 55 to 59 Years (22 | 16.3%) for women.
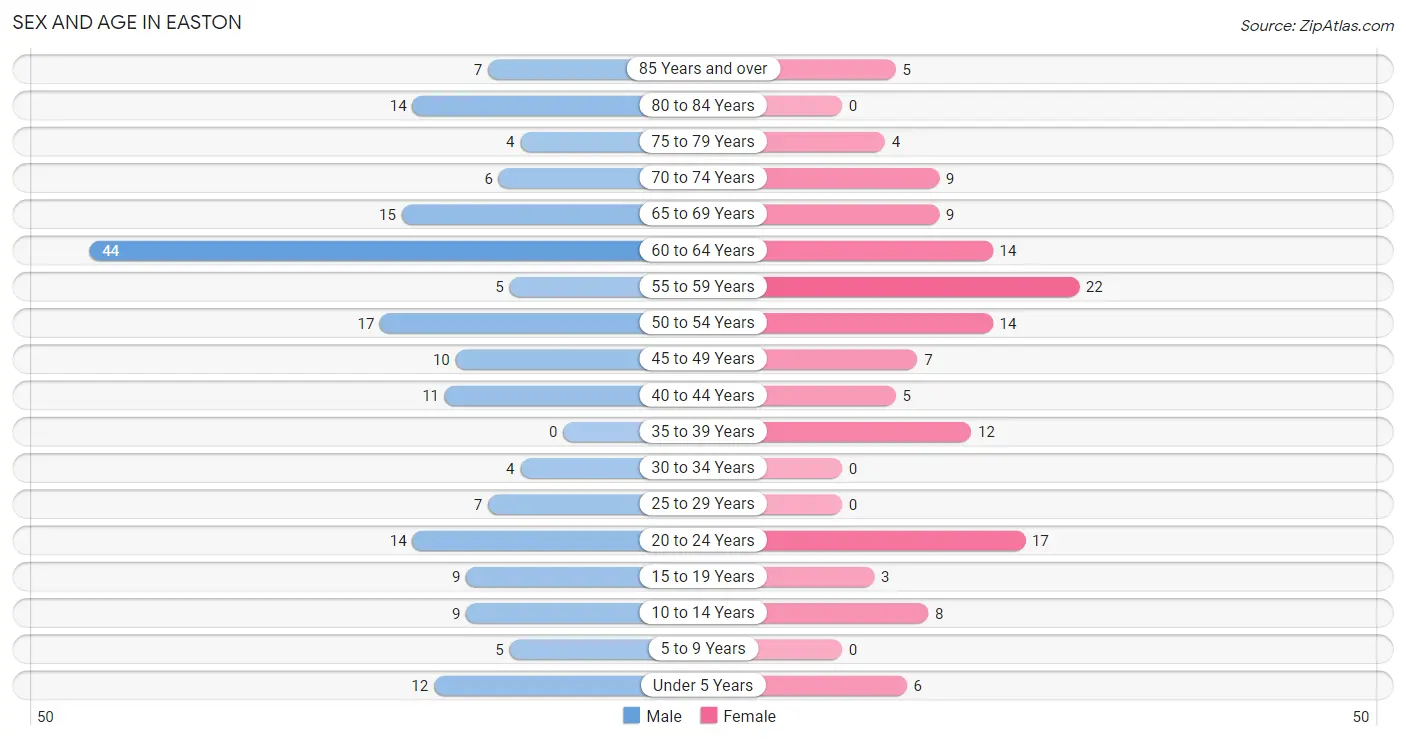
| Age Bracket | Male | Female |
| Under 5 Years | 12 (6.2%) | 6 (4.4%) |
| 5 to 9 Years | 5 (2.6%) | 0 (0.0%) |
| 10 to 14 Years | 9 (4.7%) | 8 (5.9%) |
| 15 to 19 Years | 9 (4.7%) | 3 (2.2%) |
| 20 to 24 Years | 14 (7.2%) | 17 (12.6%) |
| 25 to 29 Years | 7 (3.6%) | 0 (0.0%) |
| 30 to 34 Years | 4 (2.1%) | 0 (0.0%) |
| 35 to 39 Years | 0 (0.0%) | 12 (8.9%) |
| 40 to 44 Years | 11 (5.7%) | 5 (3.7%) |
| 45 to 49 Years | 10 (5.2%) | 7 (5.2%) |
| 50 to 54 Years | 17 (8.8%) | 14 (10.4%) |
| 55 to 59 Years | 5 (2.6%) | 22 (16.3%) |
| 60 to 64 Years | 44 (22.8%) | 14 (10.4%) |
| 65 to 69 Years | 15 (7.8%) | 9 (6.7%) |
| 70 to 74 Years | 6 (3.1%) | 9 (6.7%) |
| 75 to 79 Years | 4 (2.1%) | 4 (3.0%) |
| 80 to 84 Years | 14 (7.2%) | 0 (0.0%) |
| 85 Years and over | 7 (3.6%) | 5 (3.7%) |
| Total | 193 (100.0%) | 135 (100.0%) |
Families and Households in Easton
Median Family Size in Easton
The median family size in Easton is 2.41 persons per family, with single male/father families (10 | 10.5%) accounting for the largest median family size of 2.8 persons per family. On the other hand, single female/mother families (23 | 24.2%) represent the smallest median family size with 1.65 persons per family.
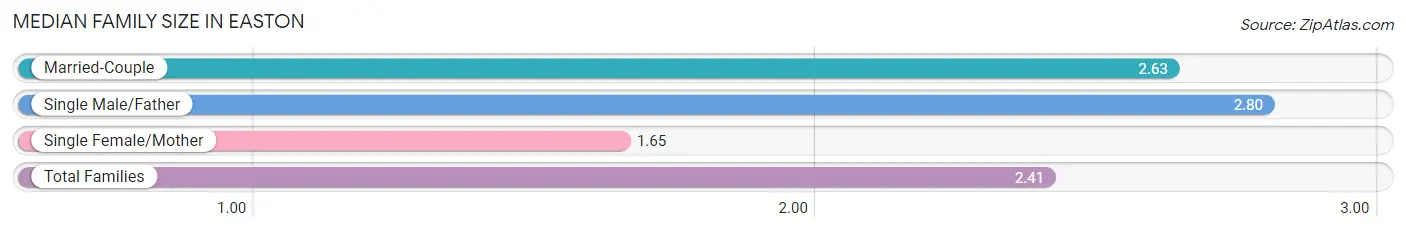
| Family Type | # Families | Family Size |
| Married-Couple | 62 (65.3%) | 2.63 |
| Single Male/Father | 10 (10.5%) | 2.80 |
| Single Female/Mother | 23 (24.2%) | 1.65 |
| Total Families | 95 (100.0%) | 2.41 |
Median Household Size in Easton
The median household size in Easton is 2.10 persons per household, with single male/father households (10 | 6.4%) accounting for the largest median household size of 2.8 persons per household. non-family households (61 | 39.1%) represent the smallest median household size with 1.31 persons per household.
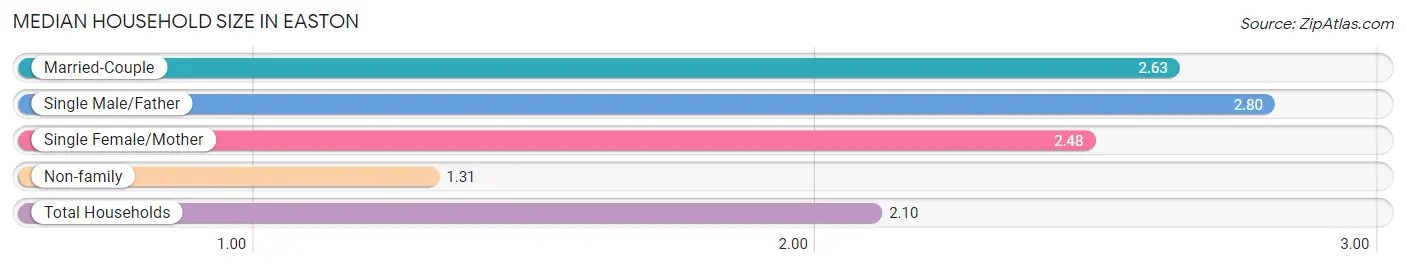
| Household Type | # Households | Household Size |
| Married-Couple | 62 (39.7%) | 2.63 |
| Single Male/Father | 10 (6.4%) | 2.80 |
| Single Female/Mother | 23 (14.7%) | 2.48 |
| Non-family | 61 (39.1%) | 1.31 |
| Total Households | 156 (100.0%) | 2.10 |
Household Size by Marriage Status in Easton
Out of a total of 156 households in Easton, 95 (60.9%) are family households, while 61 (39.1%) are nonfamily households. The most numerous type of family households are 2-person households, comprising 56, and the most common type of nonfamily households are 1-person households, comprising 45.
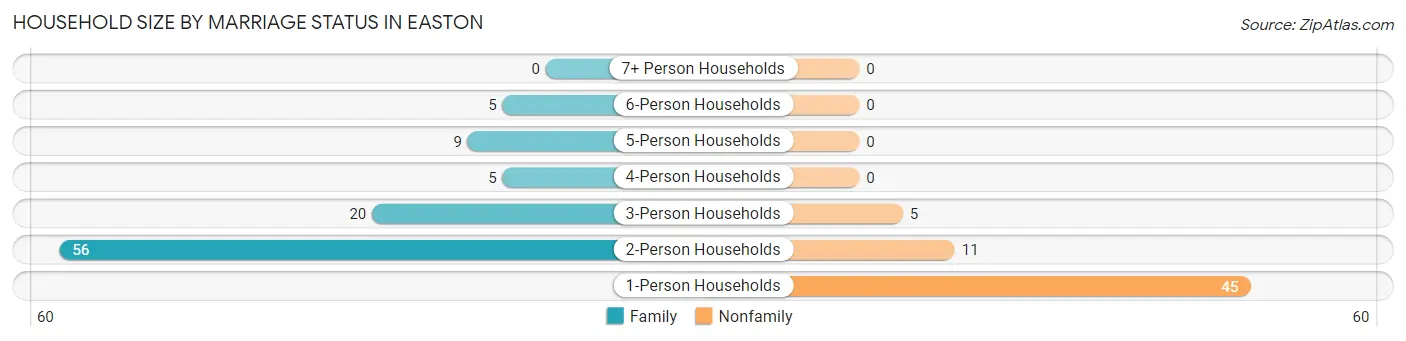
| Household Size | Family Households | Nonfamily Households |
| 1-Person Households | - | 45 (28.8%) |
| 2-Person Households | 56 (35.9%) | 11 (7.0%) |
| 3-Person Households | 20 (12.8%) | 5 (3.2%) |
| 4-Person Households | 5 (3.2%) | 0 (0.0%) |
| 5-Person Households | 9 (5.8%) | 0 (0.0%) |
| 6-Person Households | 5 (3.2%) | 0 (0.0%) |
| 7+ Person Households | 0 (0.0%) | 0 (0.0%) |
| Total | 95 (60.9%) | 61 (39.1%) |
Female Fertility in Easton
Fertility by Age in Easton
| Age Bracket | Women with Births | Births / 1,000 Women |
| 15 to 19 years | 0 (0.0%) | 0.0 |
| 20 to 34 years | 0 (0.0%) | 0.0 |
| 35 to 50 years | 0 (0.0%) | 0.0 |
| Total | 0 (0.0%) | 0.0 |
Fertility by Age by Marriage Status in Easton
| Age Bracket | Married | Unmarried |
| 15 to 19 years | 0 (0.0%) | 0 (0.0%) |
| 20 to 34 years | 0 (0.0%) | 0 (0.0%) |
| 35 to 50 years | 0 (0.0%) | 0 (0.0%) |
| Total | 0 (0.0%) | 0 (0.0%) |
Fertility by Education in Easton
| Educational Attainment | Women with Births | Births / 1,000 Women |
| Less than High School | 0 (0.0%) | 0.0 |
| High School Diploma | 0 (0.0%) | 0.0 |
| College or Associate's Degree | 0 (0.0%) | 0.0 |
| Bachelor's Degree | 0 (0.0%) | 0.0 |
| Graduate Degree | 0 (0.0%) | 0.0 |
| Total | 0 (0.0%) | 0.0 |
Fertility by Education by Marriage Status in Easton
| Educational Attainment | Married | Unmarried |
| Less than High School | 0 (0.0%) | 0 (0.0%) |
| High School Diploma | 0 (0.0%) | 0 (0.0%) |
| College or Associate's Degree | 0 (0.0%) | 0 (0.0%) |
| Bachelor's Degree | 0 (0.0%) | 0 (0.0%) |
| Graduate Degree | 0 (0.0%) | 0 (0.0%) |
| Total | 0 (0.0%) | 0 (0.0%) |
Employment Characteristics in Easton
Employment by Class of Employer in Easton
Among the 143 employed individuals in Easton, private company employees (78 | 54.5%), self-employed (incorporated) (20 | 14.0%), and local government employees (13 | 9.1%) make up the most common classes of employment.
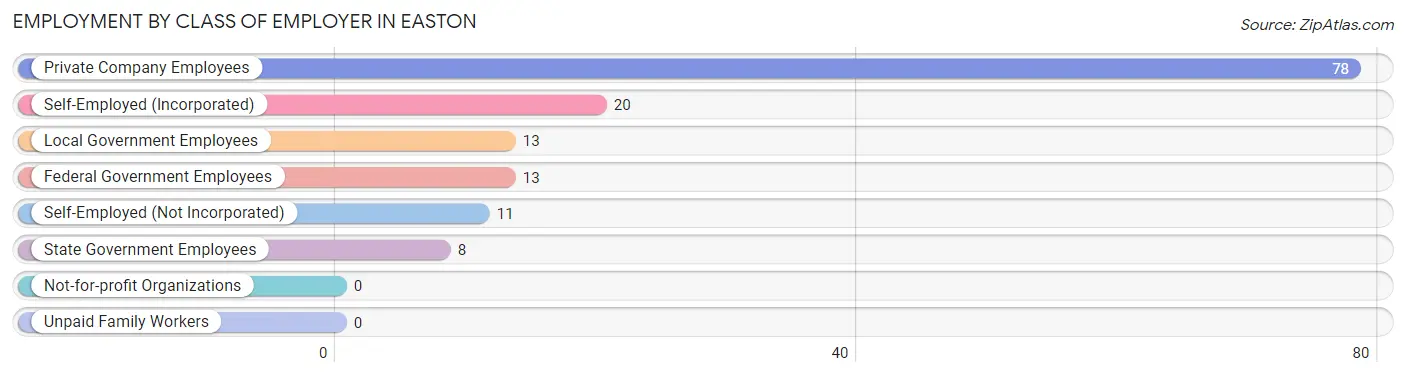
| Employer Class | # Employees | % Employees |
| Private Company Employees | 78 | 54.5% |
| Self-Employed (Incorporated) | 20 | 14.0% |
| Self-Employed (Not Incorporated) | 11 | 7.7% |
| Not-for-profit Organizations | 0 | 0.0% |
| Local Government Employees | 13 | 9.1% |
| State Government Employees | 8 | 5.6% |
| Federal Government Employees | 13 | 9.1% |
| Unpaid Family Workers | 0 | 0.0% |
| Total | 143 | 100.0% |
Employment Status by Age in Easton
According to the labor force statistics for Easton, out of the total population over 16 years of age (283), 62.9% or 178 individuals are in the labor force, with 16.9% or 30 of them unemployed. The age group with the highest labor force participation rate is 20 to 24 years, with 100.0% or 31 individuals in the labor force. Within the labor force, the 25 to 29 years age range has the highest percentage of unemployed individuals, with 100.0% or 7 of them being unemployed.
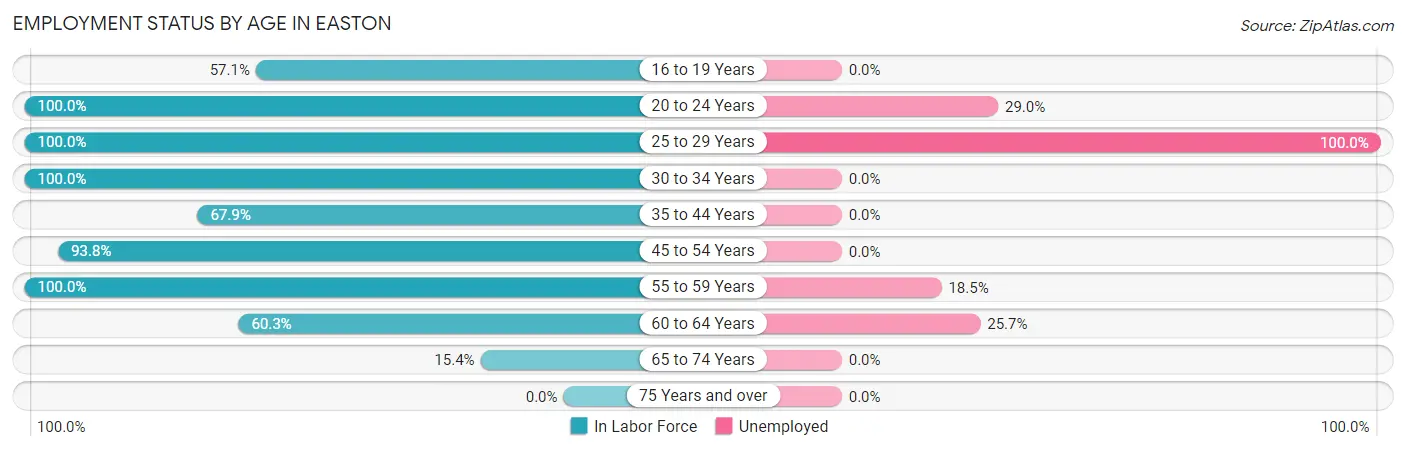
| Age Bracket | In Labor Force | Unemployed |
| 16 to 19 Years | 4 (57.1%) | 0 (0.0%) |
| 20 to 24 Years | 31 (100.0%) | 9 (29.0%) |
| 25 to 29 Years | 7 (100.0%) | 7 (100.0%) |
| 30 to 34 Years | 4 (100.0%) | 0 (0.0%) |
| 35 to 44 Years | 19 (67.9%) | 0 (0.0%) |
| 45 to 54 Years | 45 (93.8%) | 0 (0.0%) |
| 55 to 59 Years | 27 (100.0%) | 5 (18.5%) |
| 60 to 64 Years | 35 (60.3%) | 9 (25.7%) |
| 65 to 74 Years | 6 (15.4%) | 0 (0.0%) |
| 75 Years and over | 0 (0.0%) | 0 (0.0%) |
| Total | 178 (62.9%) | 30 (16.9%) |
Employment Status by Educational Attainment in Easton
According to labor force statistics for Easton, 79.7% of individuals (137) out of the total population between 25 and 64 years of age (172) are in the labor force, with 15.3% or 21 of them being unemployed. The group with the highest labor force participation rate are those with the educational attainment of bachelor's degree or higher, with 100.0% or 10 individuals in the labor force. Within the labor force, individuals with high school diploma education have the highest percentage of unemployment, with 42.0% or 21 of them being unemployed.
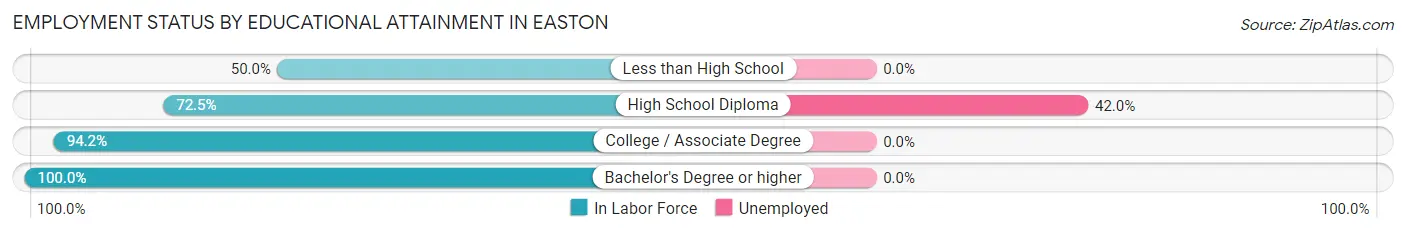
| Educational Attainment | In Labor Force | Unemployed |
| Less than High School | 12 (50.0%) | 0 (0.0%) |
| High School Diploma | 50 (72.5%) | 29 (42.0%) |
| College / Associate Degree | 65 (94.2%) | 0 (0.0%) |
| Bachelor's Degree or higher | 10 (100.0%) | 0 (0.0%) |
| Total | 137 (79.7%) | 26 (15.3%) |
Employment Occupations by Sex in Easton
Management, Business, Science and Arts Occupations
The most common Management, Business, Science and Arts occupations in Easton are Management (42 | 28.4%), Health Diagnosing & Treating (6 | 4.1%), Health Technologists (6 | 4.1%), Community & Social Service (2 | 1.3%), and Education Instruction & Library (2 | 1.3%).
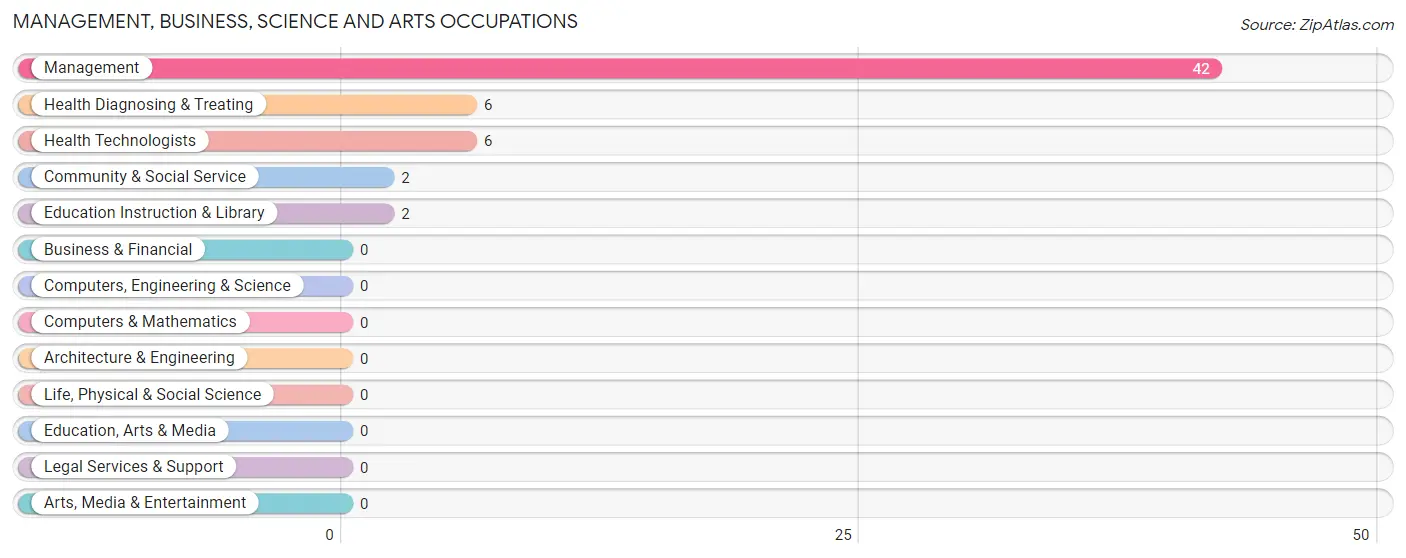
Management, Business, Science and Arts Occupations by Sex
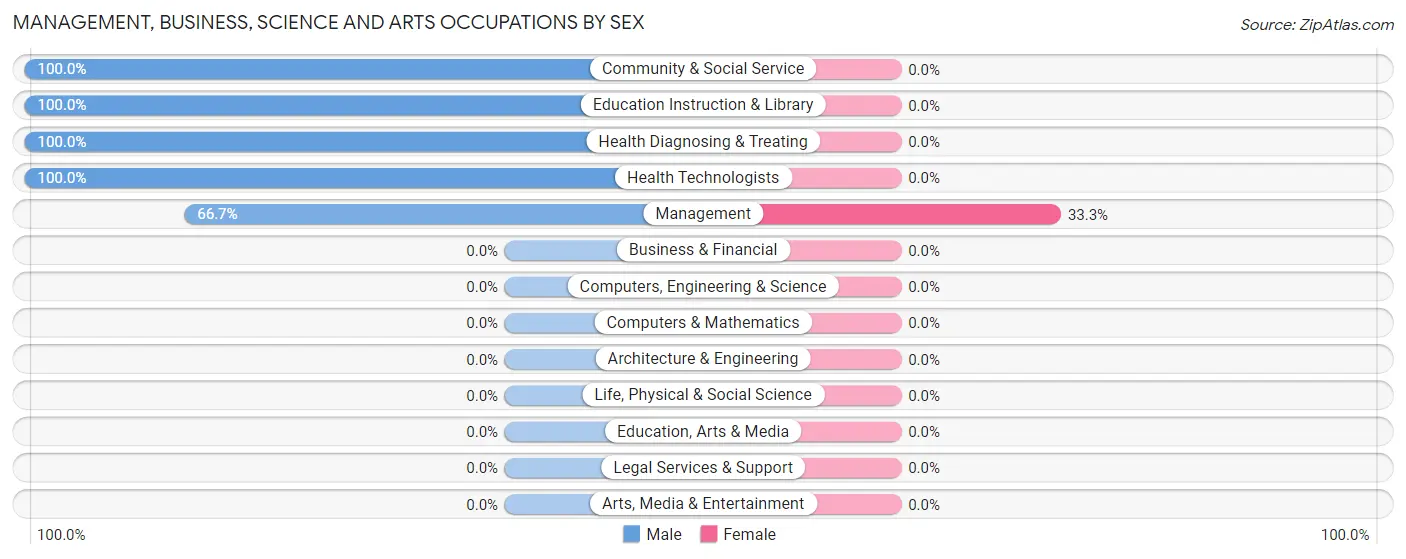
| Occupation | Male | Female |
| Management | 28 (66.7%) | 14 (33.3%) |
| Business & Financial | 0 (0.0%) | 0 (0.0%) |
| Computers, Engineering & Science | 0 (0.0%) | 0 (0.0%) |
| Computers & Mathematics | 0 (0.0%) | 0 (0.0%) |
| Architecture & Engineering | 0 (0.0%) | 0 (0.0%) |
| Life, Physical & Social Science | 0 (0.0%) | 0 (0.0%) |
| Community & Social Service | 2 (100.0%) | 0 (0.0%) |
| Education, Arts & Media | 0 (0.0%) | 0 (0.0%) |
| Legal Services & Support | 0 (0.0%) | 0 (0.0%) |
| Education Instruction & Library | 2 (100.0%) | 0 (0.0%) |
| Arts, Media & Entertainment | 0 (0.0%) | 0 (0.0%) |
| Health Diagnosing & Treating | 6 (100.0%) | 0 (0.0%) |
| Health Technologists | 6 (100.0%) | 0 (0.0%) |
| Total (Category) | 36 (72.0%) | 14 (28.0%) |
| Total (Overall) | 86 (58.1%) | 62 (41.9%) |
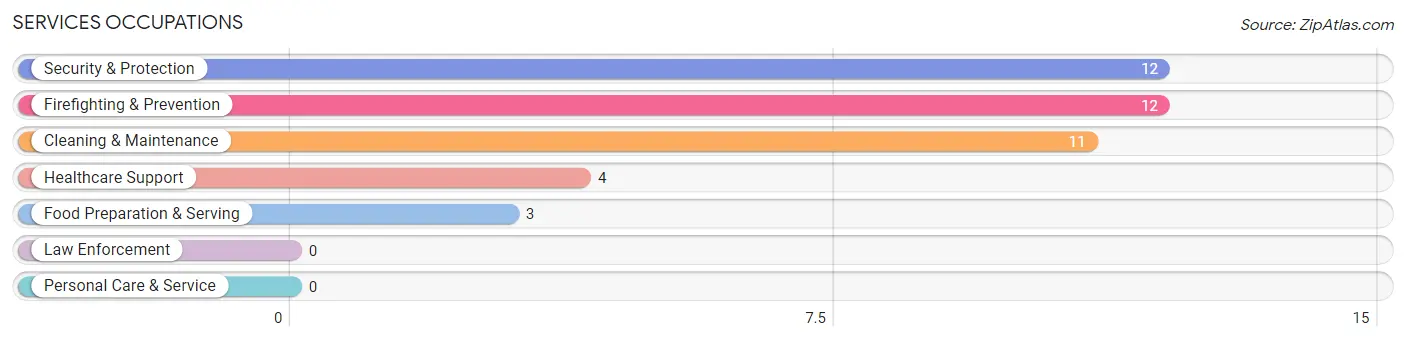
Services Occupations
The most common Services occupations in Easton are Security & Protection (12 | 8.1%), Firefighting & Prevention (12 | 8.1%), Cleaning & Maintenance (11 | 7.4%), Healthcare Support (4 | 2.7%), and Food Preparation & Serving (3 | 2.0%).
Services Occupations by Sex
Within the Services occupations in Easton, the most male-oriented occupations are Security & Protection (66.7%), Firefighting & Prevention (66.7%), and Cleaning & Maintenance (54.5%), while the most female-oriented occupations are Healthcare Support (100.0%), Food Preparation & Serving (100.0%), and Cleaning & Maintenance (45.5%).
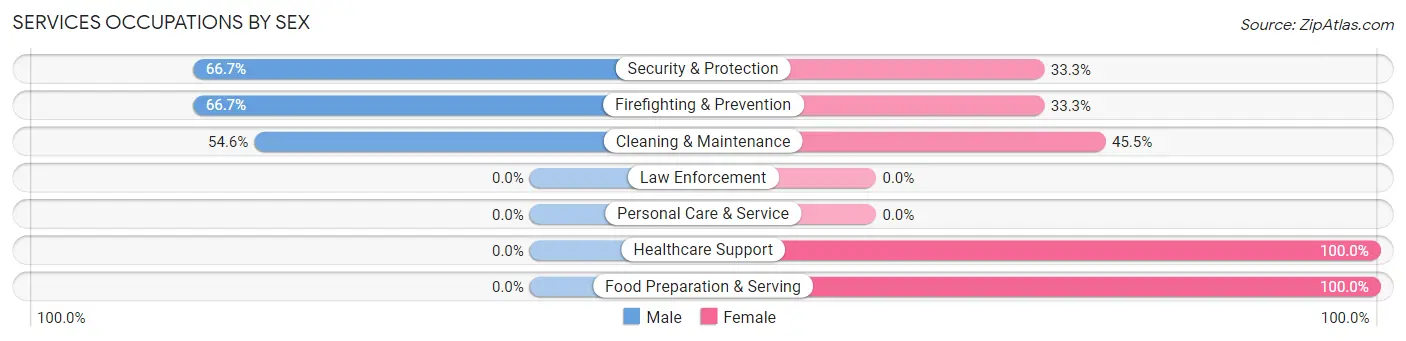
| Occupation | Male | Female |
| Healthcare Support | 0 (0.0%) | 4 (100.0%) |
| Security & Protection | 8 (66.7%) | 4 (33.3%) |
| Firefighting & Prevention | 8 (66.7%) | 4 (33.3%) |
| Law Enforcement | 0 (0.0%) | 0 (0.0%) |
| Food Preparation & Serving | 0 (0.0%) | 3 (100.0%) |
| Cleaning & Maintenance | 6 (54.5%) | 5 (45.5%) |
| Personal Care & Service | 0 (0.0%) | 0 (0.0%) |
| Total (Category) | 14 (46.7%) | 16 (53.3%) |
| Total (Overall) | 86 (58.1%) | 62 (41.9%) |
Sales and Office Occupations
The most common Sales and Office occupations in Easton are Sales & Related (12 | 8.1%), and Office & Administration (11 | 7.4%).
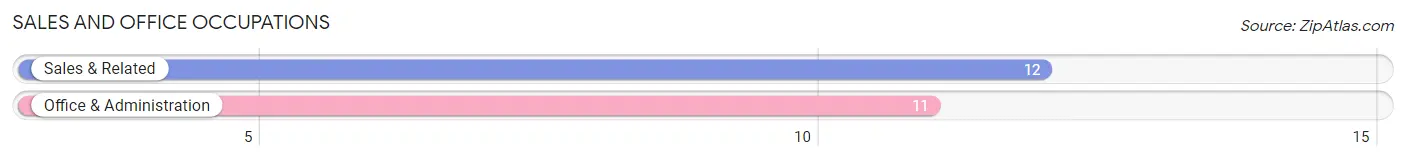
Sales and Office Occupations by Sex
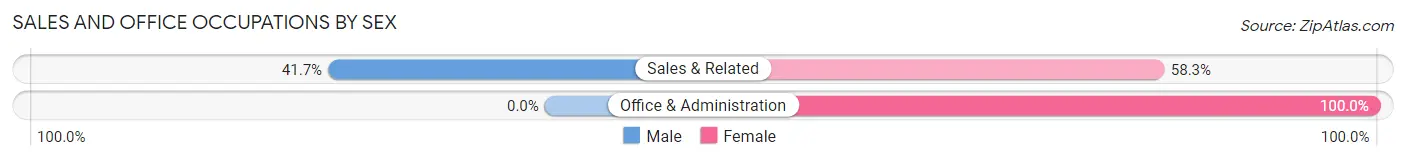
| Occupation | Male | Female |
| Sales & Related | 5 (41.7%) | 7 (58.3%) |
| Office & Administration | 0 (0.0%) | 11 (100.0%) |
| Total (Category) | 5 (21.7%) | 18 (78.3%) |
| Total (Overall) | 86 (58.1%) | 62 (41.9%) |
Natural Resources, Construction and Maintenance Occupations
The most common Natural Resources, Construction and Maintenance occupations in Easton are , and Construction & Extraction (10 | 6.8%).
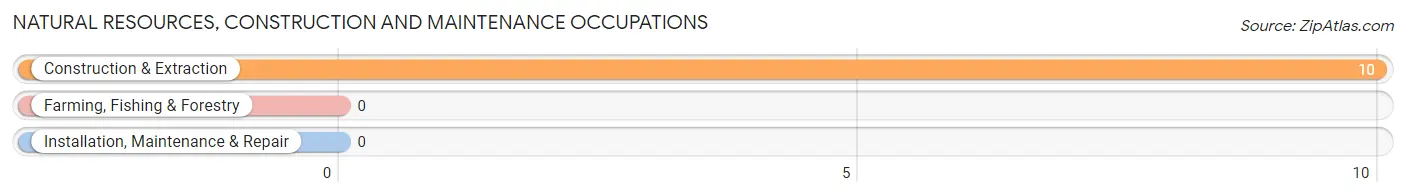
Natural Resources, Construction and Maintenance Occupations by Sex
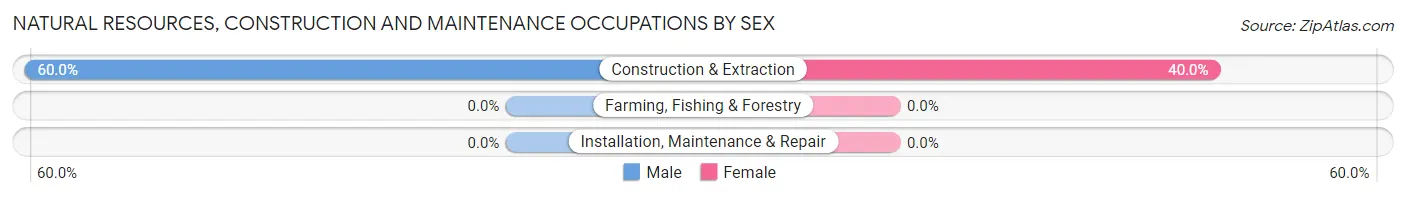
| Occupation | Male | Female |
| Farming, Fishing & Forestry | 0 (0.0%) | 0 (0.0%) |
| Construction & Extraction | 6 (60.0%) | 4 (40.0%) |
| Installation, Maintenance & Repair | 0 (0.0%) | 0 (0.0%) |
| Total (Category) | 6 (60.0%) | 4 (40.0%) |
| Total (Overall) | 86 (58.1%) | 62 (41.9%) |
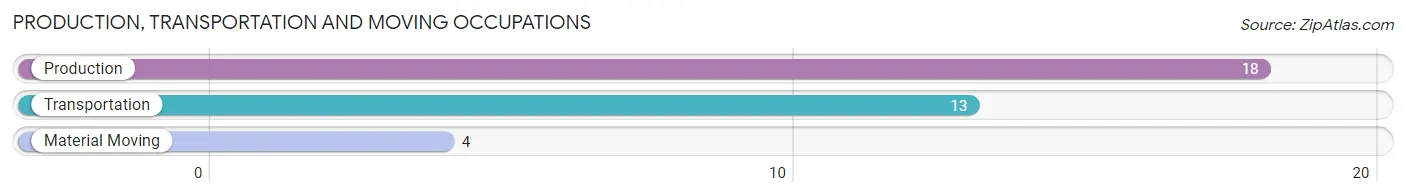
Production, Transportation and Moving Occupations
The most common Production, Transportation and Moving occupations in Easton are Production (18 | 12.2%), Transportation (13 | 8.8%), and Material Moving (4 | 2.7%).
Production, Transportation and Moving Occupations by Sex
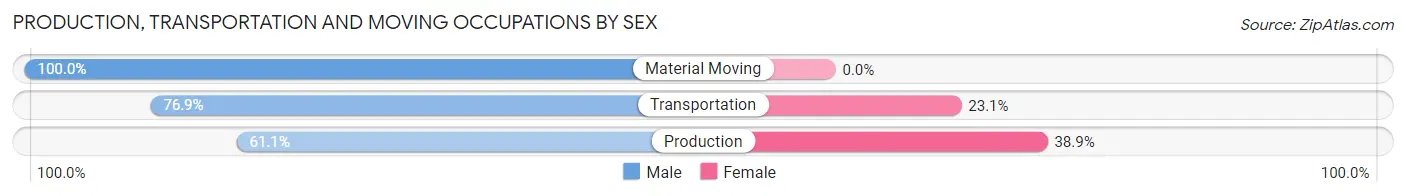
| Occupation | Male | Female |
| Production | 11 (61.1%) | 7 (38.9%) |
| Transportation | 10 (76.9%) | 3 (23.1%) |
| Material Moving | 4 (100.0%) | 0 (0.0%) |
| Total (Category) | 25 (71.4%) | 10 (28.6%) |
| Total (Overall) | 86 (58.1%) | 62 (41.9%) |
Employment Industries by Sex in Easton
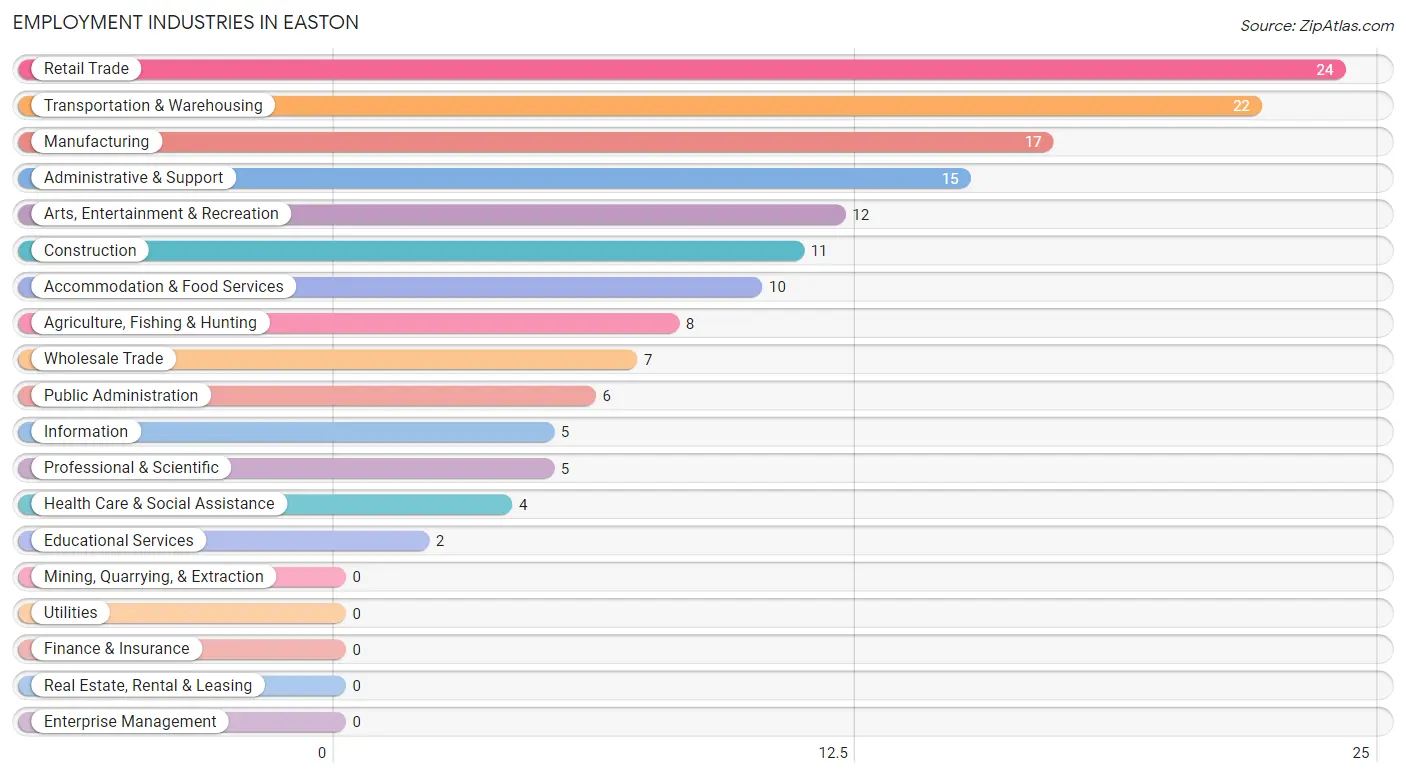
Employment Industries in Easton
The major employment industries in Easton include Retail Trade (24 | 16.2%), Transportation & Warehousing (22 | 14.9%), Manufacturing (17 | 11.5%), Administrative & Support (15 | 10.1%), and Arts, Entertainment & Recreation (12 | 8.1%).
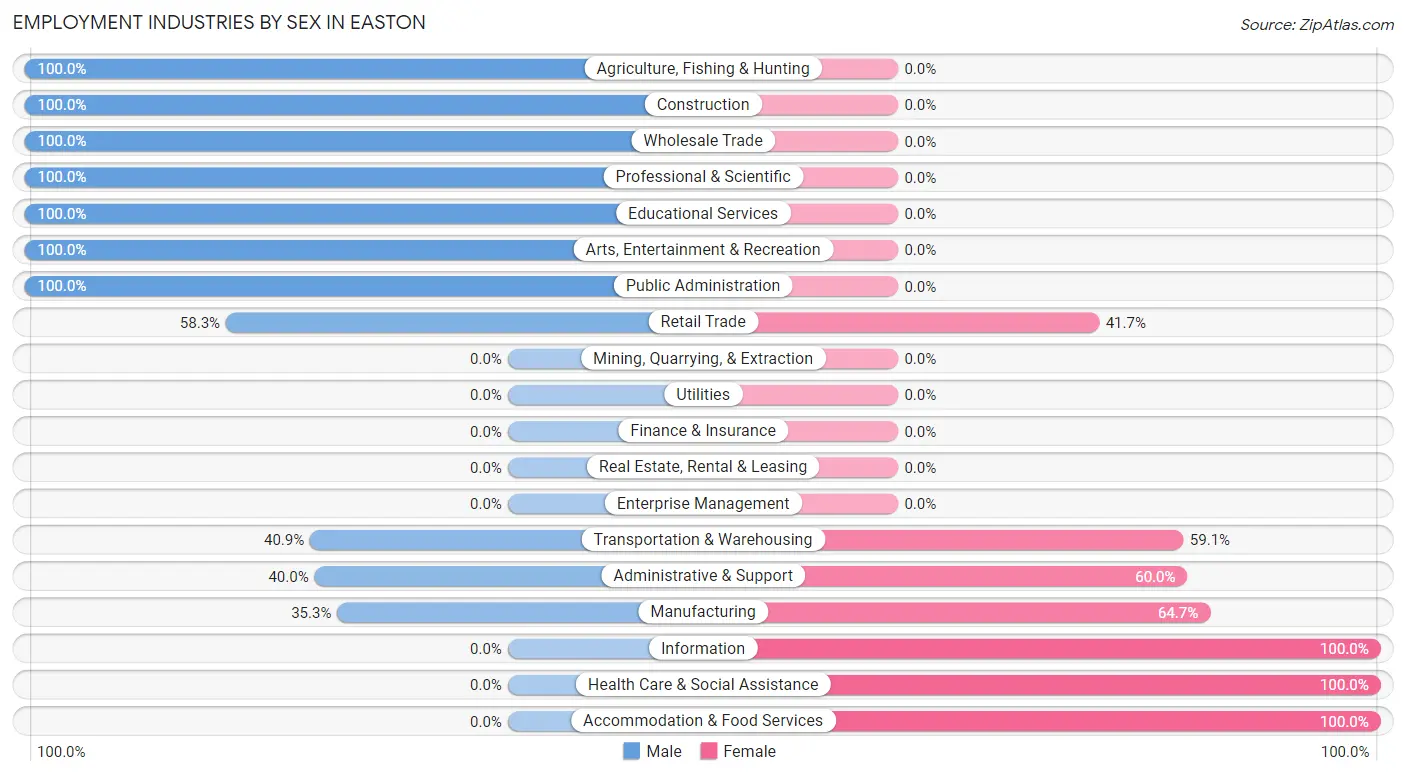
Employment Industries by Sex in Easton
The Easton industries that see more men than women are Agriculture, Fishing & Hunting (100.0%), Construction (100.0%), and Wholesale Trade (100.0%), whereas the industries that tend to have a higher number of women are Information (100.0%), Health Care & Social Assistance (100.0%), and Accommodation & Food Services (100.0%).
| Industry | Male | Female |
| Agriculture, Fishing & Hunting | 8 (100.0%) | 0 (0.0%) |
| Mining, Quarrying, & Extraction | 0 (0.0%) | 0 (0.0%) |
| Construction | 11 (100.0%) | 0 (0.0%) |
| Manufacturing | 6 (35.3%) | 11 (64.7%) |
| Wholesale Trade | 7 (100.0%) | 0 (0.0%) |
| Retail Trade | 14 (58.3%) | 10 (41.7%) |
| Transportation & Warehousing | 9 (40.9%) | 13 (59.1%) |
| Utilities | 0 (0.0%) | 0 (0.0%) |
| Information | 0 (0.0%) | 5 (100.0%) |
| Finance & Insurance | 0 (0.0%) | 0 (0.0%) |
| Real Estate, Rental & Leasing | 0 (0.0%) | 0 (0.0%) |
| Professional & Scientific | 5 (100.0%) | 0 (0.0%) |
| Enterprise Management | 0 (0.0%) | 0 (0.0%) |
| Administrative & Support | 6 (40.0%) | 9 (60.0%) |
| Educational Services | 2 (100.0%) | 0 (0.0%) |
| Health Care & Social Assistance | 0 (0.0%) | 4 (100.0%) |
| Arts, Entertainment & Recreation | 12 (100.0%) | 0 (0.0%) |
| Accommodation & Food Services | 0 (0.0%) | 10 (100.0%) |
| Public Administration | 6 (100.0%) | 0 (0.0%) |
| Total | 86 (58.1%) | 62 (41.9%) |
Education in Easton
School Enrollment in Easton
The most common levels of schooling among the 58 students in Easton are middle school (17 | 29.3%), college / undergraduate (15 | 25.9%), and nursery / preschool (13 | 22.4%).
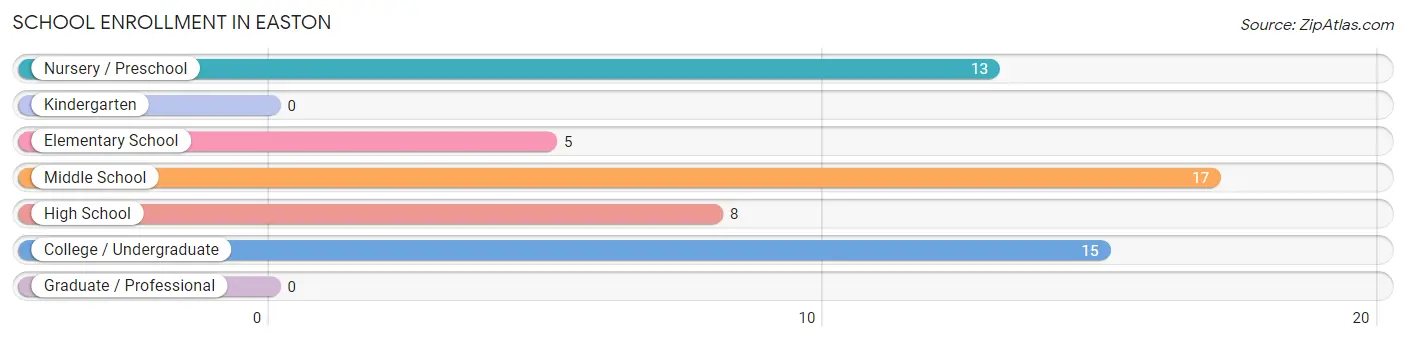
| School Level | # Students | % Students |
| Nursery / Preschool | 13 | 22.4% |
| Kindergarten | 0 | 0.0% |
| Elementary School | 5 | 8.6% |
| Middle School | 17 | 29.3% |
| High School | 8 | 13.8% |
| College / Undergraduate | 15 | 25.9% |
| Graduate / Professional | 0 | 0.0% |
| Total | 58 | 100.0% |
School Enrollment by Age by Funding Source in Easton
Out of a total of 58 students who are enrolled in schools in Easton, 22 (37.9%) attend a private institution, while the remaining 36 (62.1%) are enrolled in public schools. The age group of 3 to 4 year olds has the highest likelihood of being enrolled in private schools, with 13 (100.0% in the age bracket) enrolled. Conversely, the age group of 5 to 9 year old has the lowest likelihood of being enrolled in a private school, with 5 (100.0% in the age bracket) attending a public institution.
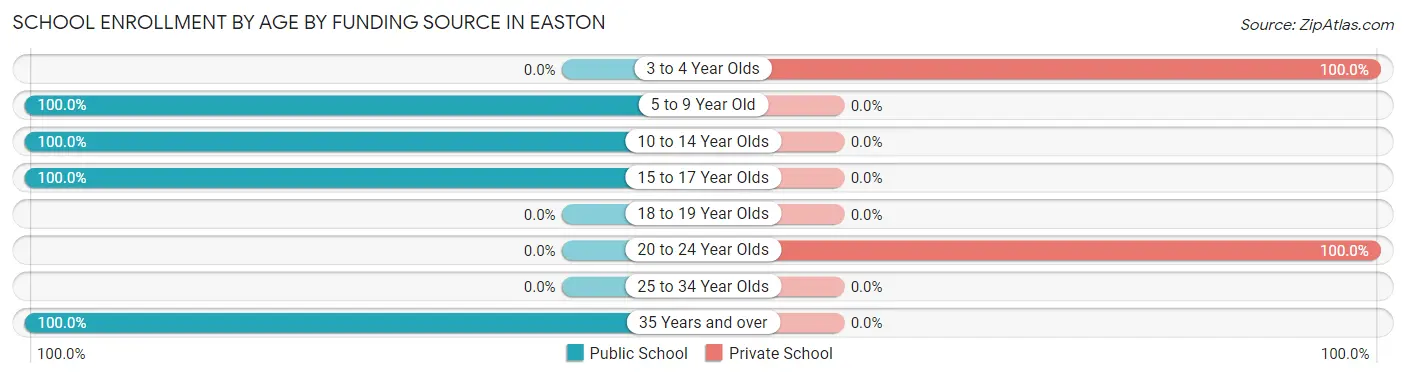
| Age Bracket | Public School | Private School |
| 3 to 4 Year Olds | 0 (0.0%) | 13 (100.0%) |
| 5 to 9 Year Old | 5 (100.0%) | 0 (0.0%) |
| 10 to 14 Year Olds | 17 (100.0%) | 0 (0.0%) |
| 15 to 17 Year Olds | 8 (100.0%) | 0 (0.0%) |
| 18 to 19 Year Olds | 0 (0.0%) | 0 (0.0%) |
| 20 to 24 Year Olds | 0 (0.0%) | 9 (100.0%) |
| 25 to 34 Year Olds | 0 (0.0%) | 0 (0.0%) |
| 35 Years and over | 6 (100.0%) | 0 (0.0%) |
| Total | 36 (62.1%) | 22 (37.9%) |
Educational Attainment by Field of Study in Easton
Science & technology (6 | 50.0%), social sciences (4 | 33.3%), bio, nature & agricultural (1 | 8.3%), and education (1 | 8.3%) are the most common fields of study among 12 individuals in Easton who have obtained a bachelor's degree or higher.
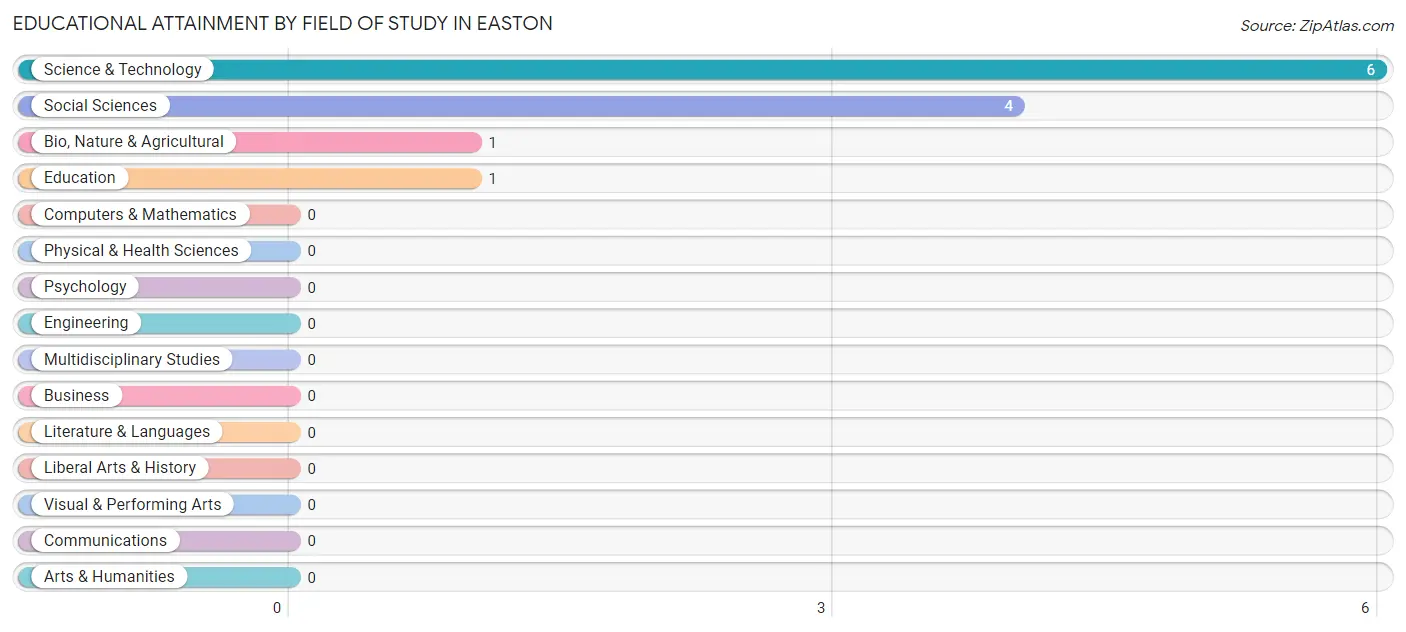
| Field of Study | # Graduates | % Graduates |
| Computers & Mathematics | 0 | 0.0% |
| Bio, Nature & Agricultural | 1 | 8.3% |
| Physical & Health Sciences | 0 | 0.0% |
| Psychology | 0 | 0.0% |
| Social Sciences | 4 | 33.3% |
| Engineering | 0 | 0.0% |
| Multidisciplinary Studies | 0 | 0.0% |
| Science & Technology | 6 | 50.0% |
| Business | 0 | 0.0% |
| Education | 1 | 8.3% |
| Literature & Languages | 0 | 0.0% |
| Liberal Arts & History | 0 | 0.0% |
| Visual & Performing Arts | 0 | 0.0% |
| Communications | 0 | 0.0% |
| Arts & Humanities | 0 | 0.0% |
| Total | 12 | 100.0% |
Transportation & Commute in Easton
Vehicle Availability by Sex in Easton
The most prevalent vehicle ownership categories in Easton are males with 3 vehicles (30, accounting for 37.0%) and females with 3 vehicles (15, making up 48.4%).
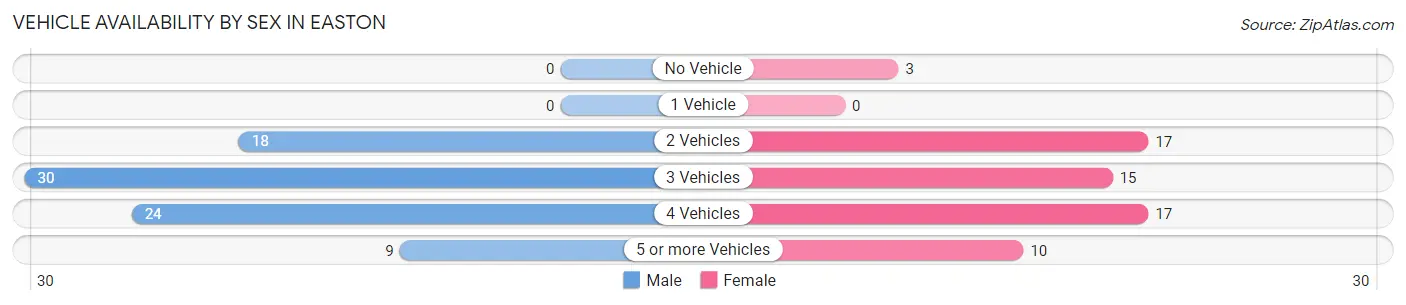
| Vehicles Available | Male | Female |
| No Vehicle | 0 (0.0%) | 3 (4.8%) |
| 1 Vehicle | 0 (0.0%) | 0 (0.0%) |
| 2 Vehicles | 18 (22.2%) | 17 (27.4%) |
| 3 Vehicles | 30 (37.0%) | 15 (24.2%) |
| 4 Vehicles | 24 (29.6%) | 17 (27.4%) |
| 5 or more Vehicles | 9 (11.1%) | 10 (16.1%) |
| Total | 81 (100.0%) | 62 (100.0%) |
Commute Time in Easton
The most frequently occuring commute durations in Easton are 60 to 89 minutes (39 commuters, 35.4%), 10 to 14 minutes (17 commuters, 15.4%), and 45 to 59 minutes (17 commuters, 15.4%).
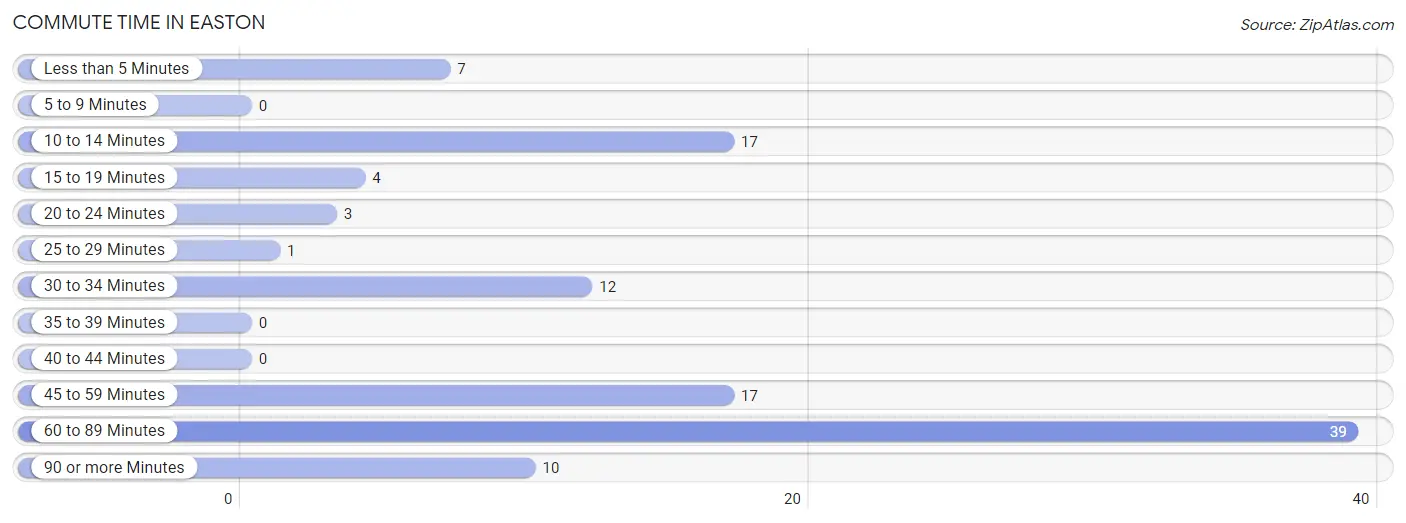
| Commute Time | # Commuters | % Commuters |
| Less than 5 Minutes | 7 | 6.4% |
| 5 to 9 Minutes | 0 | 0.0% |
| 10 to 14 Minutes | 17 | 15.4% |
| 15 to 19 Minutes | 4 | 3.6% |
| 20 to 24 Minutes | 3 | 2.7% |
| 25 to 29 Minutes | 1 | 0.9% |
| 30 to 34 Minutes | 12 | 10.9% |
| 35 to 39 Minutes | 0 | 0.0% |
| 40 to 44 Minutes | 0 | 0.0% |
| 45 to 59 Minutes | 17 | 15.4% |
| 60 to 89 Minutes | 39 | 35.4% |
| 90 or more Minutes | 10 | 9.1% |
Commute Time by Sex in Easton
The most common commute times in Easton are 60 to 89 minutes (23 commuters, 33.3%) for males and 60 to 89 minutes (16 commuters, 39.0%) for females.
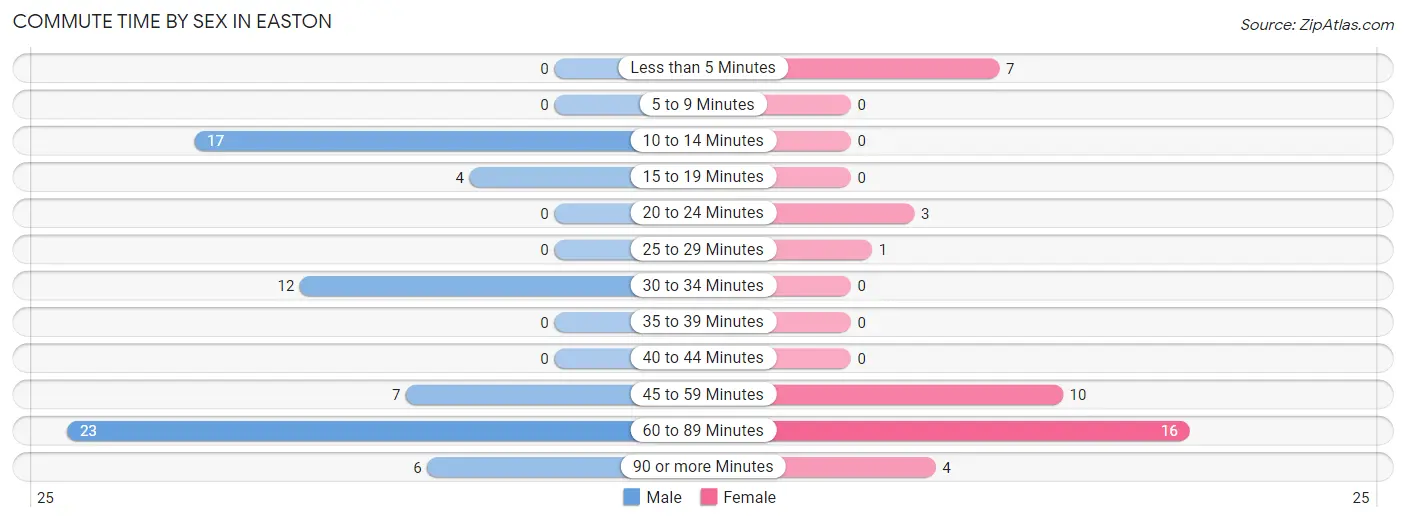
| Commute Time | Male | Female |
| Less than 5 Minutes | 0 (0.0%) | 7 (17.1%) |
| 5 to 9 Minutes | 0 (0.0%) | 0 (0.0%) |
| 10 to 14 Minutes | 17 (24.6%) | 0 (0.0%) |
| 15 to 19 Minutes | 4 (5.8%) | 0 (0.0%) |
| 20 to 24 Minutes | 0 (0.0%) | 3 (7.3%) |
| 25 to 29 Minutes | 0 (0.0%) | 1 (2.4%) |
| 30 to 34 Minutes | 12 (17.4%) | 0 (0.0%) |
| 35 to 39 Minutes | 0 (0.0%) | 0 (0.0%) |
| 40 to 44 Minutes | 0 (0.0%) | 0 (0.0%) |
| 45 to 59 Minutes | 7 (10.1%) | 10 (24.4%) |
| 60 to 89 Minutes | 23 (33.3%) | 16 (39.0%) |
| 90 or more Minutes | 6 (8.7%) | 4 (9.8%) |
Time of Departure to Work by Sex in Easton
The most frequent times of departure to work in Easton are 8:00 AM to 8:29 AM (23, 33.3%) for males and 9:00 AM to 9:59 AM (17, 41.5%) for females.
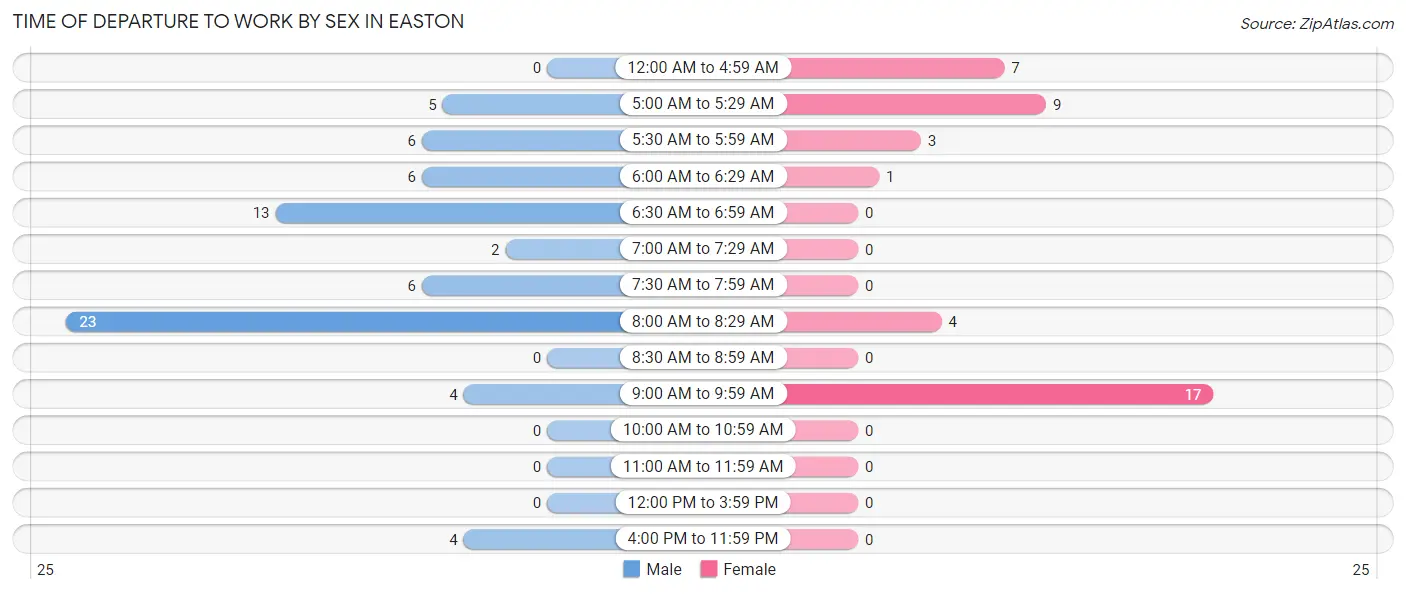
| Time of Departure | Male | Female |
| 12:00 AM to 4:59 AM | 0 (0.0%) | 7 (17.1%) |
| 5:00 AM to 5:29 AM | 5 (7.2%) | 9 (22.0%) |
| 5:30 AM to 5:59 AM | 6 (8.7%) | 3 (7.3%) |
| 6:00 AM to 6:29 AM | 6 (8.7%) | 1 (2.4%) |
| 6:30 AM to 6:59 AM | 13 (18.8%) | 0 (0.0%) |
| 7:00 AM to 7:29 AM | 2 (2.9%) | 0 (0.0%) |
| 7:30 AM to 7:59 AM | 6 (8.7%) | 0 (0.0%) |
| 8:00 AM to 8:29 AM | 23 (33.3%) | 4 (9.8%) |
| 8:30 AM to 8:59 AM | 0 (0.0%) | 0 (0.0%) |
| 9:00 AM to 9:59 AM | 4 (5.8%) | 17 (41.5%) |
| 10:00 AM to 10:59 AM | 0 (0.0%) | 0 (0.0%) |
| 11:00 AM to 11:59 AM | 0 (0.0%) | 0 (0.0%) |
| 12:00 PM to 3:59 PM | 0 (0.0%) | 0 (0.0%) |
| 4:00 PM to 11:59 PM | 4 (5.8%) | 0 (0.0%) |
| Total | 69 (100.0%) | 41 (100.0%) |
Housing Occupancy in Easton
Occupancy by Ownership in Easton
Of the total 156 dwellings in Easton, owner-occupied units account for 120 (76.9%), while renter-occupied units make up 36 (23.1%).
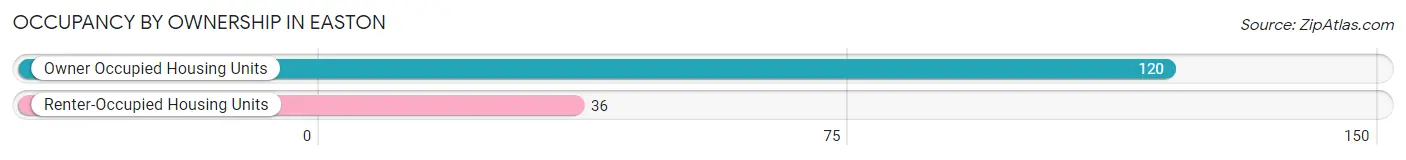
| Occupancy | # Housing Units | % Housing Units |
| Owner Occupied Housing Units | 120 | 76.9% |
| Renter-Occupied Housing Units | 36 | 23.1% |
| Total Occupied Housing Units | 156 | 100.0% |
Occupancy by Household Size in Easton
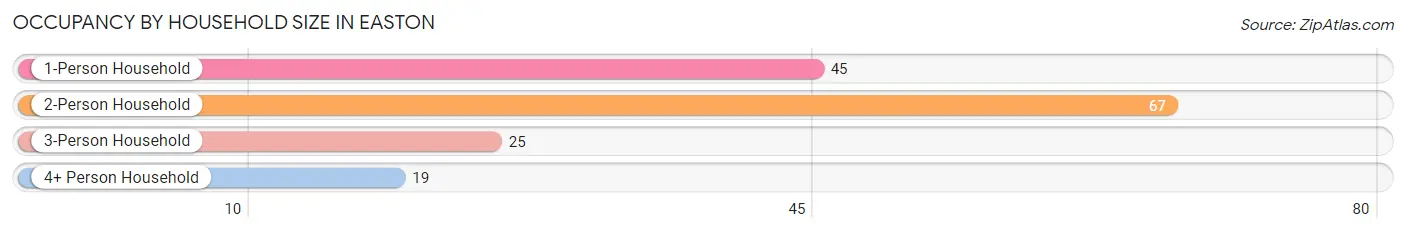
| Household Size | # Housing Units | % Housing Units |
| 1-Person Household | 45 | 28.8% |
| 2-Person Household | 67 | 42.9% |
| 3-Person Household | 25 | 16.0% |
| 4+ Person Household | 19 | 12.2% |
| Total Housing Units | 156 | 100.0% |
Occupancy by Ownership by Household Size in Easton
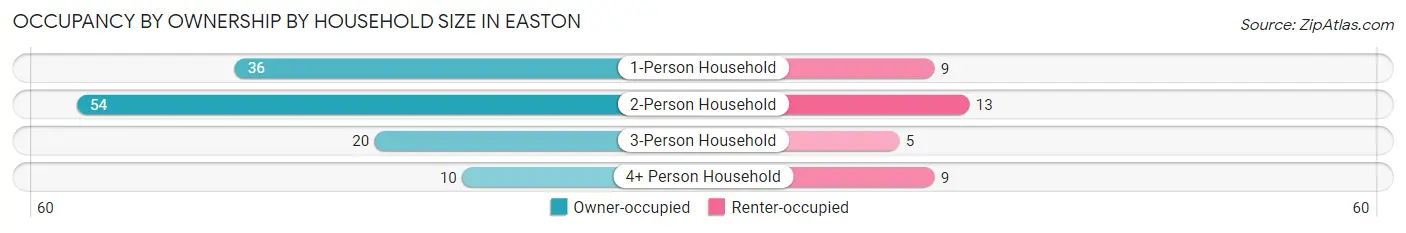
| Household Size | Owner-occupied | Renter-occupied |
| 1-Person Household | 36 (80.0%) | 9 (20.0%) |
| 2-Person Household | 54 (80.6%) | 13 (19.4%) |
| 3-Person Household | 20 (80.0%) | 5 (20.0%) |
| 4+ Person Household | 10 (52.6%) | 9 (47.4%) |
| Total Housing Units | 120 (76.9%) | 36 (23.1%) |
Occupancy by Educational Attainment in Easton
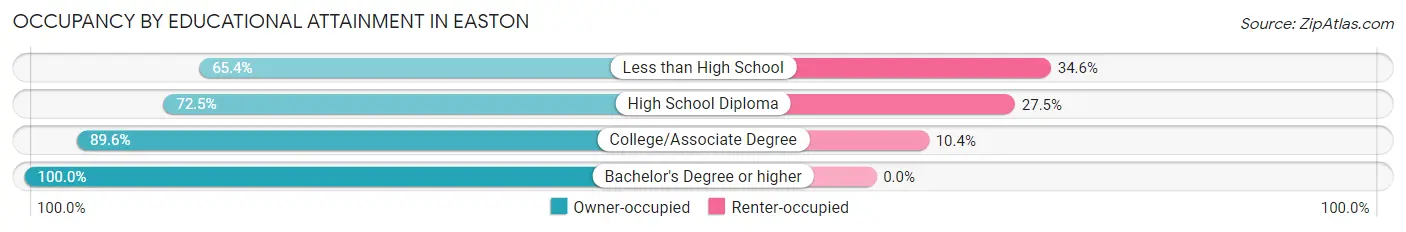
| Household Size | Owner-occupied | Renter-occupied |
| Less than High School | 17 (65.4%) | 9 (34.6%) |
| High School Diploma | 58 (72.5%) | 22 (27.5%) |
| College/Associate Degree | 43 (89.6%) | 5 (10.4%) |
| Bachelor's Degree or higher | 2 (100.0%) | 0 (0.0%) |
Occupancy by Age of Householder in Easton
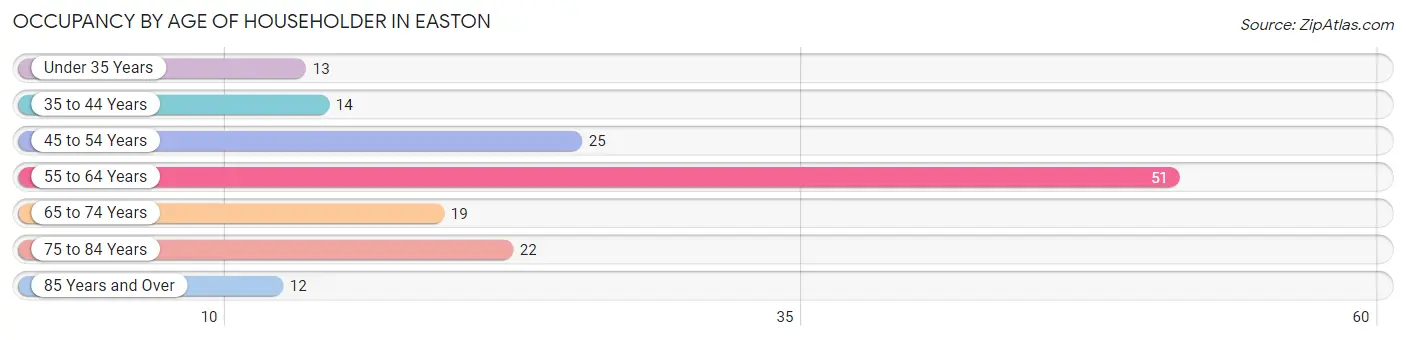
| Age Bracket | # Households | % Households |
| Under 35 Years | 13 | 8.3% |
| 35 to 44 Years | 14 | 9.0% |
| 45 to 54 Years | 25 | 16.0% |
| 55 to 64 Years | 51 | 32.7% |
| 65 to 74 Years | 19 | 12.2% |
| 75 to 84 Years | 22 | 14.1% |
| 85 Years and Over | 12 | 7.7% |
| Total | 156 | 100.0% |
Housing Finances in Easton
Median Income by Occupancy in Easton
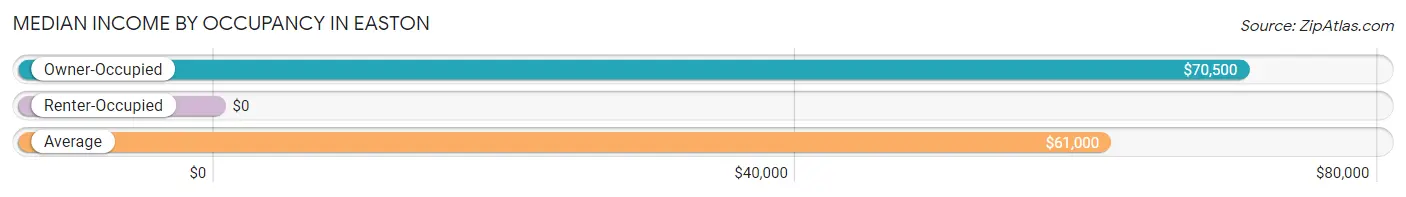
| Occupancy Type | # Households | Median Income |
| Owner-Occupied | 120 (76.9%) | $70,500 |
| Renter-Occupied | 36 (23.1%) | $0 |
| Average | 156 (100.0%) | $61,000 |
Occupancy by Householder Income Bracket in Easton
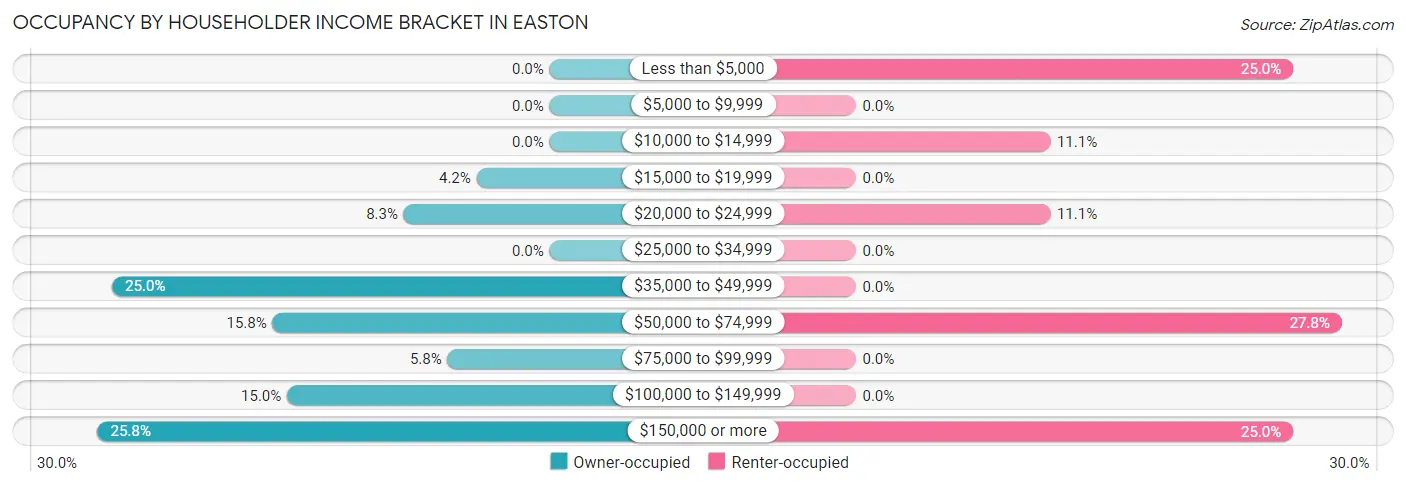
| Income Bracket | Owner-occupied | Renter-occupied |
| Less than $5,000 | 0 (0.0%) | 9 (25.0%) |
| $5,000 to $9,999 | 0 (0.0%) | 0 (0.0%) |
| $10,000 to $14,999 | 0 (0.0%) | 4 (11.1%) |
| $15,000 to $19,999 | 5 (4.2%) | 0 (0.0%) |
| $20,000 to $24,999 | 10 (8.3%) | 4 (11.1%) |
| $25,000 to $34,999 | 0 (0.0%) | 0 (0.0%) |
| $35,000 to $49,999 | 30 (25.0%) | 0 (0.0%) |
| $50,000 to $74,999 | 19 (15.8%) | 10 (27.8%) |
| $75,000 to $99,999 | 7 (5.8%) | 0 (0.0%) |
| $100,000 to $149,999 | 18 (15.0%) | 0 (0.0%) |
| $150,000 or more | 31 (25.8%) | 9 (25.0%) |
| Total | 120 (100.0%) | 36 (100.0%) |
Monthly Housing Cost Tiers in Easton
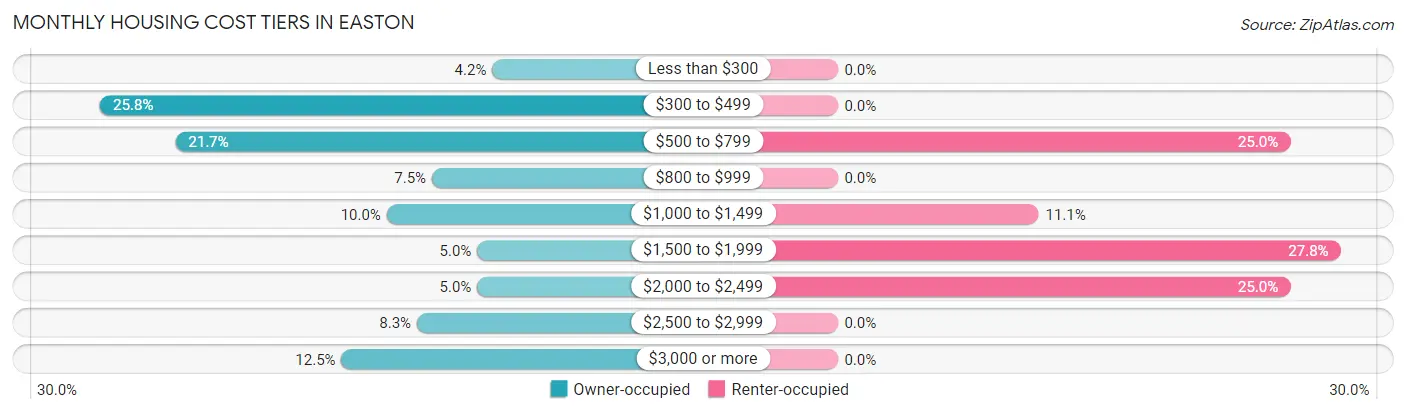
| Monthly Cost | Owner-occupied | Renter-occupied |
| Less than $300 | 5 (4.2%) | 0 (0.0%) |
| $300 to $499 | 31 (25.8%) | 0 (0.0%) |
| $500 to $799 | 26 (21.7%) | 9 (25.0%) |
| $800 to $999 | 9 (7.5%) | 0 (0.0%) |
| $1,000 to $1,499 | 12 (10.0%) | 4 (11.1%) |
| $1,500 to $1,999 | 6 (5.0%) | 10 (27.8%) |
| $2,000 to $2,499 | 6 (5.0%) | 9 (25.0%) |
| $2,500 to $2,999 | 10 (8.3%) | 0 (0.0%) |
| $3,000 or more | 15 (12.5%) | 0 (0.0%) |
| Total | 120 (100.0%) | 36 (100.0%) |
Physical Housing Characteristics in Easton
Housing Structures in Easton

| Structure Type | # Housing Units | % Housing Units |
| Single Unit, Detached | 138 | 88.5% |
| Single Unit, Attached | 0 | 0.0% |
| 2 Unit Apartments | 0 | 0.0% |
| 3 or 4 Unit Apartments | 0 | 0.0% |
| 5 to 9 Unit Apartments | 0 | 0.0% |
| 10 or more Apartments | 0 | 0.0% |
| Mobile Home / Other | 18 | 11.5% |
| Total | 156 | 100.0% |
Housing Structures by Occupancy in Easton
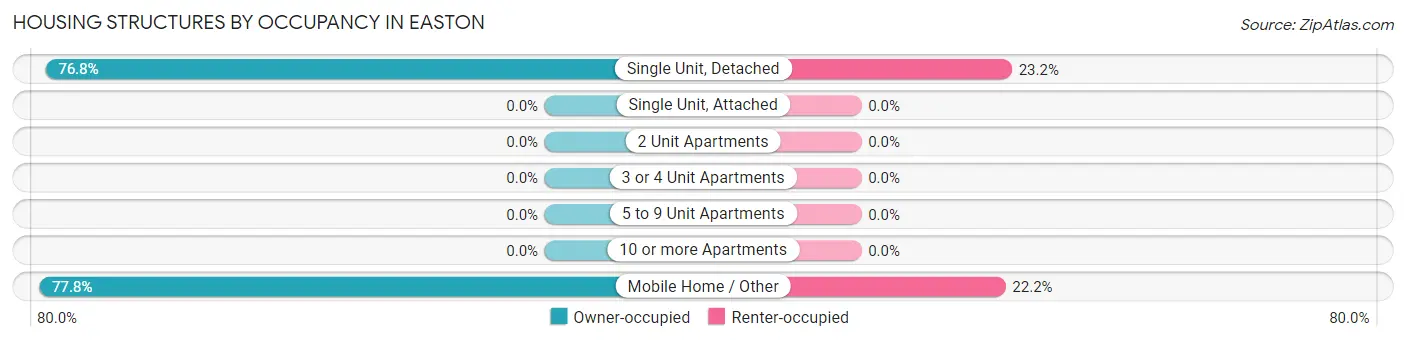
| Structure Type | Owner-occupied | Renter-occupied |
| Single Unit, Detached | 106 (76.8%) | 32 (23.2%) |
| Single Unit, Attached | 0 (0.0%) | 0 (0.0%) |
| 2 Unit Apartments | 0 (0.0%) | 0 (0.0%) |
| 3 or 4 Unit Apartments | 0 (0.0%) | 0 (0.0%) |
| 5 to 9 Unit Apartments | 0 (0.0%) | 0 (0.0%) |
| 10 or more Apartments | 0 (0.0%) | 0 (0.0%) |
| Mobile Home / Other | 14 (77.8%) | 4 (22.2%) |
| Total | 120 (76.9%) | 36 (23.1%) |
Housing Structures by Number of Rooms in Easton
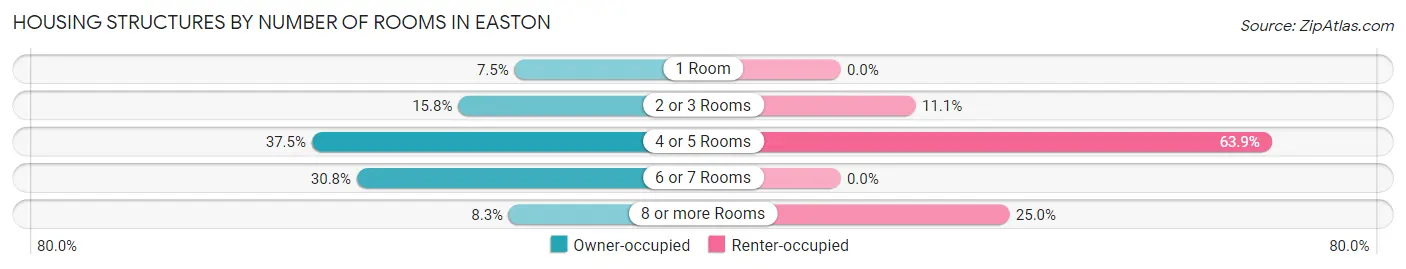
| Number of Rooms | Owner-occupied | Renter-occupied |
| 1 Room | 9 (7.5%) | 0 (0.0%) |
| 2 or 3 Rooms | 19 (15.8%) | 4 (11.1%) |
| 4 or 5 Rooms | 45 (37.5%) | 23 (63.9%) |
| 6 or 7 Rooms | 37 (30.8%) | 0 (0.0%) |
| 8 or more Rooms | 10 (8.3%) | 9 (25.0%) |
| Total | 120 (100.0%) | 36 (100.0%) |
Housing Structure by Heating Type in Easton
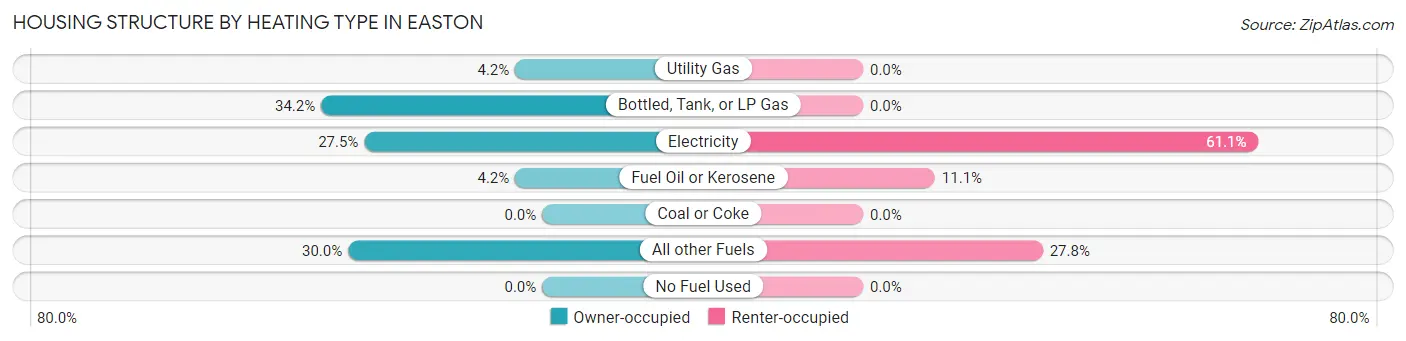
| Heating Type | Owner-occupied | Renter-occupied |
| Utility Gas | 5 (4.2%) | 0 (0.0%) |
| Bottled, Tank, or LP Gas | 41 (34.2%) | 0 (0.0%) |
| Electricity | 33 (27.5%) | 22 (61.1%) |
| Fuel Oil or Kerosene | 5 (4.2%) | 4 (11.1%) |
| Coal or Coke | 0 (0.0%) | 0 (0.0%) |
| All other Fuels | 36 (30.0%) | 10 (27.8%) |
| No Fuel Used | 0 (0.0%) | 0 (0.0%) |
| Total | 120 (100.0%) | 36 (100.0%) |
Household Vehicle Usage in Easton
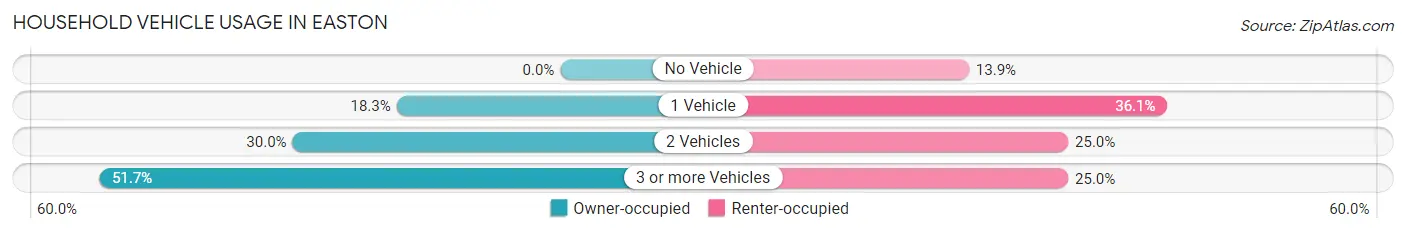
| Vehicles per Household | Owner-occupied | Renter-occupied |
| No Vehicle | 0 (0.0%) | 5 (13.9%) |
| 1 Vehicle | 22 (18.3%) | 13 (36.1%) |
| 2 Vehicles | 36 (30.0%) | 9 (25.0%) |
| 3 or more Vehicles | 62 (51.7%) | 9 (25.0%) |
| Total | 120 (100.0%) | 36 (100.0%) |
Real Estate & Mortgages in Easton
Real Estate and Mortgage Overview in Easton
| Characteristic | Without Mortgage | With Mortgage |
| Housing Units | 68 | 52 |
| Median Property Value | $364,300 | $559,500 |
| Median Household Income | $49,375 | $19 |
| Monthly Housing Costs | $493 | $15 |
| Real Estate Taxes | $1,385 | $0 |
Property Value by Mortgage Status in Easton
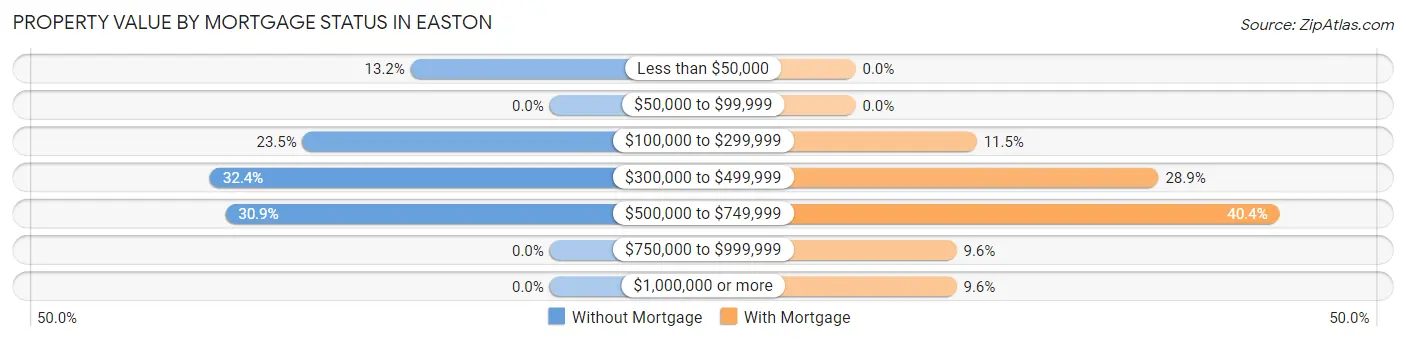
| Property Value | Without Mortgage | With Mortgage |
| Less than $50,000 | 9 (13.2%) | 0 (0.0%) |
| $50,000 to $99,999 | 0 (0.0%) | 0 (0.0%) |
| $100,000 to $299,999 | 16 (23.5%) | 6 (11.5%) |
| $300,000 to $499,999 | 22 (32.4%) | 15 (28.8%) |
| $500,000 to $749,999 | 21 (30.9%) | 21 (40.4%) |
| $750,000 to $999,999 | 0 (0.0%) | 5 (9.6%) |
| $1,000,000 or more | 0 (0.0%) | 5 (9.6%) |
| Total | 68 (100.0%) | 52 (100.0%) |
Household Income by Mortgage Status in Easton
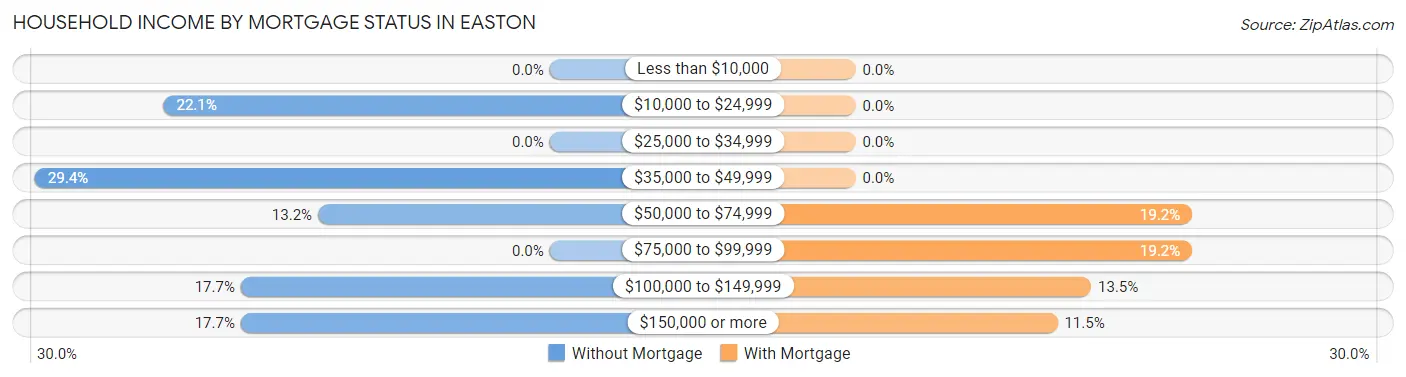
| Household Income | Without Mortgage | With Mortgage |
| Less than $10,000 | 0 (0.0%) | 0 (0.0%) |
| $10,000 to $24,999 | 15 (22.1%) | 0 (0.0%) |
| $25,000 to $34,999 | 0 (0.0%) | 0 (0.0%) |
| $35,000 to $49,999 | 20 (29.4%) | 0 (0.0%) |
| $50,000 to $74,999 | 9 (13.2%) | 10 (19.2%) |
| $75,000 to $99,999 | 0 (0.0%) | 10 (19.2%) |
| $100,000 to $149,999 | 12 (17.6%) | 7 (13.5%) |
| $150,000 or more | 12 (17.6%) | 6 (11.5%) |
| Total | 68 (100.0%) | 52 (100.0%) |
Property Value to Household Income Ratio in Easton
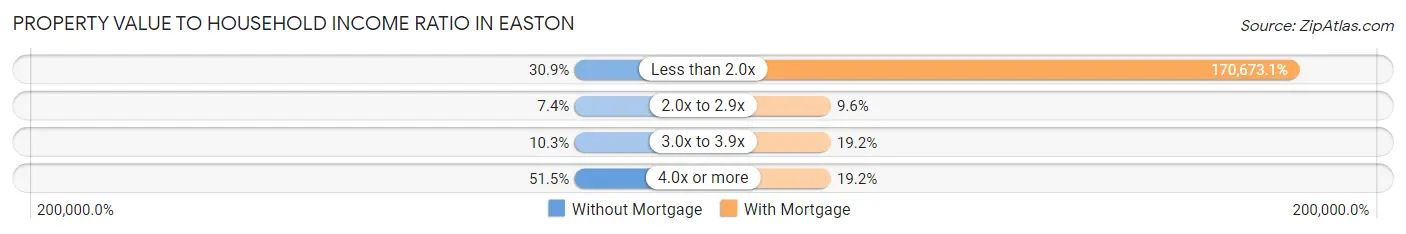
| Value-to-Income Ratio | Without Mortgage | With Mortgage |
| Less than 2.0x | 21 (30.9%) | 88,750 (170,673.1%) |
| 2.0x to 2.9x | 5 (7.3%) | 5 (9.6%) |
| 3.0x to 3.9x | 7 (10.3%) | 10 (19.2%) |
| 4.0x or more | 35 (51.5%) | 10 (19.2%) |
| Total | 68 (100.0%) | 52 (100.0%) |
Real Estate Taxes by Mortgage Status in Easton
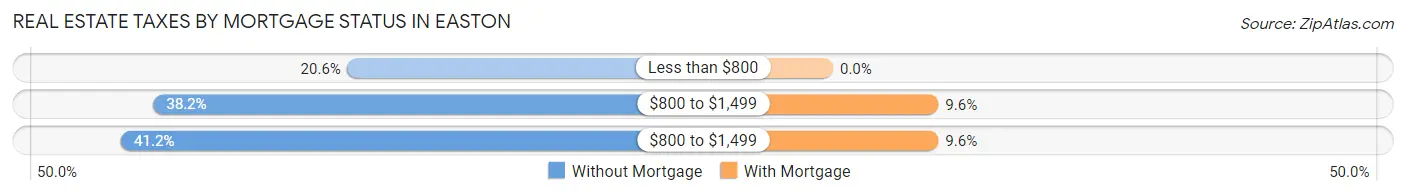
| Property Taxes | Without Mortgage | With Mortgage |
| Less than $800 | 14 (20.6%) | 0 (0.0%) |
| $800 to $1,499 | 26 (38.2%) | 5 (9.6%) |
| $800 to $1,499 | 28 (41.2%) | 5 (9.6%) |
| Total | 68 (100.0%) | 52 (100.0%) |
Health & Disability in Easton
Health Insurance Coverage by Age in Easton
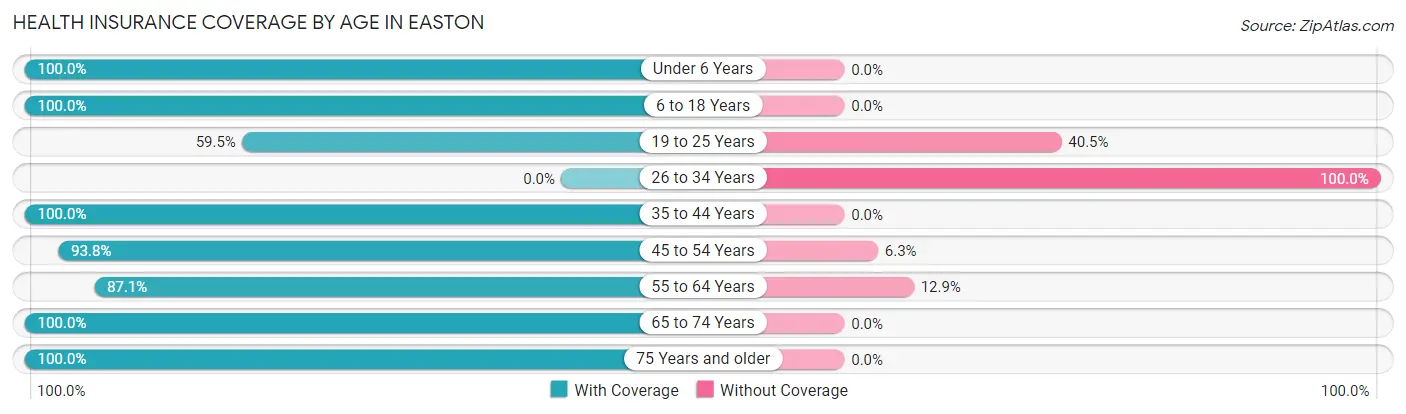
| Age Bracket | With Coverage | Without Coverage |
| Under 6 Years | 18 (100.0%) | 0 (0.0%) |
| 6 to 18 Years | 30 (100.0%) | 0 (0.0%) |
| 19 to 25 Years | 25 (59.5%) | 17 (40.5%) |
| 26 to 34 Years | 0 (0.0%) | 4 (100.0%) |
| 35 to 44 Years | 28 (100.0%) | 0 (0.0%) |
| 45 to 54 Years | 45 (93.8%) | 3 (6.2%) |
| 55 to 64 Years | 74 (87.1%) | 11 (12.9%) |
| 65 to 74 Years | 39 (100.0%) | 0 (0.0%) |
| 75 Years and older | 34 (100.0%) | 0 (0.0%) |
| Total | 293 (89.3%) | 35 (10.7%) |
Health Insurance Coverage by Citizenship Status in Easton
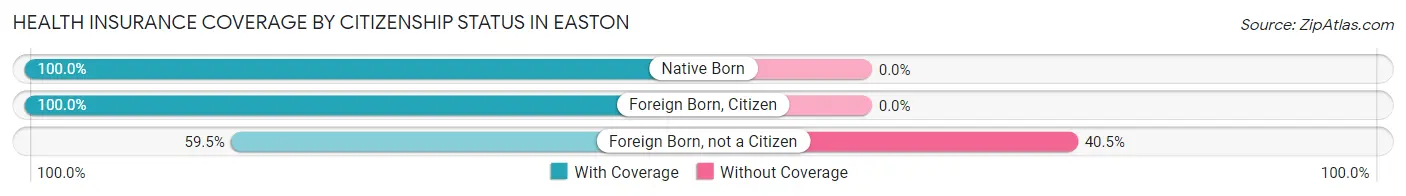
| Citizenship Status | With Coverage | Without Coverage |
| Native Born | 18 (100.0%) | 0 (0.0%) |
| Foreign Born, Citizen | 30 (100.0%) | 0 (0.0%) |
| Foreign Born, not a Citizen | 25 (59.5%) | 17 (40.5%) |
Health Insurance Coverage by Household Income in Easton
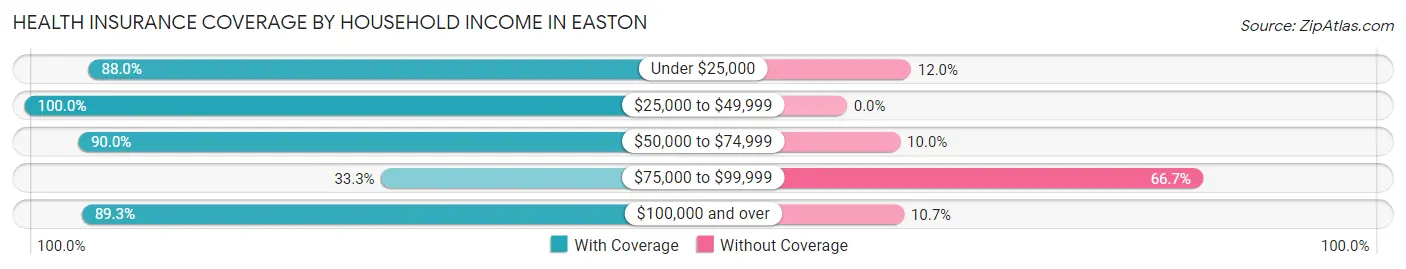
| Household Income | With Coverage | Without Coverage |
| Under $25,000 | 44 (88.0%) | 6 (12.0%) |
| $25,000 to $49,999 | 51 (100.0%) | 0 (0.0%) |
| $50,000 to $74,999 | 45 (90.0%) | 5 (10.0%) |
| $75,000 to $99,999 | 3 (33.3%) | 6 (66.7%) |
| $100,000 and over | 150 (89.3%) | 18 (10.7%) |
Public vs Private Health Insurance Coverage by Age in Easton
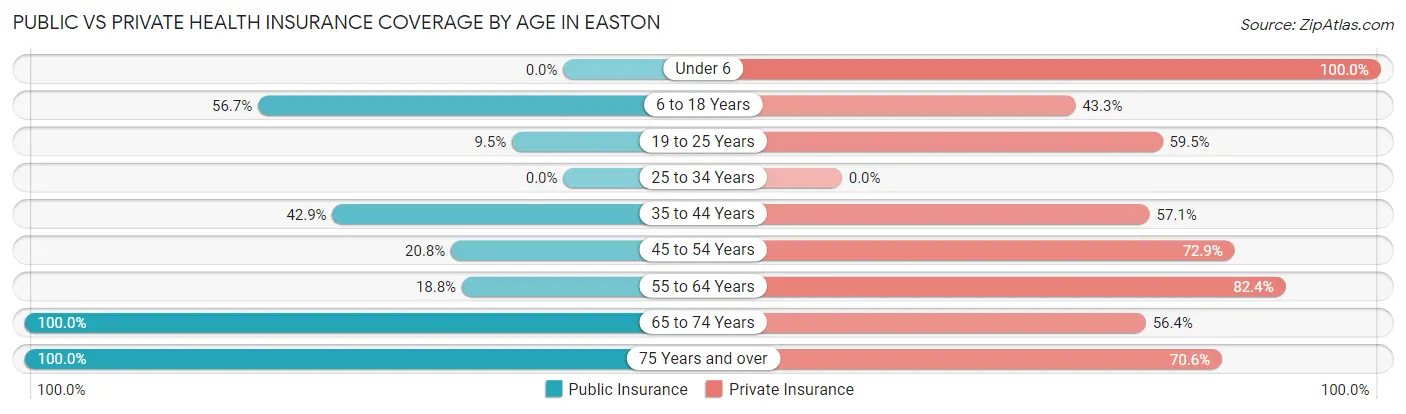
| Age Bracket | Public Insurance | Private Insurance |
| Under 6 | 0 (0.0%) | 18 (100.0%) |
| 6 to 18 Years | 17 (56.7%) | 13 (43.3%) |
| 19 to 25 Years | 4 (9.5%) | 25 (59.5%) |
| 25 to 34 Years | 0 (0.0%) | 0 (0.0%) |
| 35 to 44 Years | 12 (42.9%) | 16 (57.1%) |
| 45 to 54 Years | 10 (20.8%) | 35 (72.9%) |
| 55 to 64 Years | 16 (18.8%) | 70 (82.4%) |
| 65 to 74 Years | 39 (100.0%) | 22 (56.4%) |
| 75 Years and over | 34 (100.0%) | 24 (70.6%) |
| Total | 132 (40.2%) | 223 (68.0%) |
Disability Status by Sex by Age in Easton
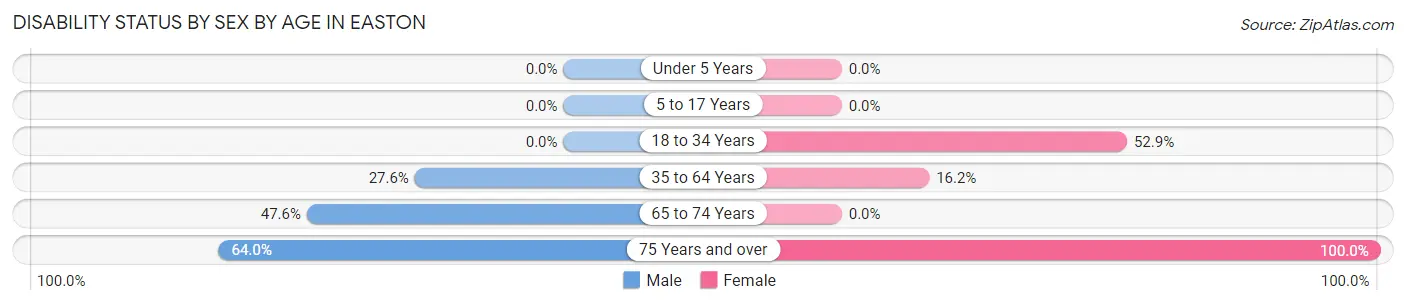
| Age Bracket | Male | Female |
| Under 5 Years | 0 (0.0%) | 0 (0.0%) |
| 5 to 17 Years | 0 (0.0%) | 0 (0.0%) |
| 18 to 34 Years | 0 (0.0%) | 9 (52.9%) |
| 35 to 64 Years | 24 (27.6%) | 12 (16.2%) |
| 65 to 74 Years | 10 (47.6%) | 0 (0.0%) |
| 75 Years and over | 16 (64.0%) | 9 (100.0%) |
Disability Class by Sex by Age in Easton
Disability Class: Hearing Difficulty
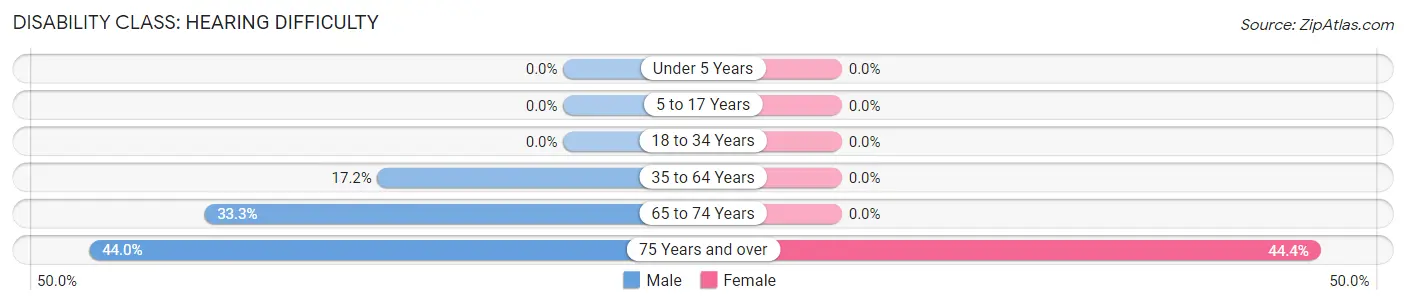
| Age Bracket | Male | Female |
| Under 5 Years | 0 (0.0%) | 0 (0.0%) |
| 5 to 17 Years | 0 (0.0%) | 0 (0.0%) |
| 18 to 34 Years | 0 (0.0%) | 0 (0.0%) |
| 35 to 64 Years | 15 (17.2%) | 0 (0.0%) |
| 65 to 74 Years | 7 (33.3%) | 0 (0.0%) |
| 75 Years and over | 11 (44.0%) | 4 (44.4%) |
Disability Class: Vision Difficulty
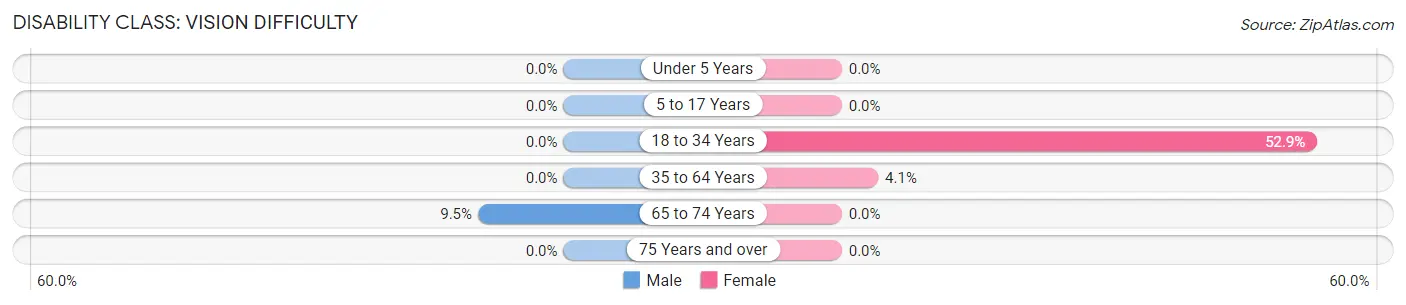
| Age Bracket | Male | Female |
| Under 5 Years | 0 (0.0%) | 0 (0.0%) |
| 5 to 17 Years | 0 (0.0%) | 0 (0.0%) |
| 18 to 34 Years | 0 (0.0%) | 9 (52.9%) |
| 35 to 64 Years | 0 (0.0%) | 3 (4.1%) |
| 65 to 74 Years | 2 (9.5%) | 0 (0.0%) |
| 75 Years and over | 0 (0.0%) | 0 (0.0%) |
Disability Class: Cognitive Difficulty
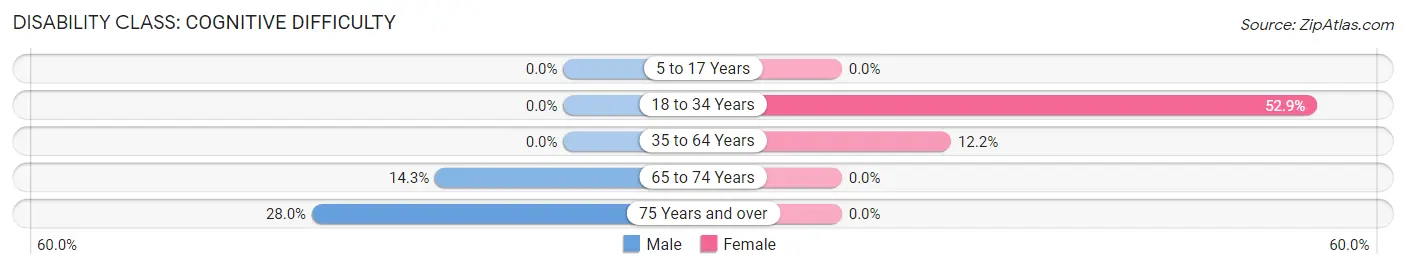
| Age Bracket | Male | Female |
| 5 to 17 Years | 0 (0.0%) | 0 (0.0%) |
| 18 to 34 Years | 0 (0.0%) | 9 (52.9%) |
| 35 to 64 Years | 0 (0.0%) | 9 (12.2%) |
| 65 to 74 Years | 3 (14.3%) | 0 (0.0%) |
| 75 Years and over | 7 (28.0%) | 0 (0.0%) |
Disability Class: Ambulatory Difficulty
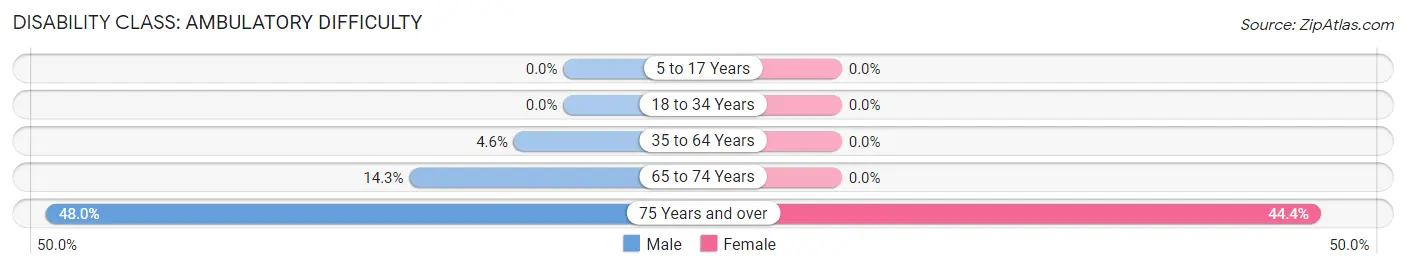
| Age Bracket | Male | Female |
| 5 to 17 Years | 0 (0.0%) | 0 (0.0%) |
| 18 to 34 Years | 0 (0.0%) | 0 (0.0%) |
| 35 to 64 Years | 4 (4.6%) | 0 (0.0%) |
| 65 to 74 Years | 3 (14.3%) | 0 (0.0%) |
| 75 Years and over | 12 (48.0%) | 4 (44.4%) |
Disability Class: Self-Care Difficulty
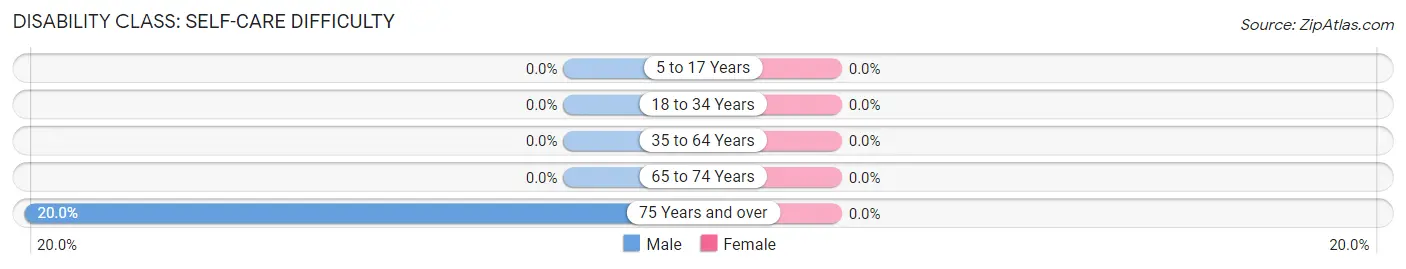
| Age Bracket | Male | Female |
| 5 to 17 Years | 0 (0.0%) | 0 (0.0%) |
| 18 to 34 Years | 0 (0.0%) | 0 (0.0%) |
| 35 to 64 Years | 0 (0.0%) | 0 (0.0%) |
| 65 to 74 Years | 0 (0.0%) | 0 (0.0%) |
| 75 Years and over | 5 (20.0%) | 0 (0.0%) |
Technology Access in Easton
Computing Device Access in Easton
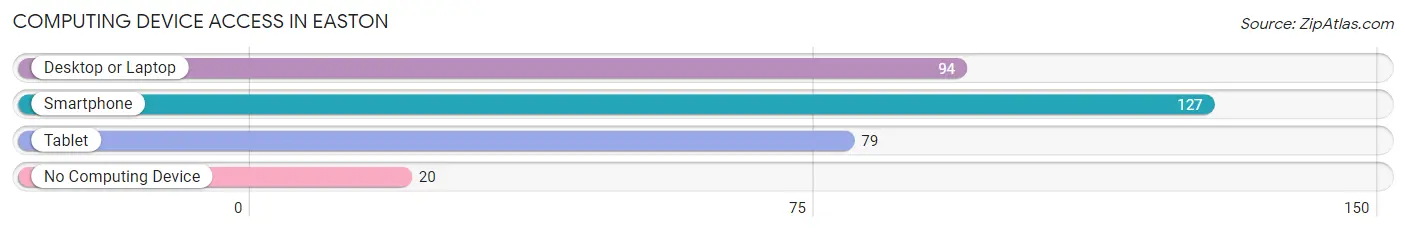
| Device Type | # Households | % Households |
| Desktop or Laptop | 94 | 60.3% |
| Smartphone | 127 | 81.4% |
| Tablet | 79 | 50.6% |
| No Computing Device | 20 | 12.8% |
| Total | 156 | 100.0% |
Internet Access in Easton
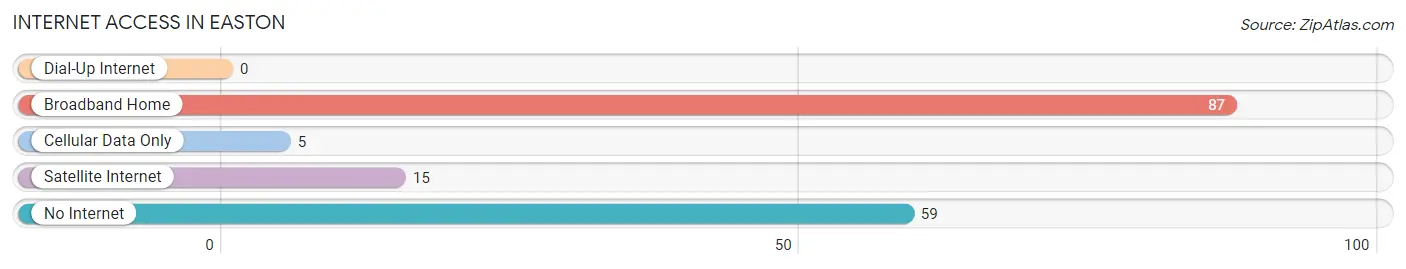
| Internet Type | # Households | % Households |
| Dial-Up Internet | 0 | 0.0% |
| Broadband Home | 87 | 55.8% |
| Cellular Data Only | 5 | 3.2% |
| Satellite Internet | 15 | 9.6% |
| No Internet | 59 | 37.8% |
| Total | 156 | 100.0% |
Easton Summary
Easton is a small town located in Kittitas County, Washington, United States. It is situated in the Cascade Mountains, approximately 25 miles east of Ellensburg. The town was founded in 1883 and was named after the nearby Easton Creek. The population of Easton was 1,717 at the 2010 census.
History
Easton was founded in 1883 by a group of settlers from the Midwest. The town was named after the nearby Easton Creek, which was named after a settler from the Midwest. The settlers were attracted to the area due to its abundance of natural resources, including timber, water, and minerals.
The first settlers in Easton were primarily farmers and loggers. The town quickly grew and by the early 1900s, it had become a bustling community with a variety of businesses, including a sawmill, a general store, a hotel, and a post office.
In the early 1900s, Easton was a popular destination for tourists. The town was known for its scenic beauty and its abundance of outdoor activities, such as fishing, hunting, and camping.
In the 1920s, Easton began to experience a decline in population as people moved away to larger cities. The town was also affected by the Great Depression, which caused many businesses to close.
In the 1950s, Easton began to experience a resurgence in population as people moved back to the area. The town was also revitalized by the construction of the nearby Lake Easton State Park, which opened in 1959.
Geography
Easton is located in the Cascade Mountains of Washington State. The town is situated at an elevation of 1,845 feet and is surrounded by mountains and forests. The nearby Lake Easton State Park is a popular destination for outdoor activities, such as fishing, camping, and hiking.
The climate in Easton is generally mild, with warm summers and cold winters. The average annual temperature is 45 degrees Fahrenheit. The average annual precipitation is 22 inches.
Economy
The economy of Easton is primarily based on tourism and outdoor recreation. The nearby Lake Easton State Park is a popular destination for outdoor activities, such as fishing, camping, and hiking. The town also has a variety of restaurants, shops, and other businesses.
The town is also home to a number of small businesses, including a sawmill, a general store, and a post office.
Demographics
As of the 2010 census, the population of Easton was 1,717. The racial makeup of the town was 94.3% White, 0.3% African American, 0.7% Native American, 0.7% Asian, 0.1% Pacific Islander, 1.2% from other races, and 2.1% from two or more races. Hispanic or Latino of any race were 4.2% of the population.
The median income for a household in Easton was $41,250, and the median income for a family was $50,000. The per capita income for the town was $20,945. About 11.2% of families and 14.2% of the population were below the poverty line, including 18.2% of those under age 18 and 8.3% of those age 65 or over.
Common Questions
What is Per Capita Income in Easton?
Per Capita income in Easton is $47,563.
What is the Median Household income in Easton?
Median Household Income in Easton is $61,000.
What is Income or Wage Gap in Easton?
Income or Wage Gap in Easton is 34.7%.
Women in Easton earn 65.3 cents for every dollar earned by a man.
What is Inequality or Gini Index in Easton?
Inequality or Gini Index in Easton is 0.48.
What is the Total Population of Easton?
Total Population of Easton is 328.
What is the Total Male Population of Easton?
Total Male Population of Easton is 193.
What is the Total Female Population of Easton?
Total Female Population of Easton is 135.
What is the Ratio of Males per 100 Females in Easton?
There are 142.96 Males per 100 Females in Easton.
What is the Ratio of Females per 100 Males in Easton?
There are 69.95 Females per 100 Males in Easton.
What is the Median Population Age in Easton?
Median Population Age in Easton is 53.7 Years.
What is the Average Family Size in Easton
Average Family Size in Easton is 2.4 People.
What is the Average Household Size in Easton
Average Household Size in Easton is 2.1 People.
How Large is the Labor Force in Easton?
There are 178 People in the Labor Forcein in Easton.
What is the Percentage of People in the Labor Force in Easton?
62.9% of People are in the Labor Force in Easton.
What is the Unemployment Rate in Easton?
Unemployment Rate in Easton is 16.9%.