Lake McMurray, WA Map & Demographics
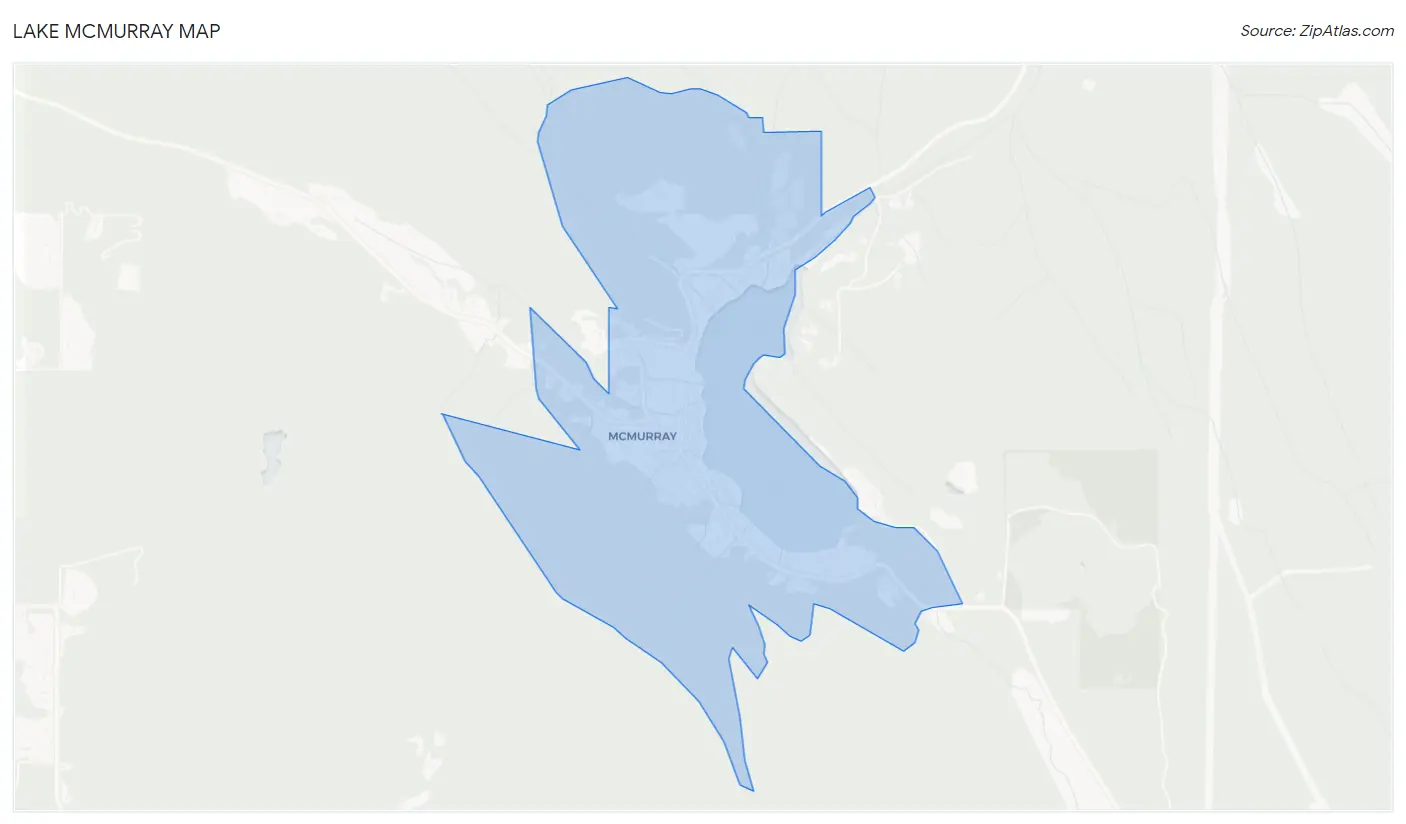
Lake McMurray Map
Lake McMurray Overview
$32,485
PER CAPITA INCOME
$41,875
AVG HOUSEHOLD INCOME
0.42
INEQUALITY / GINI INDEX
473
TOTAL POPULATION
211
MALE POPULATION
262
FEMALE POPULATION
80.53
MALES / 100 FEMALES
124.17
FEMALES / 100 MALES
37.4
MEDIAN AGE
2.8
AVG FAMILY SIZE
2.8
AVG HOUSEHOLD SIZE
176
LABOR FORCE [ PEOPLE ]
48.1%
PERCENT IN LABOR FORCE
Income in Lake McMurray
Income Overview in Lake McMurray
| Characteristic | Number | Measure |
| Per Capita Income | 473 | $32,485 |
| Median Family Income | 107 | $0 |
| Mean Family Income | 107 | $118,801 |
| Median Household Income | 170 | $41,875 |
| Mean Household Income | 170 | $92,376 |
| Income Deficit | 107 | $0 |
| Wage / Income Gap (%) | 473 | 0.00% |
| Wage / Income Gap ($) | 473 | 100.00¢ per $1 |
| Gini / Inequality Index | 473 | 0.42 |
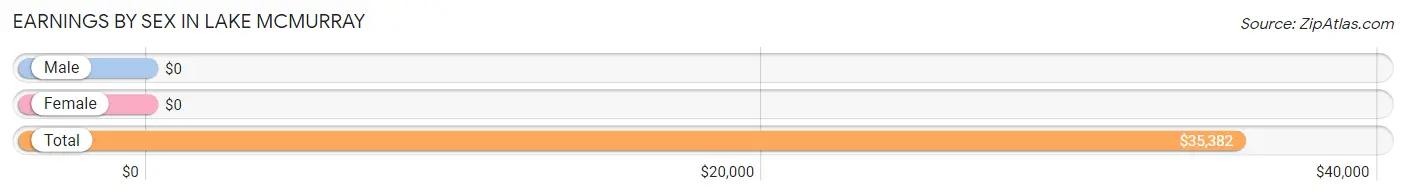
Earnings by Sex in Lake McMurray
| Sex | Number | Average Earnings |
| Male | 82 (38.9%) | $0 |
| Female | 129 (61.1%) | $0 |
| Total | 211 (100.0%) | $35,382 |
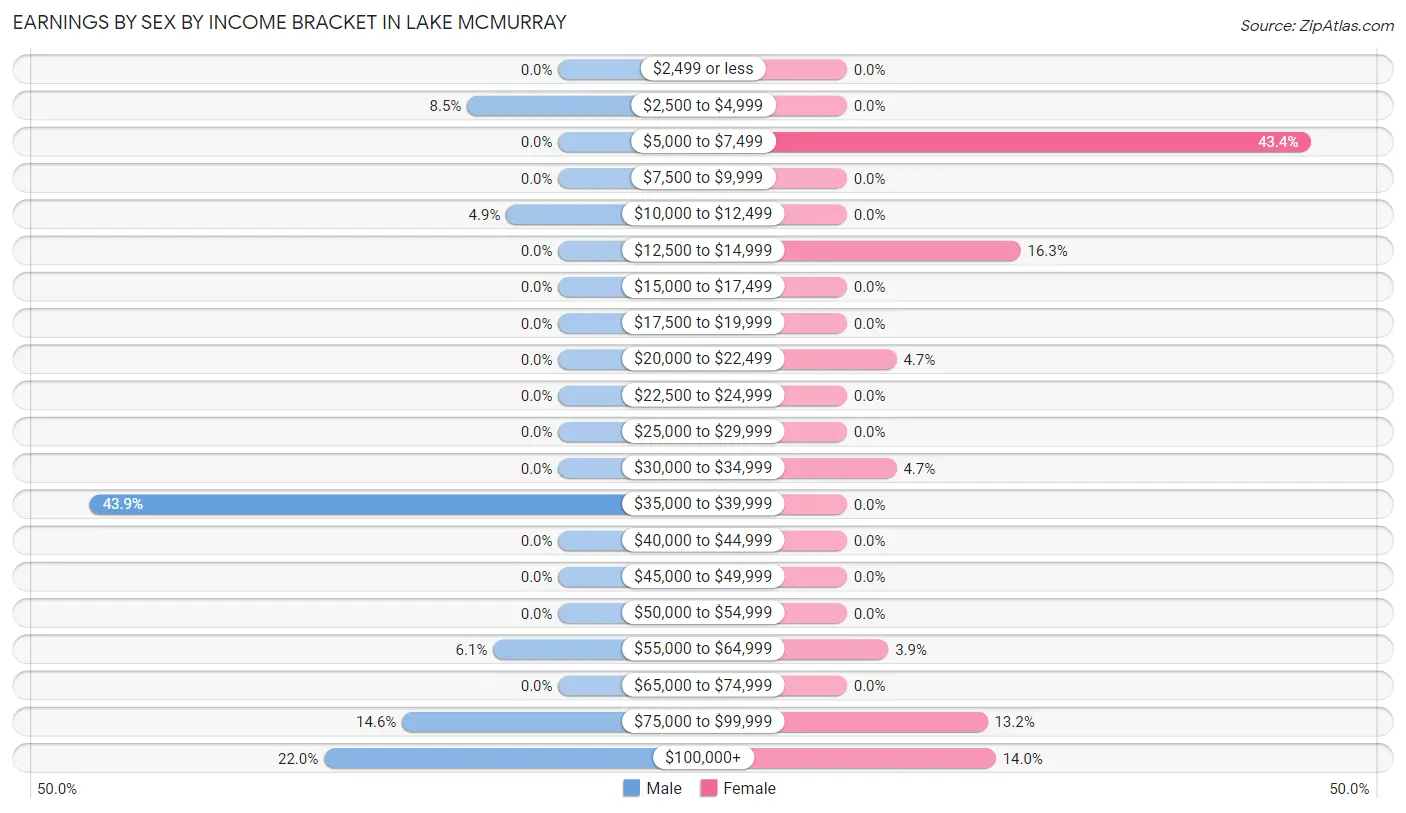
Earnings by Sex by Income Bracket in Lake McMurray
The most common earnings brackets in Lake McMurray are $35,000 to $39,999 for men (36 | 43.9%) and $5,000 to $7,499 for women (56 | 43.4%).
| Income | Male | Female |
| $2,499 or less | 0 (0.0%) | 0 (0.0%) |
| $2,500 to $4,999 | 7 (8.5%) | 0 (0.0%) |
| $5,000 to $7,499 | 0 (0.0%) | 56 (43.4%) |
| $7,500 to $9,999 | 0 (0.0%) | 0 (0.0%) |
| $10,000 to $12,499 | 4 (4.9%) | 0 (0.0%) |
| $12,500 to $14,999 | 0 (0.0%) | 21 (16.3%) |
| $15,000 to $17,499 | 0 (0.0%) | 0 (0.0%) |
| $17,500 to $19,999 | 0 (0.0%) | 0 (0.0%) |
| $20,000 to $22,499 | 0 (0.0%) | 6 (4.6%) |
| $22,500 to $24,999 | 0 (0.0%) | 0 (0.0%) |
| $25,000 to $29,999 | 0 (0.0%) | 0 (0.0%) |
| $30,000 to $34,999 | 0 (0.0%) | 6 (4.6%) |
| $35,000 to $39,999 | 36 (43.9%) | 0 (0.0%) |
| $40,000 to $44,999 | 0 (0.0%) | 0 (0.0%) |
| $45,000 to $49,999 | 0 (0.0%) | 0 (0.0%) |
| $50,000 to $54,999 | 0 (0.0%) | 0 (0.0%) |
| $55,000 to $64,999 | 5 (6.1%) | 5 (3.9%) |
| $65,000 to $74,999 | 0 (0.0%) | 0 (0.0%) |
| $75,000 to $99,999 | 12 (14.6%) | 17 (13.2%) |
| $100,000+ | 18 (22.0%) | 18 (14.0%) |
| Total | 82 (100.0%) | 129 (100.0%) |
Earnings by Sex by Educational Attainment in Lake McMurray
| Educational Attainment | Male Income | Female Income |
| Less than High School | - | - |
| High School Diploma | - | - |
| College or Associate's Degree | - | - |
| Bachelor's Degree | - | - |
| Graduate Degree | - | - |
| Total | - | - |
Family Income in Lake McMurray
Family Income Brackets in Lake McMurray
According to the Lake McMurray family income data, there are 38 families falling into the $200,000+ income range, which is the most common income bracket and makes up 35.5% of all families.
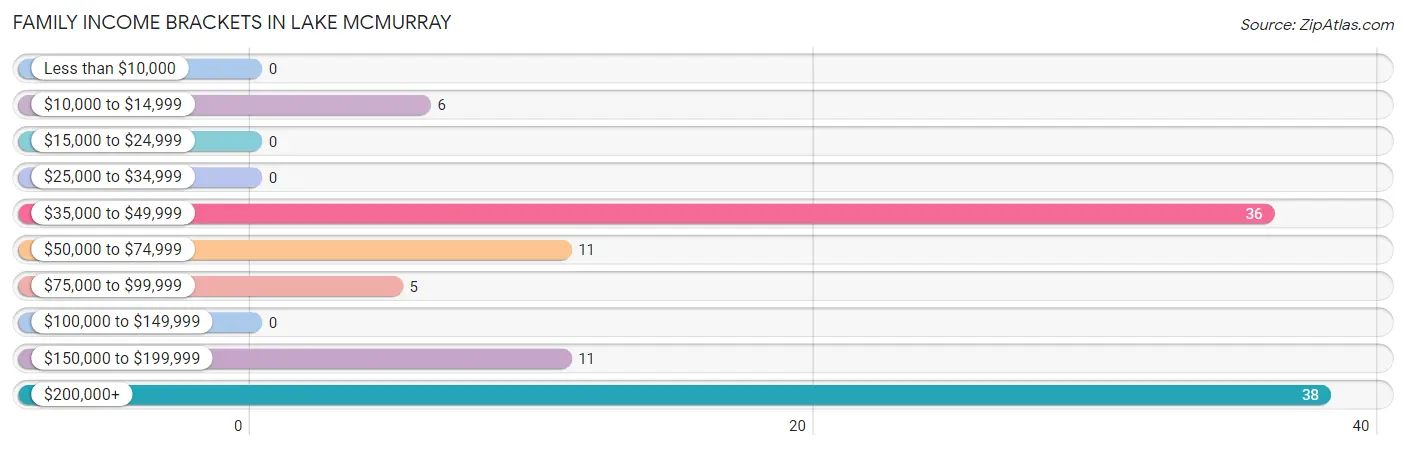
| Income Bracket | # Families | % Families |
| Less than $10,000 | 0 | 0.0% |
| $10,000 to $14,999 | 6 | 5.6% |
| $15,000 to $24,999 | 0 | 0.0% |
| $25,000 to $34,999 | 0 | 0.0% |
| $35,000 to $49,999 | 36 | 33.6% |
| $50,000 to $74,999 | 11 | 10.3% |
| $75,000 to $99,999 | 5 | 4.7% |
| $100,000 to $149,999 | 0 | 0.0% |
| $150,000 to $199,999 | 11 | 10.3% |
| $200,000+ | 38 | 35.5% |
Family Income by Famaliy Size in Lake McMurray
4-person families (29 | 27.1%) account for the highest median family income in Lake McMurray with $218,438 per family, while 4-person families (29 | 27.1%) have the highest median income of $54,610 per family member.
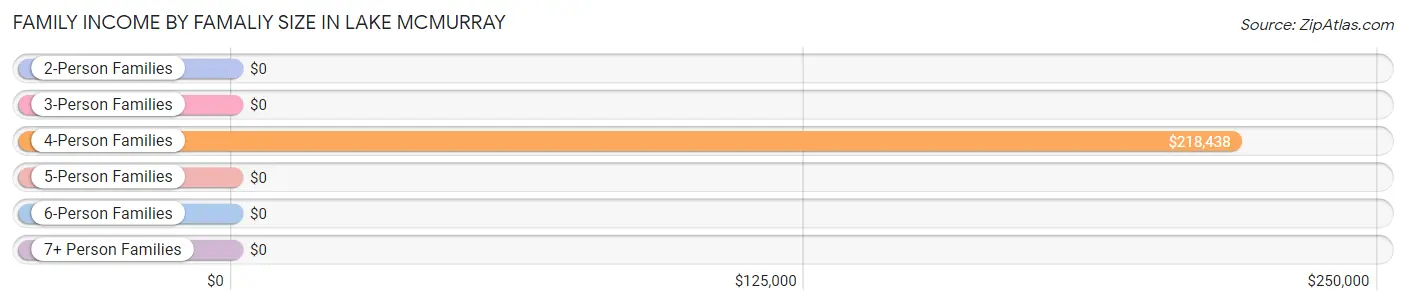
| Income Bracket | # Families | Median Income |
| 2-Person Families | 72 (67.3%) | $0 |
| 3-Person Families | 0 (0.0%) | $0 |
| 4-Person Families | 29 (27.1%) | $218,438 |
| 5-Person Families | 6 (5.6%) | $0 |
| 6-Person Families | 0 (0.0%) | $0 |
| 7+ Person Families | 0 (0.0%) | $0 |
| Total | 107 (100.0%) | $0 |
Family Income by Number of Earners in Lake McMurray
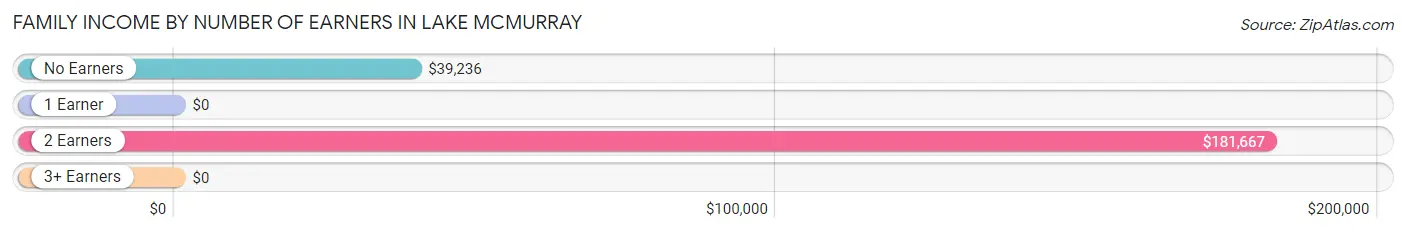
| Number of Earners | # Families | Median Income |
| No Earners | 62 (57.9%) | $39,236 |
| 1 Earner | 5 (4.7%) | $0 |
| 2 Earners | 18 (16.8%) | $181,667 |
| 3+ Earners | 22 (20.6%) | $0 |
| Total | 107 (100.0%) | $0 |
Household Income in Lake McMurray
Household Income Brackets in Lake McMurray
With 81 households falling in the category, the $35,000 to $49,999 income range is the most frequent in Lake McMurray, accounting for 47.6% of all households.
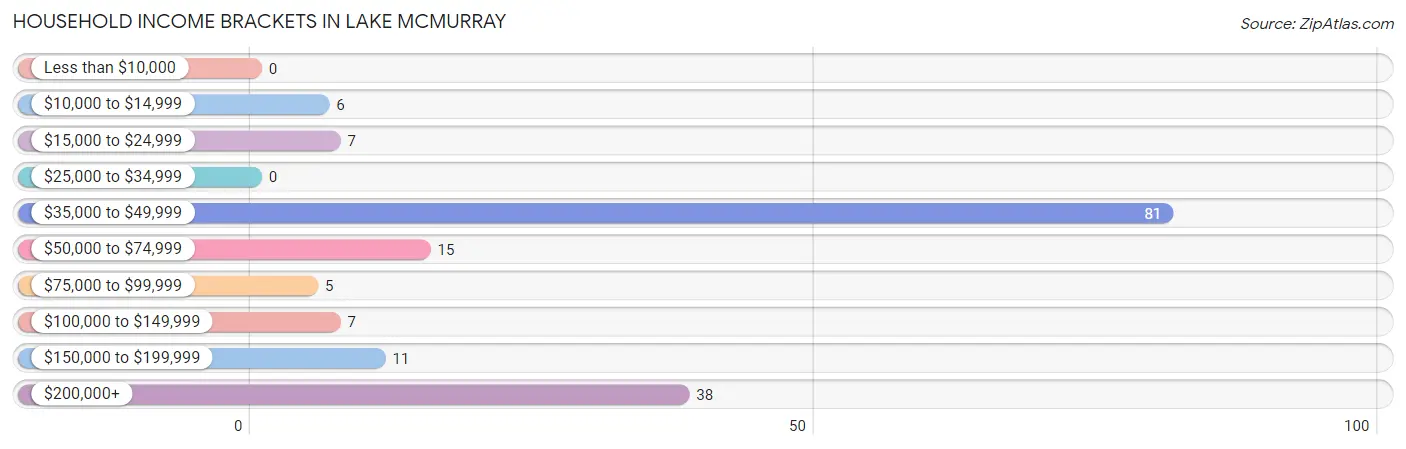
| Income Bracket | # Households | % Households |
| Less than $10,000 | 0 | 0.0% |
| $10,000 to $14,999 | 6 | 3.5% |
| $15,000 to $24,999 | 7 | 4.1% |
| $25,000 to $34,999 | 0 | 0.0% |
| $35,000 to $49,999 | 81 | 47.6% |
| $50,000 to $74,999 | 15 | 8.8% |
| $75,000 to $99,999 | 5 | 2.9% |
| $100,000 to $149,999 | 7 | 4.1% |
| $150,000 to $199,999 | 11 | 6.5% |
| $200,000+ | 38 | 22.4% |
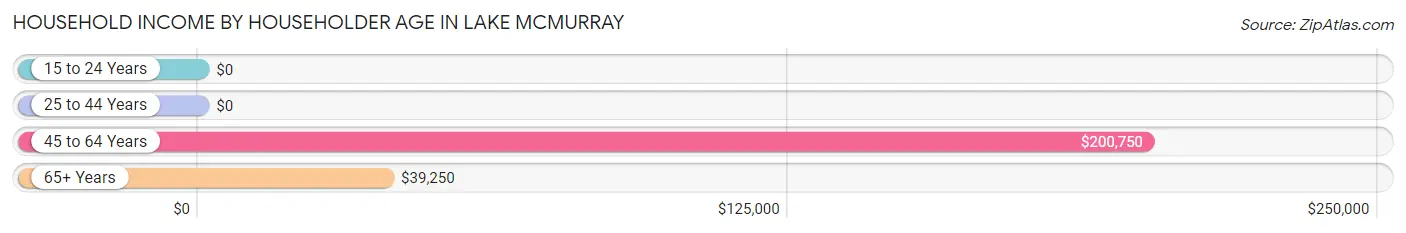
Household Income by Householder Age in Lake McMurray
The median household income in Lake McMurray is $41,875, with the highest median household income of $200,750 found in the 45 to 64 years age bracket for the primary householder. A total of 38 households (22.4%) fall into this category.
| Income Bracket | # Households | Median Income |
| 15 to 24 Years | 0 (0.0%) | $0 |
| 25 to 44 Years | 43 (25.3%) | $0 |
| 45 to 64 Years | 38 (22.4%) | $200,750 |
| 65+ Years | 89 (52.3%) | $39,250 |
| Total | 170 (100.0%) | $41,875 |
Poverty in Lake McMurray
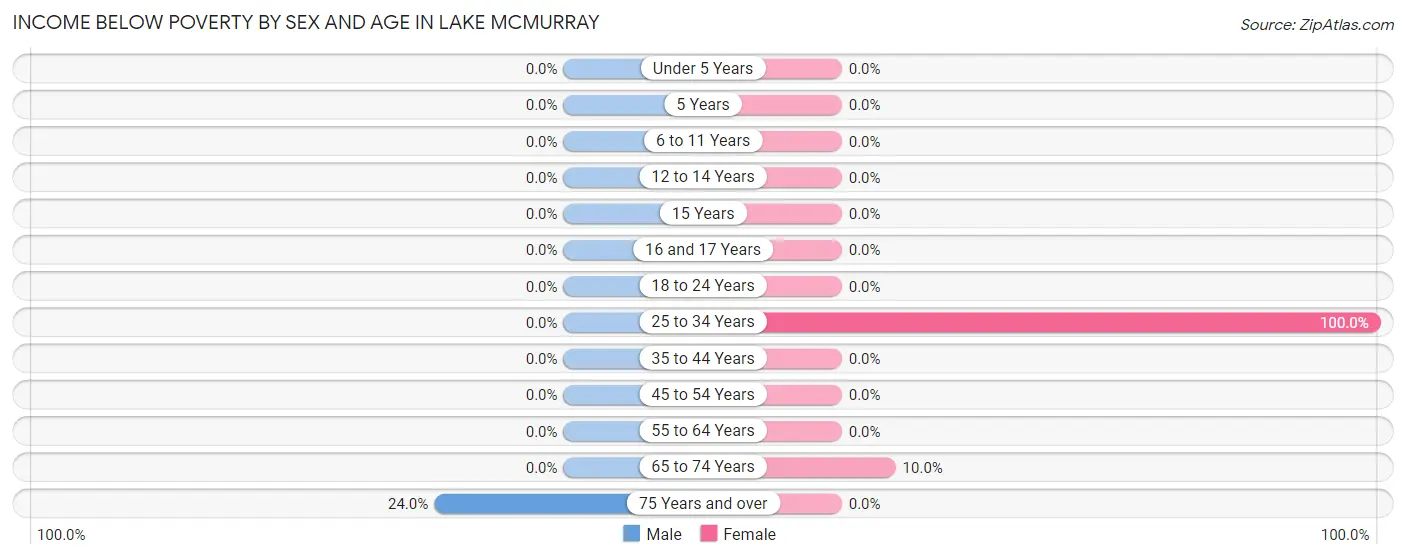
Income Below Poverty by Sex and Age in Lake McMurray
With 3.5% poverty level for males and 17.8% for females among the residents of Lake McMurray, 75 year old and over males and 25 to 34 year old females are the most vulnerable to poverty, with 6 males (24.0%) and 35 females (100.0%) in their respective age groups living below the poverty level.
| Age Bracket | Male | Female |
| Under 5 Years | 0 (0.0%) | 0 (0.0%) |
| 5 Years | 0 (0.0%) | 0 (0.0%) |
| 6 to 11 Years | 0 (0.0%) | 0 (0.0%) |
| 12 to 14 Years | 0 (0.0%) | 0 (0.0%) |
| 15 Years | 0 (0.0%) | 0 (0.0%) |
| 16 and 17 Years | 0 (0.0%) | 0 (0.0%) |
| 18 to 24 Years | 0 (0.0%) | 0 (0.0%) |
| 25 to 34 Years | 0 (0.0%) | 35 (100.0%) |
| 35 to 44 Years | 0 (0.0%) | 0 (0.0%) |
| 45 to 54 Years | 0 (0.0%) | 0 (0.0%) |
| 55 to 64 Years | 0 (0.0%) | 0 (0.0%) |
| 65 to 74 Years | 0 (0.0%) | 6 (10.0%) |
| 75 Years and over | 6 (24.0%) | 0 (0.0%) |
| Total | 6 (3.5%) | 41 (17.8%) |
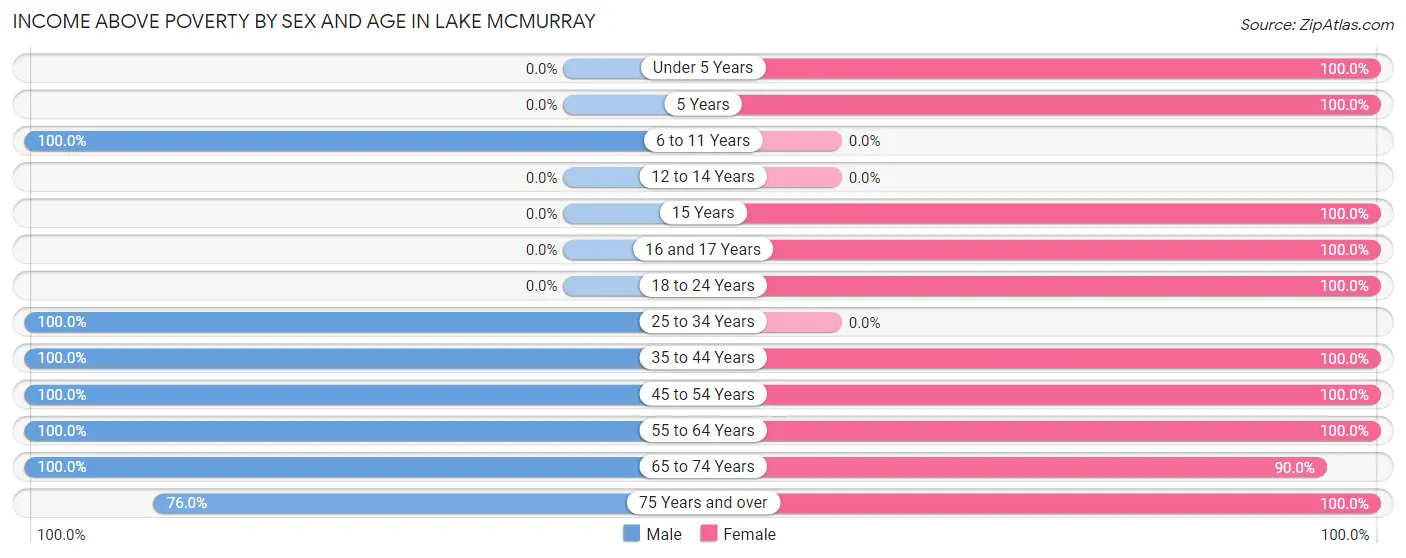
Income Above Poverty by Sex and Age in Lake McMurray
According to the poverty statistics in Lake McMurray, males aged 6 to 11 years and females aged under 5 years are the age groups that are most secure financially, with 100.0% of males and 100.0% of females in these age groups living above the poverty line.
| Age Bracket | Male | Female |
| Under 5 Years | 0 (0.0%) | 7 (100.0%) |
| 5 Years | 0 (0.0%) | 6 (100.0%) |
| 6 to 11 Years | 10 (100.0%) | 0 (0.0%) |
| 12 to 14 Years | 0 (0.0%) | 0 (0.0%) |
| 15 Years | 0 (0.0%) | 13 (100.0%) |
| 16 and 17 Years | 0 (0.0%) | 6 (100.0%) |
| 18 to 24 Years | 0 (0.0%) | 43 (100.0%) |
| 25 to 34 Years | 36 (100.0%) | 0 (0.0%) |
| 35 to 44 Years | 7 (100.0%) | 18 (100.0%) |
| 45 to 54 Years | 28 (100.0%) | 21 (100.0%) |
| 55 to 64 Years | 5 (100.0%) | 5 (100.0%) |
| 65 to 74 Years | 61 (100.0%) | 54 (90.0%) |
| 75 Years and over | 19 (76.0%) | 16 (100.0%) |
| Total | 166 (96.5%) | 189 (82.2%) |
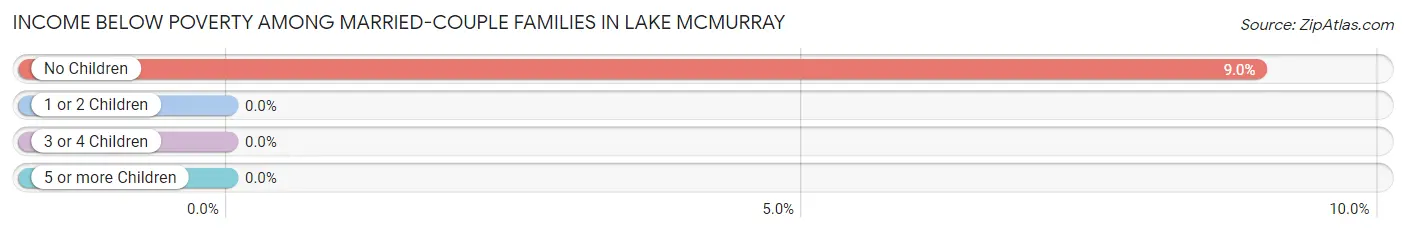
Income Below Poverty Among Married-Couple Families in Lake McMurray
The poverty statistics for married-couple families in Lake McMurray show that 5.9% or 6 of the total 102 families live below the poverty line. Families with no children have the highest poverty rate of 9.0%, comprising of 6 families. On the other hand, families with 1 or 2 children have the lowest poverty rate of 0.0%, which includes 0 families.
| Children | Above Poverty | Below Poverty |
| No Children | 61 (91.0%) | 6 (9.0%) |
| 1 or 2 Children | 35 (100.0%) | 0 (0.0%) |
| 3 or 4 Children | 0 (0.0%) | 0 (0.0%) |
| 5 or more Children | 0 (0.0%) | 0 (0.0%) |
| Total | 96 (94.1%) | 6 (5.9%) |
Income Below Poverty Among Single-Parent Households in Lake McMurray
| Children | Single Father | Single Mother |
| No Children | 0 (0.0%) | 0 (0.0%) |
| 1 or 2 Children | 0 (0.0%) | 0 (0.0%) |
| 3 or 4 Children | 0 (0.0%) | 0 (0.0%) |
| 5 or more Children | 0 (0.0%) | 0 (0.0%) |
| Total | 0 (0.0%) | 0 (0.0%) |
Income Below Poverty Among Married-Couple vs Single-Parent Households in Lake McMurray
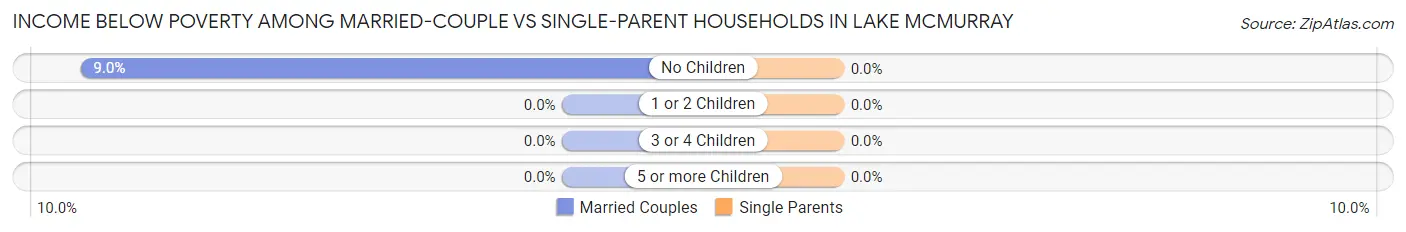
| Children | Married-Couple Families | Single-Parent Households |
| No Children | 6 (9.0%) | 0 (0.0%) |
| 1 or 2 Children | 0 (0.0%) | 0 (0.0%) |
| 3 or 4 Children | 0 (0.0%) | 0 (0.0%) |
| 5 or more Children | 0 (0.0%) | 0 (0.0%) |
| Total | 6 (5.9%) | 0 (0.0%) |
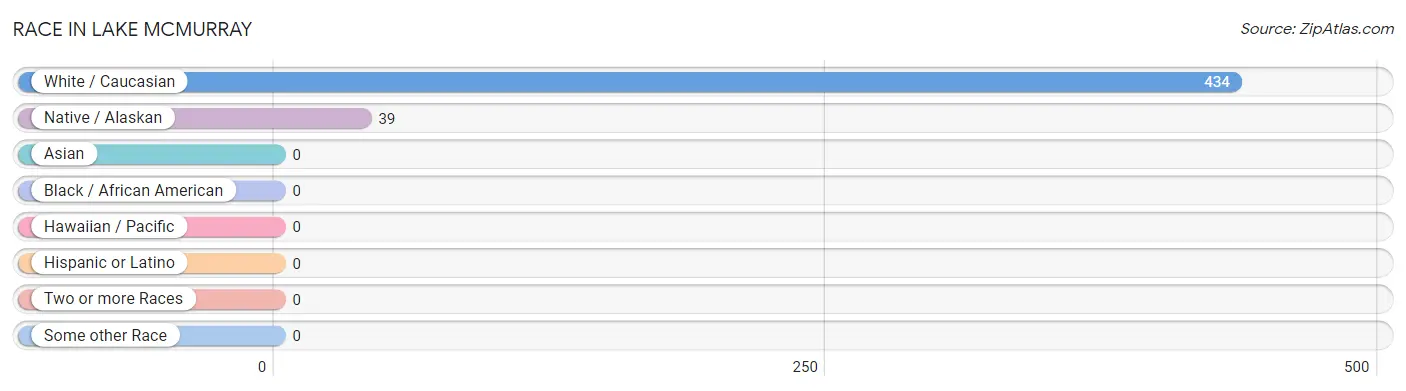
Race in Lake McMurray
The most populous races in Lake McMurray are White / Caucasian (434 | 91.7%), and Native / Alaskan (39 | 8.3%).
| Race | # Population | % Population |
| Asian | 0 | 0.0% |
| Black / African American | 0 | 0.0% |
| Hawaiian / Pacific | 0 | 0.0% |
| Hispanic or Latino | 0 | 0.0% |
| Native / Alaskan | 39 | 8.3% |
| White / Caucasian | 434 | 91.7% |
| Two or more Races | 0 | 0.0% |
| Some other Race | 0 | 0.0% |
| Total | 473 | 100.0% |
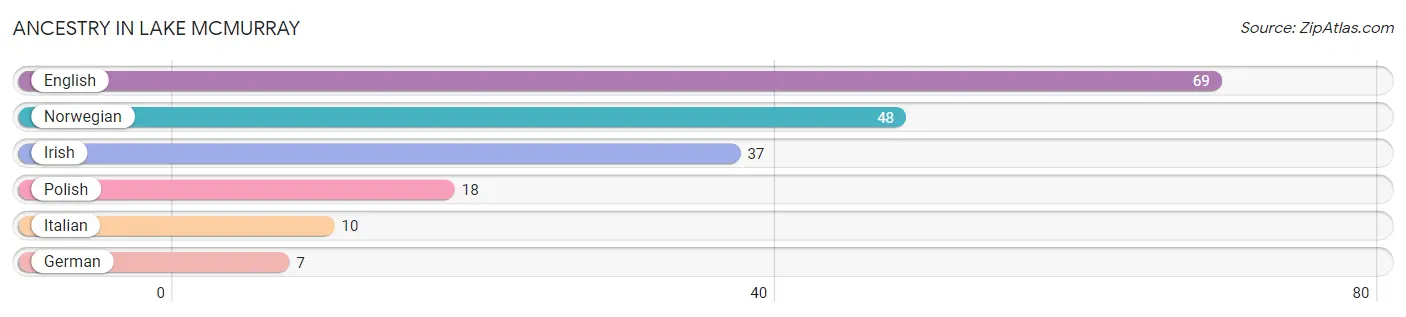
Ancestry in Lake McMurray
The most populous ancestries reported in Lake McMurray are English (69 | 14.6%), Norwegian (48 | 10.2%), Irish (37 | 7.8%), Polish (18 | 3.8%), and Italian (10 | 2.1%), together accounting for 38.5% of all Lake McMurray residents.
| Ancestry | # Population | % Population |
| English | 69 | 14.6% |
| German | 7 | 1.5% |
| Irish | 37 | 7.8% |
| Italian | 10 | 2.1% |
| Norwegian | 48 | 10.2% |
| Polish | 18 | 3.8% | View All 6 Rows |
Immigrants in Lake McMurray
The most numerous immigrant groups reported in Lake McMurray came from Europe (13 | 2.8%), Northern Europe (13 | 2.8%), and Norway (13 | 2.8%), together accounting for 8.3% of all Lake McMurray residents.
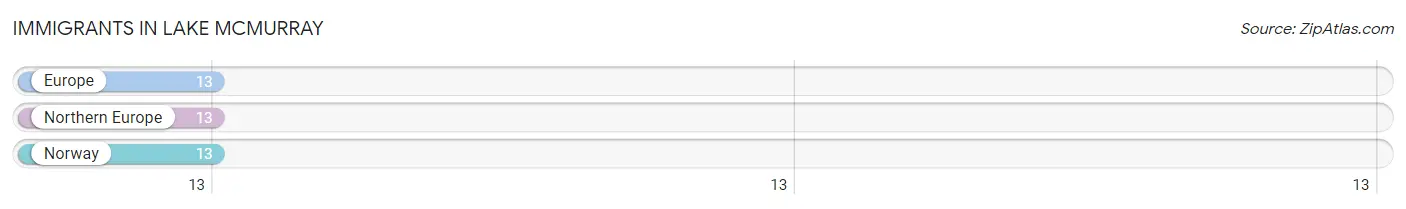
| Immigration Origin | # Population | % Population |
| Europe | 13 | 2.8% |
| Northern Europe | 13 | 2.8% |
| Norway | 13 | 2.8% | View All 3 Rows |
Sex and Age in Lake McMurray
Sex and Age in Lake McMurray
The most populous age groups in Lake McMurray are 10 to 14 Years (49 | 23.2%) for men and 65 to 69 Years (47 | 17.9%) for women.
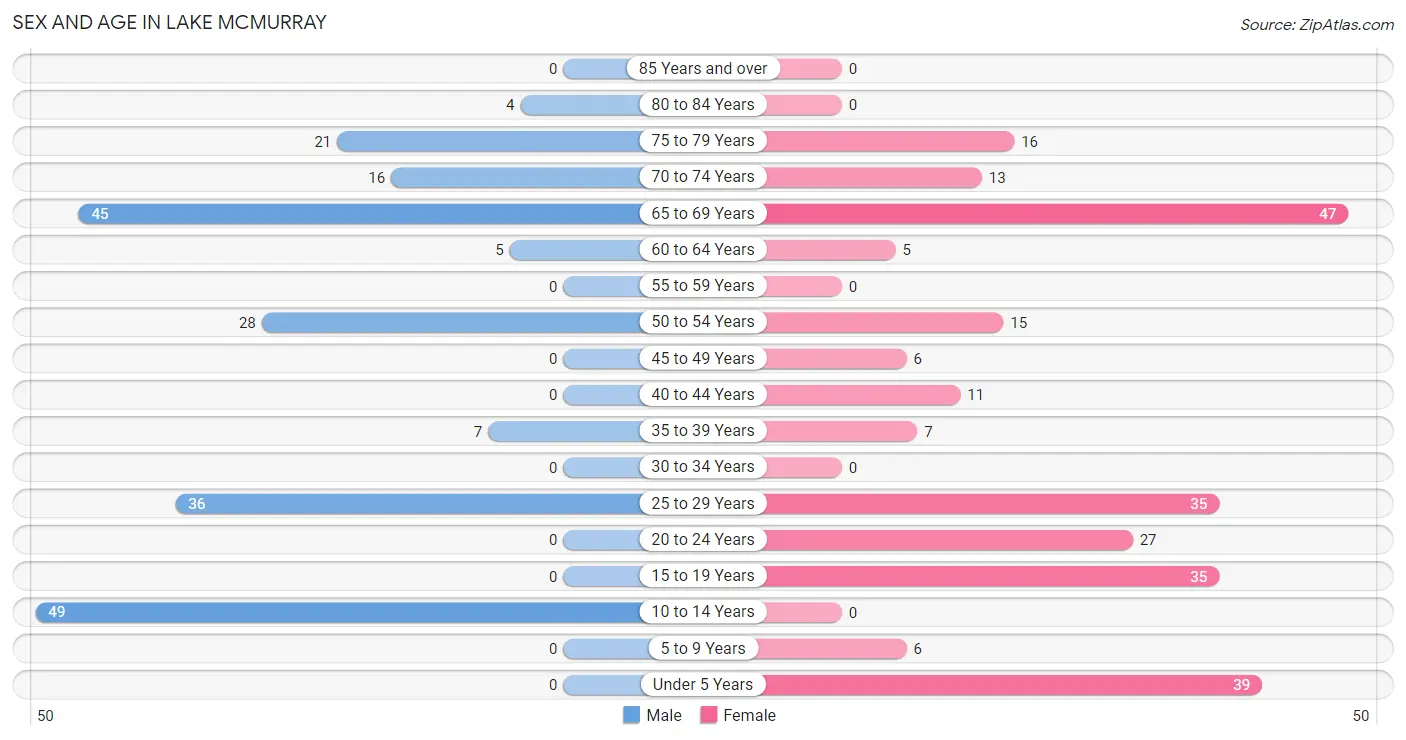
| Age Bracket | Male | Female |
| Under 5 Years | 0 (0.0%) | 39 (14.9%) |
| 5 to 9 Years | 0 (0.0%) | 6 (2.3%) |
| 10 to 14 Years | 49 (23.2%) | 0 (0.0%) |
| 15 to 19 Years | 0 (0.0%) | 35 (13.4%) |
| 20 to 24 Years | 0 (0.0%) | 27 (10.3%) |
| 25 to 29 Years | 36 (17.1%) | 35 (13.4%) |
| 30 to 34 Years | 0 (0.0%) | 0 (0.0%) |
| 35 to 39 Years | 7 (3.3%) | 7 (2.7%) |
| 40 to 44 Years | 0 (0.0%) | 11 (4.2%) |
| 45 to 49 Years | 0 (0.0%) | 6 (2.3%) |
| 50 to 54 Years | 28 (13.3%) | 15 (5.7%) |
| 55 to 59 Years | 0 (0.0%) | 0 (0.0%) |
| 60 to 64 Years | 5 (2.4%) | 5 (1.9%) |
| 65 to 69 Years | 45 (21.3%) | 47 (17.9%) |
| 70 to 74 Years | 16 (7.6%) | 13 (5.0%) |
| 75 to 79 Years | 21 (10.0%) | 16 (6.1%) |
| 80 to 84 Years | 4 (1.9%) | 0 (0.0%) |
| 85 Years and over | 0 (0.0%) | 0 (0.0%) |
| Total | 211 (100.0%) | 262 (100.0%) |
Families and Households in Lake McMurray
Median Family Size in Lake McMurray
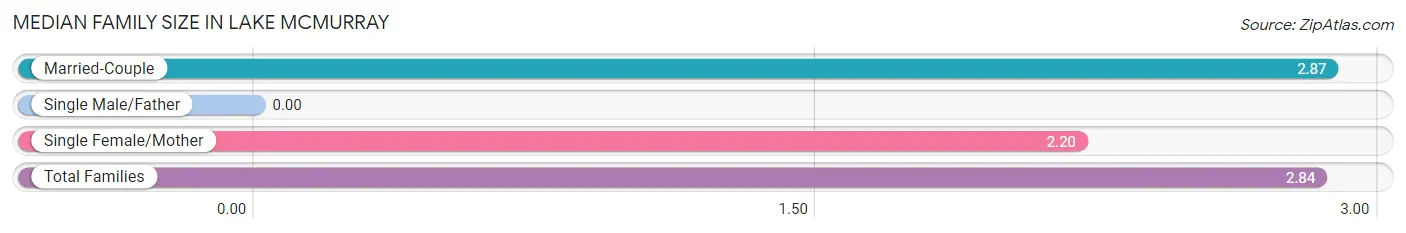
| Family Type | # Families | Family Size |
| Married-Couple | 102 (95.3%) | 2.87 |
| Single Male/Father | 0 (0.0%) | - |
| Single Female/Mother | 5 (4.7%) | 2.20 |
| Total Families | 107 (100.0%) | 2.84 |
Median Household Size in Lake McMurray
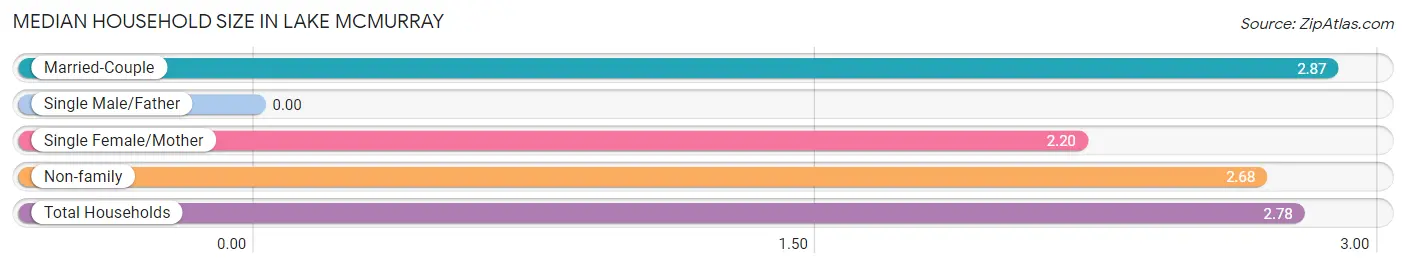
| Household Type | # Households | Household Size |
| Married-Couple | 102 (60.0%) | 2.87 |
| Single Male/Father | 0 (0.0%) | - |
| Single Female/Mother | 5 (2.9%) | 2.20 |
| Non-family | 63 (37.1%) | 2.68 |
| Total Households | 170 (100.0%) | 2.78 |
Household Size by Marriage Status in Lake McMurray
Out of a total of 170 households in Lake McMurray, 107 (62.9%) are family households, while 63 (37.1%) are nonfamily households. The most numerous type of family households are 2-person households, comprising 72, and the most common type of nonfamily households are 4-person households, comprising 36.
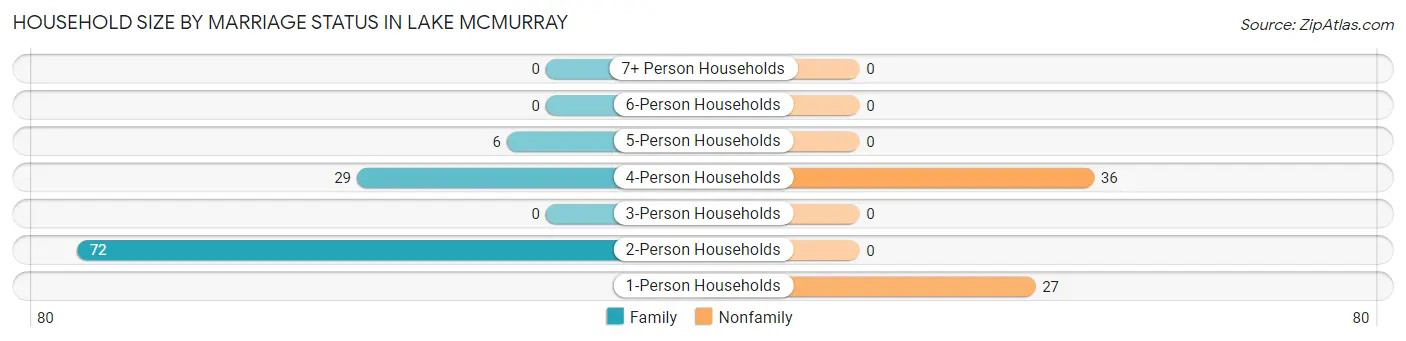
| Household Size | Family Households | Nonfamily Households |
| 1-Person Households | - | 27 (15.9%) |
| 2-Person Households | 72 (42.3%) | 0 (0.0%) |
| 3-Person Households | 0 (0.0%) | 0 (0.0%) |
| 4-Person Households | 29 (17.1%) | 36 (21.2%) |
| 5-Person Households | 6 (3.5%) | 0 (0.0%) |
| 6-Person Households | 0 (0.0%) | 0 (0.0%) |
| 7+ Person Households | 0 (0.0%) | 0 (0.0%) |
| Total | 107 (62.9%) | 63 (37.1%) |
Female Fertility in Lake McMurray
Fertility by Age in Lake McMurray
| Age Bracket | Women with Births | Births / 1,000 Women |
| 15 to 19 years | 0 (0.0%) | 0.0 |
| 20 to 34 years | 0 (0.0%) | 0.0 |
| 35 to 50 years | 0 (0.0%) | 0.0 |
| Total | 0 (0.0%) | 0.0 |
Fertility by Age by Marriage Status in Lake McMurray
| Age Bracket | Married | Unmarried |
| 15 to 19 years | 0 (0.0%) | 0 (0.0%) |
| 20 to 34 years | 0 (0.0%) | 0 (0.0%) |
| 35 to 50 years | 0 (0.0%) | 0 (0.0%) |
| Total | 0 (0.0%) | 0 (0.0%) |
Fertility by Education in Lake McMurray
| Educational Attainment | Women with Births | Births / 1,000 Women |
| Less than High School | 0 (0.0%) | 0.0 |
| High School Diploma | 0 (0.0%) | 0.0 |
| College or Associate's Degree | 0 (0.0%) | 0.0 |
| Bachelor's Degree | 0 (0.0%) | 0.0 |
| Graduate Degree | 0 (0.0%) | 0.0 |
| Total | 0 (0.0%) | 0.0 |
Fertility by Education by Marriage Status in Lake McMurray
| Educational Attainment | Married | Unmarried |
| Less than High School | 0 (0.0%) | 0 (0.0%) |
| High School Diploma | 0 (0.0%) | 0 (0.0%) |
| College or Associate's Degree | 0 (0.0%) | 0 (0.0%) |
| Bachelor's Degree | 0 (0.0%) | 0 (0.0%) |
| Graduate Degree | 0 (0.0%) | 0 (0.0%) |
| Total | 0 (0.0%) | 0 (0.0%) |
Employment Characteristics in Lake McMurray
Employment by Class of Employer in Lake McMurray
Among the 176 employed individuals in Lake McMurray, private company employees (130 | 73.9%), not-for-profit organizations (27 | 15.3%), and local government employees (12 | 6.8%) make up the most common classes of employment.
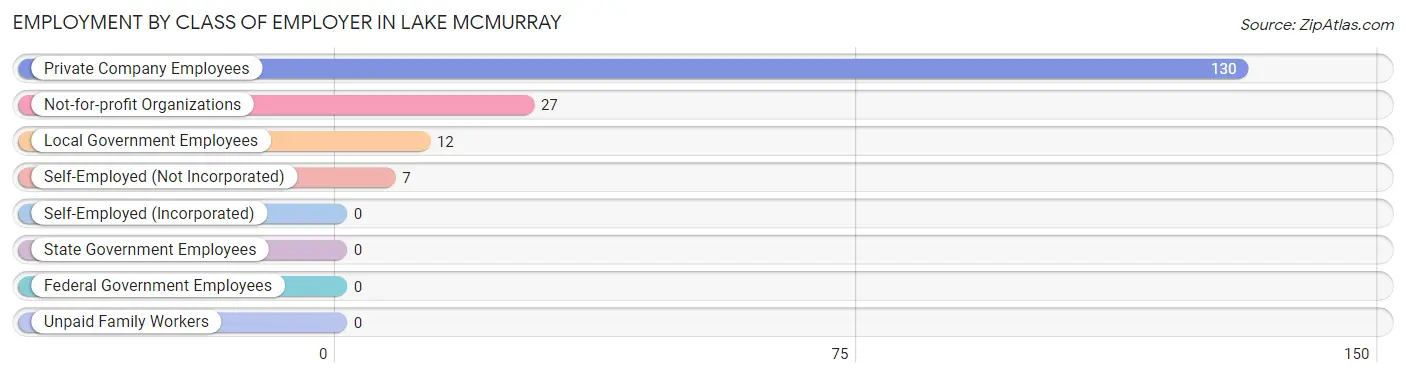
| Employer Class | # Employees | % Employees |
| Private Company Employees | 130 | 73.9% |
| Self-Employed (Incorporated) | 0 | 0.0% |
| Self-Employed (Not Incorporated) | 7 | 4.0% |
| Not-for-profit Organizations | 27 | 15.3% |
| Local Government Employees | 12 | 6.8% |
| State Government Employees | 0 | 0.0% |
| Federal Government Employees | 0 | 0.0% |
| Unpaid Family Workers | 0 | 0.0% |
| Total | 176 | 100.0% |
Employment Status by Age in Lake McMurray
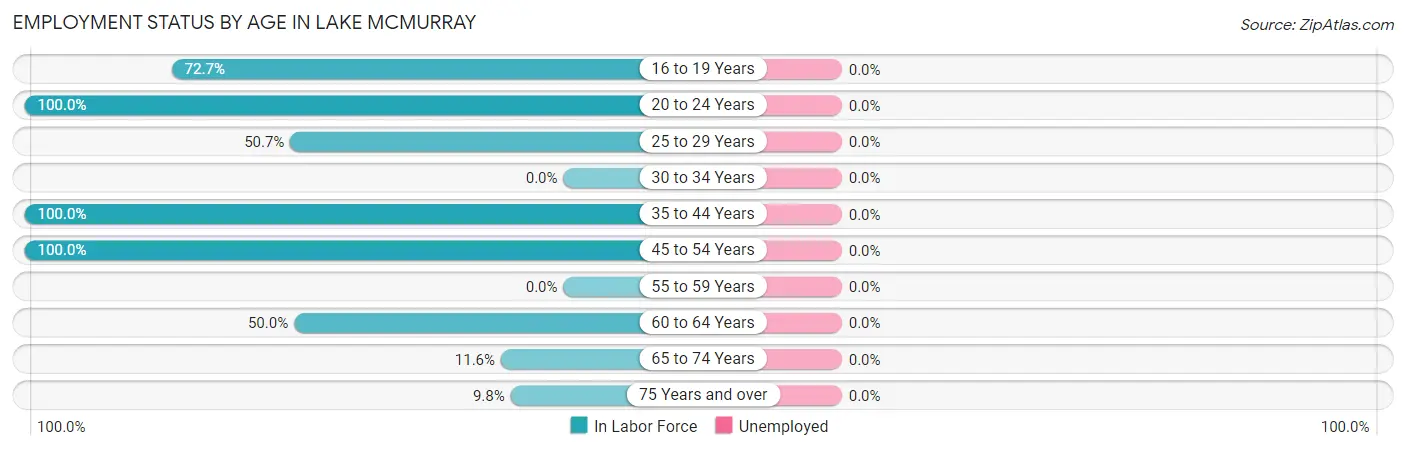
| Age Bracket | In Labor Force | Unemployed |
| 16 to 19 Years | 16 (72.7%) | 0 (0.0%) |
| 20 to 24 Years | 27 (100.0%) | 0 (0.0%) |
| 25 to 29 Years | 36 (50.7%) | 0 (0.0%) |
| 30 to 34 Years | 0 (0.0%) | 0 (0.0%) |
| 35 to 44 Years | 25 (100.0%) | 0 (0.0%) |
| 45 to 54 Years | 49 (100.0%) | 0 (0.0%) |
| 55 to 59 Years | 0 (0.0%) | 0 (0.0%) |
| 60 to 64 Years | 5 (50.0%) | 0 (0.0%) |
| 65 to 74 Years | 14 (11.6%) | 0 (0.0%) |
| 75 Years and over | 4 (9.8%) | 0 (0.0%) |
| Total | 176 (48.1%) | 0 (0.0%) |
Employment Status by Educational Attainment in Lake McMurray
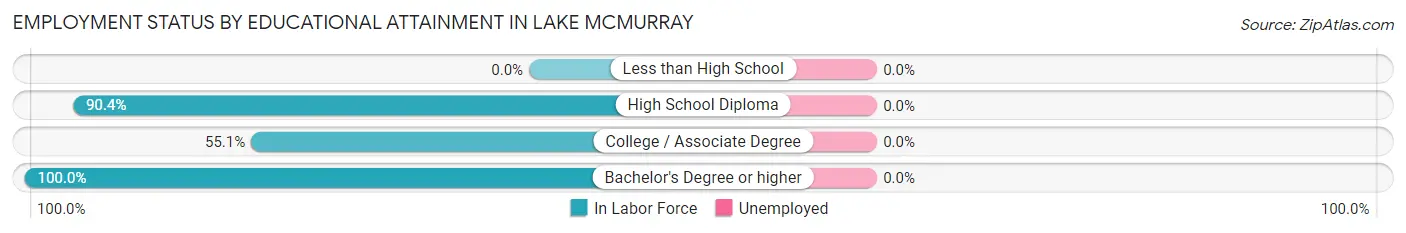
| Educational Attainment | In Labor Force | Unemployed |
| Less than High School | 0 (0.0%) | 0 (0.0%) |
| High School Diploma | 47 (90.4%) | 0 (0.0%) |
| College / Associate Degree | 43 (55.1%) | 0 (0.0%) |
| Bachelor's Degree or higher | 25 (100.0%) | 0 (0.0%) |
| Total | 115 (74.2%) | 0 (0.0%) |
Employment Occupations by Sex in Lake McMurray
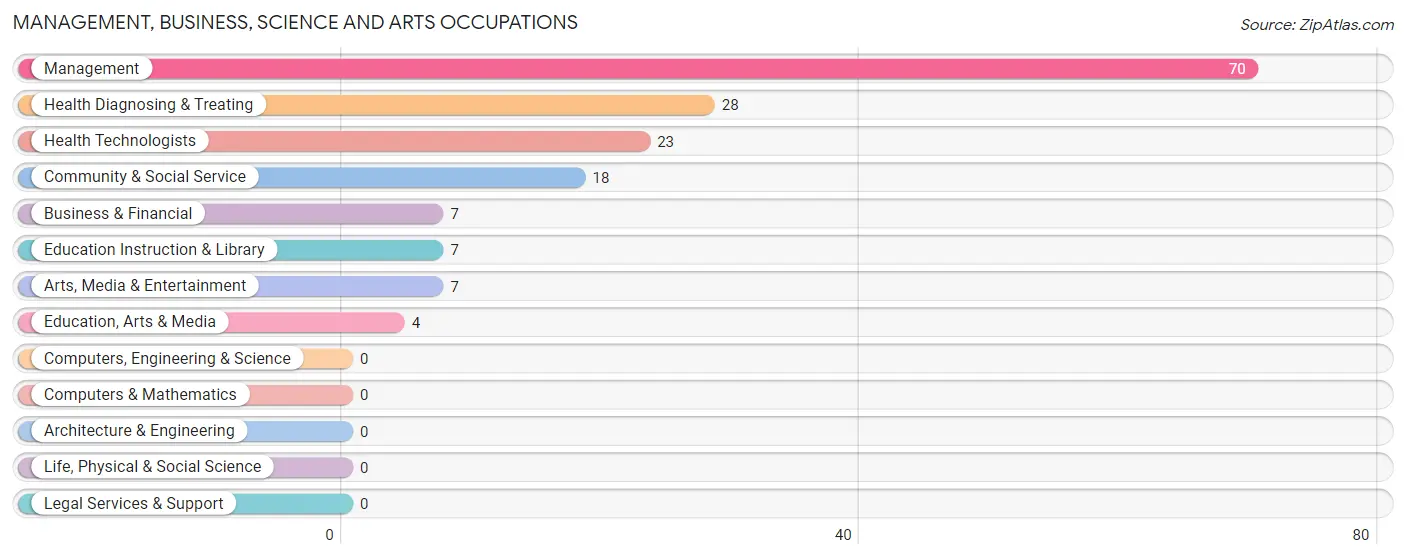
Management, Business, Science and Arts Occupations
The most common Management, Business, Science and Arts occupations in Lake McMurray are Management (70 | 39.8%), Health Diagnosing & Treating (28 | 15.9%), Health Technologists (23 | 13.1%), Community & Social Service (18 | 10.2%), and Business & Financial (7 | 4.0%).
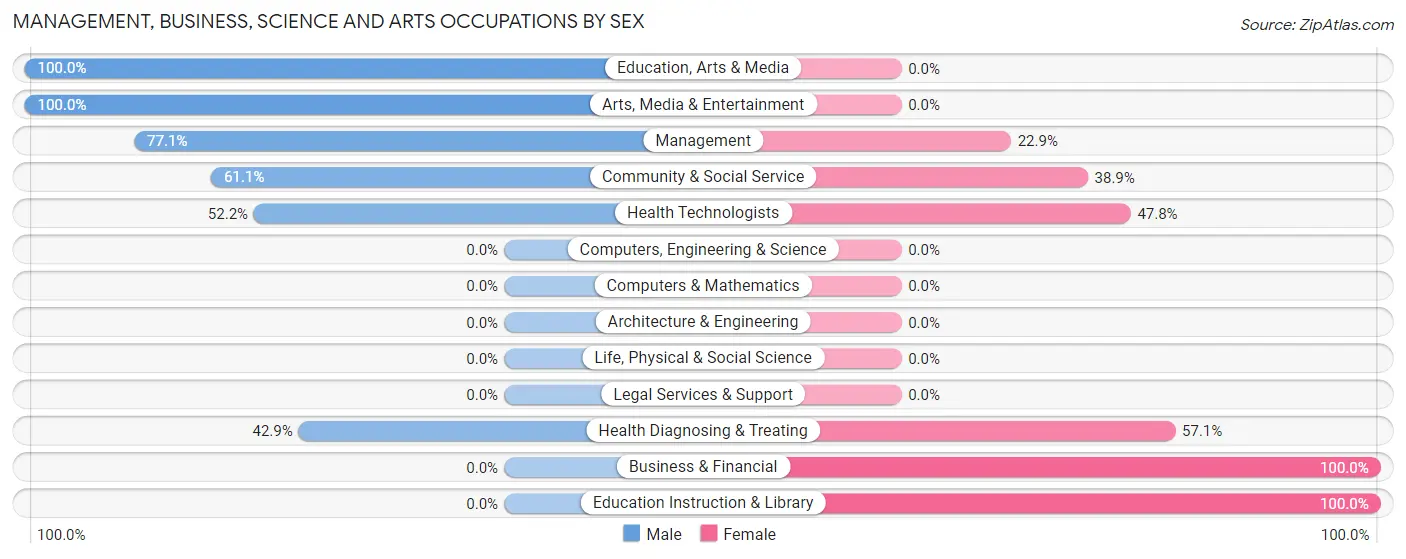
Management, Business, Science and Arts Occupations by Sex
Within the Management, Business, Science and Arts occupations in Lake McMurray, the most male-oriented occupations are Education, Arts & Media (100.0%), Arts, Media & Entertainment (100.0%), and Management (77.1%), while the most female-oriented occupations are Business & Financial (100.0%), Education Instruction & Library (100.0%), and Health Diagnosing & Treating (57.1%).
| Occupation | Male | Female |
| Management | 54 (77.1%) | 16 (22.9%) |
| Business & Financial | 0 (0.0%) | 7 (100.0%) |
| Computers, Engineering & Science | 0 (0.0%) | 0 (0.0%) |
| Computers & Mathematics | 0 (0.0%) | 0 (0.0%) |
| Architecture & Engineering | 0 (0.0%) | 0 (0.0%) |
| Life, Physical & Social Science | 0 (0.0%) | 0 (0.0%) |
| Community & Social Service | 11 (61.1%) | 7 (38.9%) |
| Education, Arts & Media | 4 (100.0%) | 0 (0.0%) |
| Legal Services & Support | 0 (0.0%) | 0 (0.0%) |
| Education Instruction & Library | 0 (0.0%) | 7 (100.0%) |
| Arts, Media & Entertainment | 7 (100.0%) | 0 (0.0%) |
| Health Diagnosing & Treating | 12 (42.9%) | 16 (57.1%) |
| Health Technologists | 12 (52.2%) | 11 (47.8%) |
| Total (Category) | 77 (62.6%) | 46 (37.4%) |
| Total (Overall) | 82 (46.6%) | 94 (53.4%) |
Services Occupations
Services Occupations by Sex
| Occupation | Male | Female |
| Healthcare Support | 0 (0.0%) | 0 (0.0%) |
| Security & Protection | 0 (0.0%) | 0 (0.0%) |
| Firefighting & Prevention | 0 (0.0%) | 0 (0.0%) |
| Law Enforcement | 0 (0.0%) | 0 (0.0%) |
| Food Preparation & Serving | 0 (0.0%) | 0 (0.0%) |
| Cleaning & Maintenance | 0 (0.0%) | 0 (0.0%) |
| Personal Care & Service | 0 (0.0%) | 0 (0.0%) |
| Total (Category) | 0 (0.0%) | 0 (0.0%) |
| Total (Overall) | 82 (46.6%) | 94 (53.4%) |
Sales and Office Occupations
The most common Sales and Office occupations in Lake McMurray are Sales & Related (16 | 9.1%), and Office & Administration (16 | 9.1%).
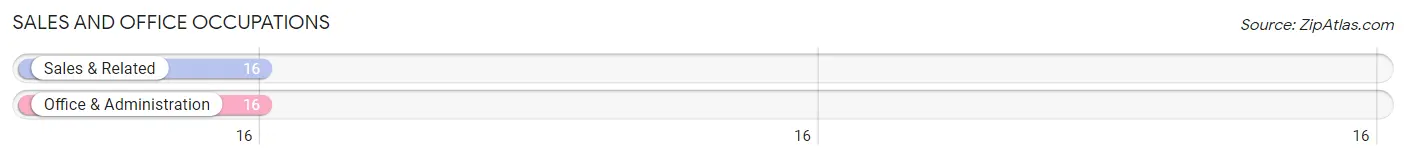
Sales and Office Occupations by Sex

| Occupation | Male | Female |
| Sales & Related | 5 (31.2%) | 11 (68.8%) |
| Office & Administration | 0 (0.0%) | 16 (100.0%) |
| Total (Category) | 5 (15.6%) | 27 (84.4%) |
| Total (Overall) | 82 (46.6%) | 94 (53.4%) |
Natural Resources, Construction and Maintenance Occupations
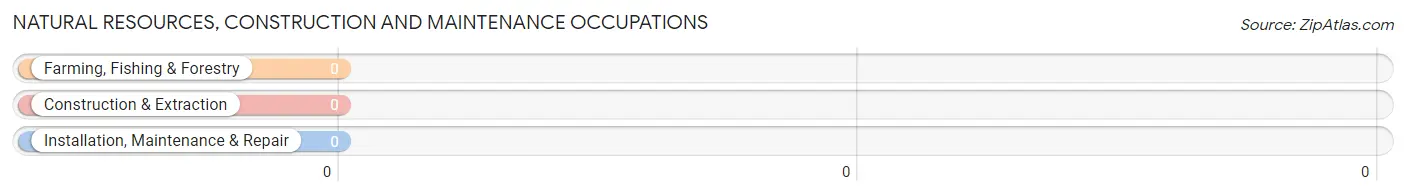
Natural Resources, Construction and Maintenance Occupations by Sex
| Occupation | Male | Female |
| Farming, Fishing & Forestry | 0 (0.0%) | 0 (0.0%) |
| Construction & Extraction | 0 (0.0%) | 0 (0.0%) |
| Installation, Maintenance & Repair | 0 (0.0%) | 0 (0.0%) |
| Total (Category) | 0 (0.0%) | 0 (0.0%) |
| Total (Overall) | 82 (46.6%) | 94 (53.4%) |
Production, Transportation and Moving Occupations
The most common Production, Transportation and Moving occupations in Lake McMurray are , and Material Moving (21 | 11.9%).
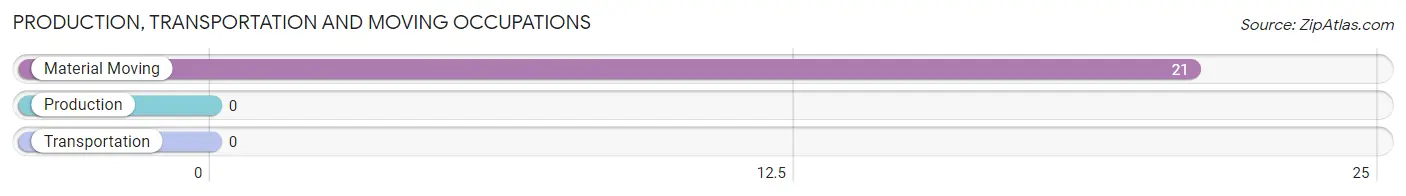
Production, Transportation and Moving Occupations by Sex
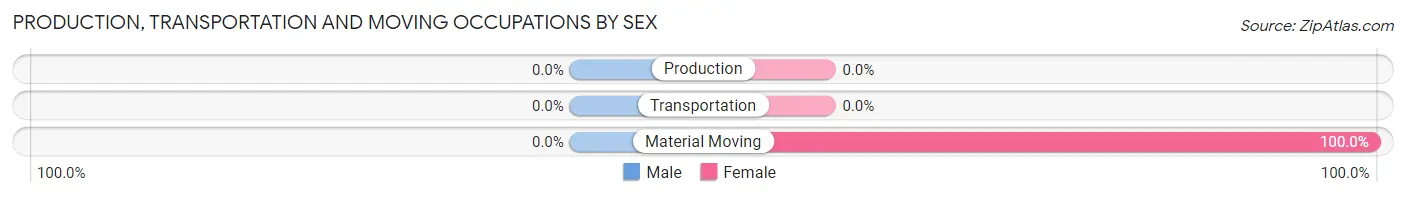
| Occupation | Male | Female |
| Production | 0 (0.0%) | 0 (0.0%) |
| Transportation | 0 (0.0%) | 0 (0.0%) |
| Material Moving | 0 (0.0%) | 21 (100.0%) |
| Total (Category) | 0 (0.0%) | 21 (100.0%) |
| Total (Overall) | 82 (46.6%) | 94 (53.4%) |
Employment Industries by Sex in Lake McMurray
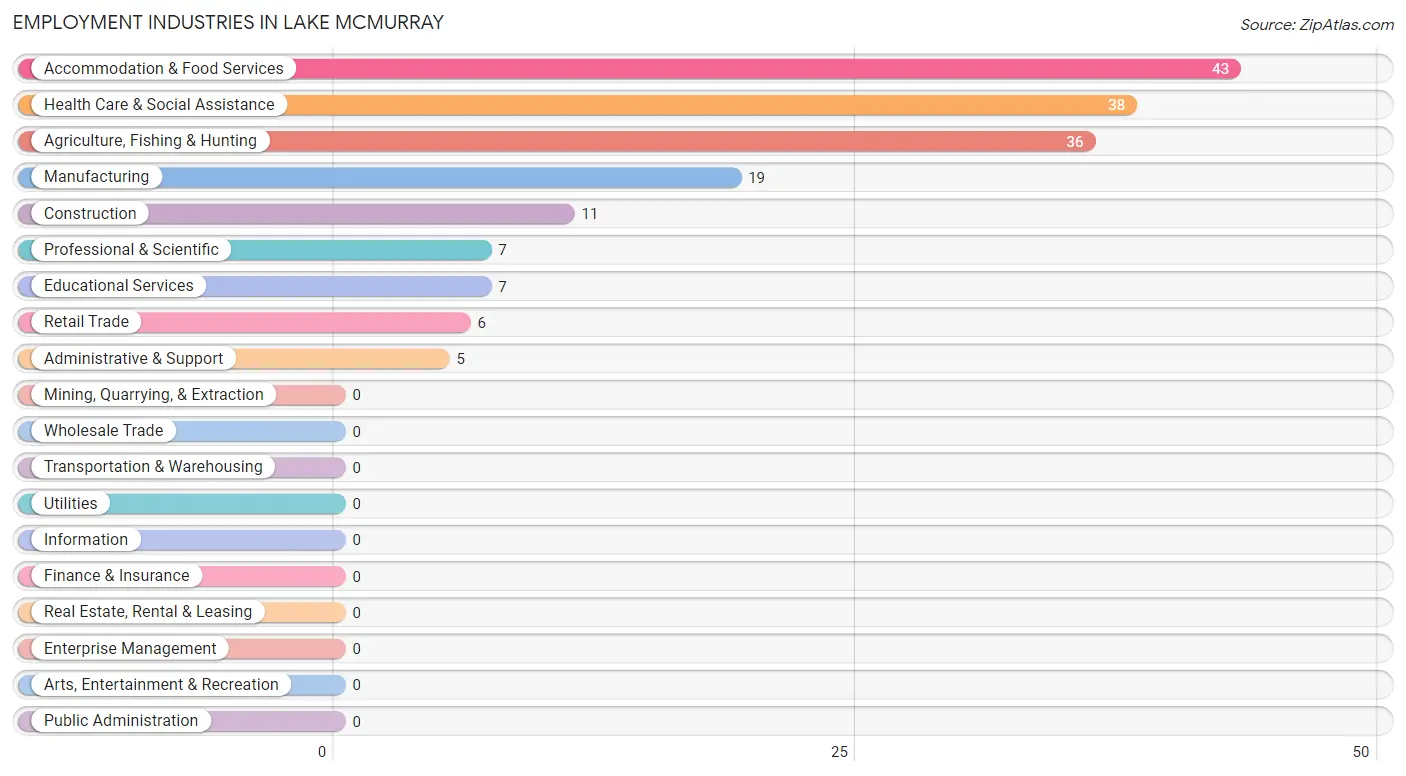
Employment Industries in Lake McMurray
The major employment industries in Lake McMurray include Accommodation & Food Services (43 | 24.4%), Health Care & Social Assistance (38 | 21.6%), Agriculture, Fishing & Hunting (36 | 20.4%), Manufacturing (19 | 10.8%), and Construction (11 | 6.2%).
Employment Industries by Sex in Lake McMurray
The Lake McMurray industries that see more men than women are Agriculture, Fishing & Hunting (100.0%), Construction (100.0%), and Professional & Scientific (100.0%), whereas the industries that tend to have a higher number of women are Retail Trade (100.0%), Administrative & Support (100.0%), and Educational Services (100.0%).
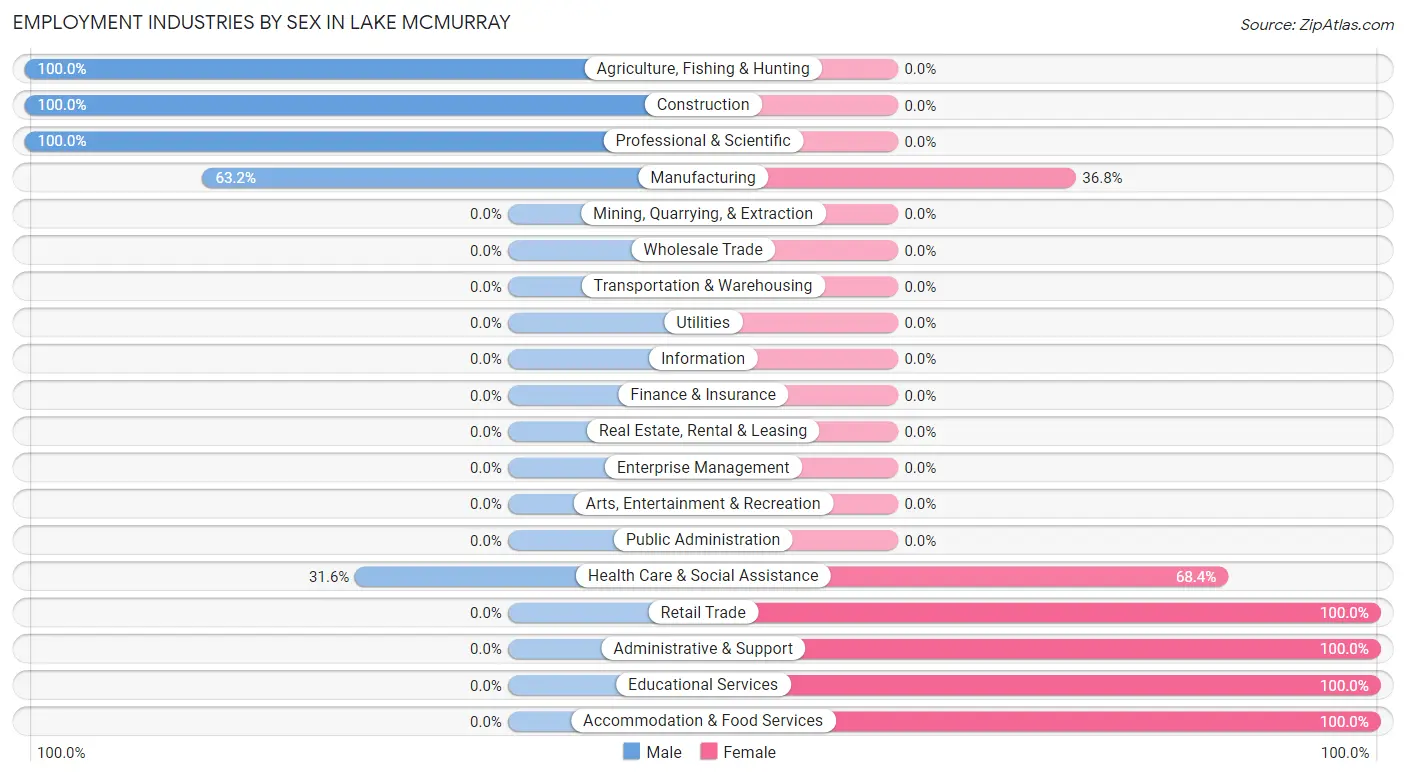
| Industry | Male | Female |
| Agriculture, Fishing & Hunting | 36 (100.0%) | 0 (0.0%) |
| Mining, Quarrying, & Extraction | 0 (0.0%) | 0 (0.0%) |
| Construction | 11 (100.0%) | 0 (0.0%) |
| Manufacturing | 12 (63.2%) | 7 (36.8%) |
| Wholesale Trade | 0 (0.0%) | 0 (0.0%) |
| Retail Trade | 0 (0.0%) | 6 (100.0%) |
| Transportation & Warehousing | 0 (0.0%) | 0 (0.0%) |
| Utilities | 0 (0.0%) | 0 (0.0%) |
| Information | 0 (0.0%) | 0 (0.0%) |
| Finance & Insurance | 0 (0.0%) | 0 (0.0%) |
| Real Estate, Rental & Leasing | 0 (0.0%) | 0 (0.0%) |
| Professional & Scientific | 7 (100.0%) | 0 (0.0%) |
| Enterprise Management | 0 (0.0%) | 0 (0.0%) |
| Administrative & Support | 0 (0.0%) | 5 (100.0%) |
| Educational Services | 0 (0.0%) | 7 (100.0%) |
| Health Care & Social Assistance | 12 (31.6%) | 26 (68.4%) |
| Arts, Entertainment & Recreation | 0 (0.0%) | 0 (0.0%) |
| Accommodation & Food Services | 0 (0.0%) | 43 (100.0%) |
| Public Administration | 0 (0.0%) | 0 (0.0%) |
| Total | 82 (46.6%) | 94 (53.4%) |
Education in Lake McMurray
School Enrollment in Lake McMurray
The most common levels of schooling among the 143 students in Lake McMurray are middle school (49 | 34.3%), high school (35 | 24.5%), and nursery / preschool (32 | 22.4%).
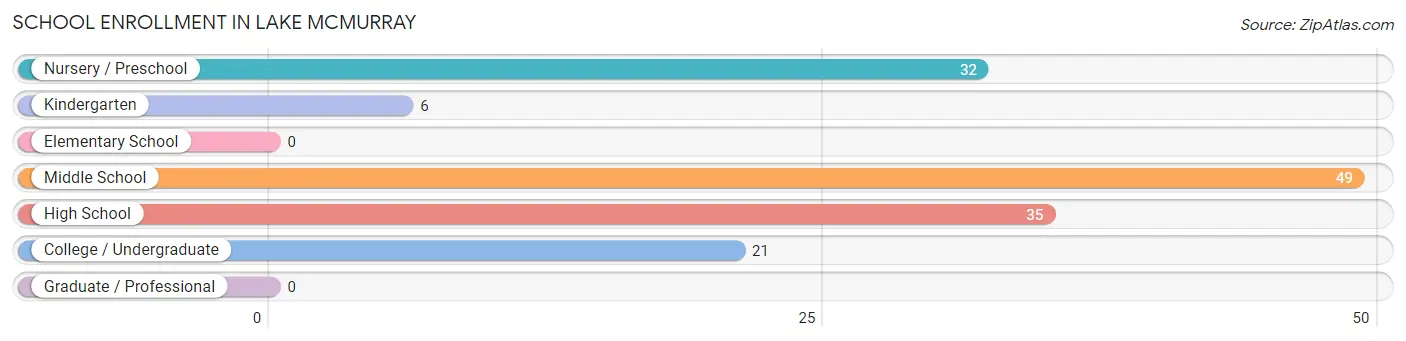
| School Level | # Students | % Students |
| Nursery / Preschool | 32 | 22.4% |
| Kindergarten | 6 | 4.2% |
| Elementary School | 0 | 0.0% |
| Middle School | 49 | 34.3% |
| High School | 35 | 24.5% |
| College / Undergraduate | 21 | 14.7% |
| Graduate / Professional | 0 | 0.0% |
| Total | 143 | 100.0% |
School Enrollment by Age by Funding Source in Lake McMurray
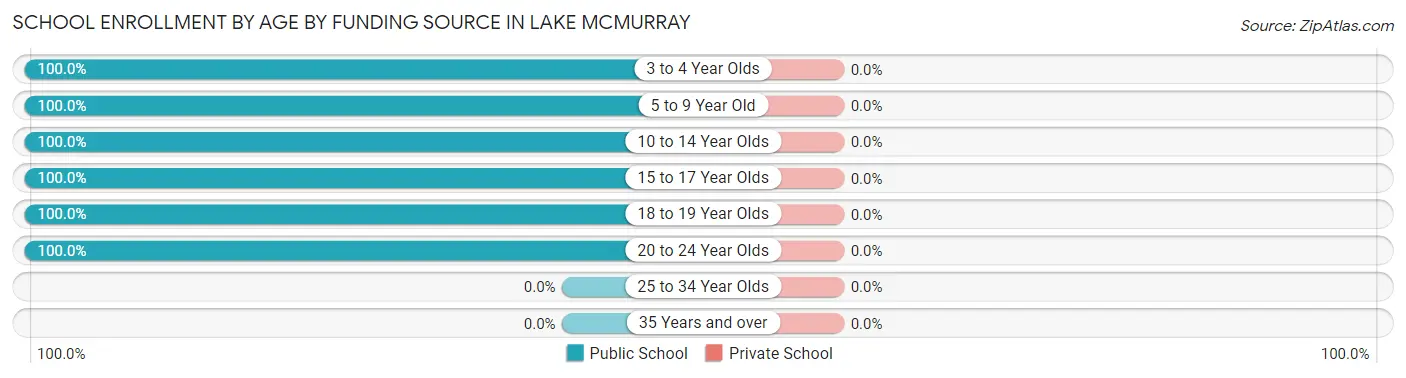
| Age Bracket | Public School | Private School |
| 3 to 4 Year Olds | 32 (100.0%) | 0 (0.0%) |
| 5 to 9 Year Old | 6 (100.0%) | 0 (0.0%) |
| 10 to 14 Year Olds | 49 (100.0%) | 0 (0.0%) |
| 15 to 17 Year Olds | 19 (100.0%) | 0 (0.0%) |
| 18 to 19 Year Olds | 16 (100.0%) | 0 (0.0%) |
| 20 to 24 Year Olds | 21 (100.0%) | 0 (0.0%) |
| 25 to 34 Year Olds | 0 (0.0%) | 0 (0.0%) |
| 35 Years and over | 0 (0.0%) | 0 (0.0%) |
| Total | 143 (100.0%) | 0 (0.0%) |
Educational Attainment by Field of Study in Lake McMurray
Education (13 | 20.6%), liberal arts & history (11 | 17.5%), bio, nature & agricultural (7 | 11.1%), psychology (7 | 11.1%), and social sciences (7 | 11.1%) are the most common fields of study among 63 individuals in Lake McMurray who have obtained a bachelor's degree or higher.
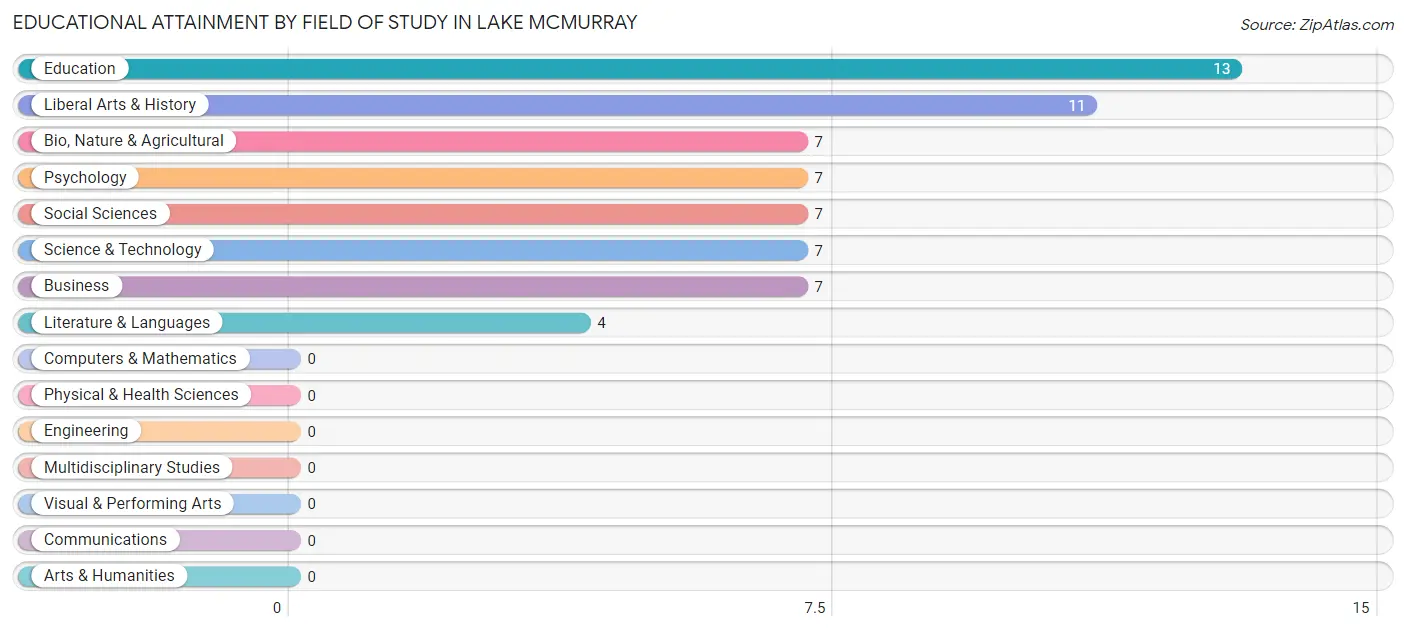
| Field of Study | # Graduates | % Graduates |
| Computers & Mathematics | 0 | 0.0% |
| Bio, Nature & Agricultural | 7 | 11.1% |
| Physical & Health Sciences | 0 | 0.0% |
| Psychology | 7 | 11.1% |
| Social Sciences | 7 | 11.1% |
| Engineering | 0 | 0.0% |
| Multidisciplinary Studies | 0 | 0.0% |
| Science & Technology | 7 | 11.1% |
| Business | 7 | 11.1% |
| Education | 13 | 20.6% |
| Literature & Languages | 4 | 6.4% |
| Liberal Arts & History | 11 | 17.5% |
| Visual & Performing Arts | 0 | 0.0% |
| Communications | 0 | 0.0% |
| Arts & Humanities | 0 | 0.0% |
| Total | 63 | 100.0% |
Transportation & Commute in Lake McMurray
Vehicle Availability by Sex in Lake McMurray
The most prevalent vehicle ownership categories in Lake McMurray are males with 2 vehicles (36, accounting for 43.9%) and females with 2 vehicles (11, making up 38.3%).
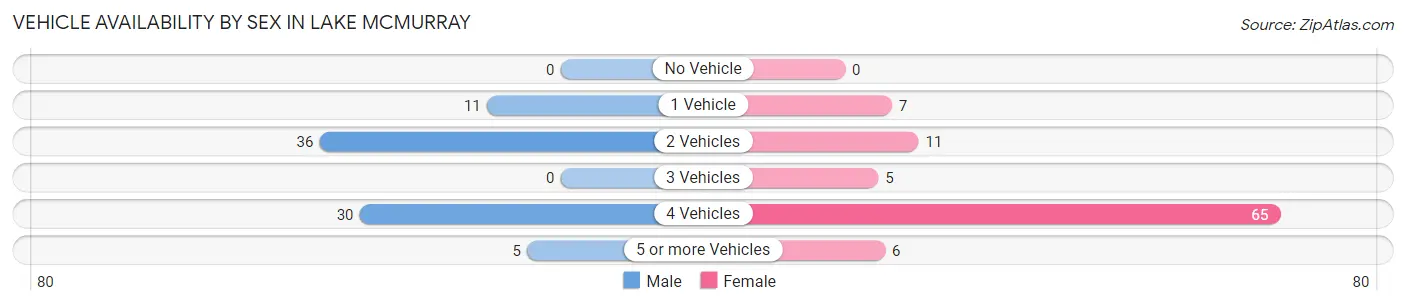
| Vehicles Available | Male | Female |
| No Vehicle | 0 (0.0%) | 0 (0.0%) |
| 1 Vehicle | 11 (13.4%) | 7 (7.4%) |
| 2 Vehicles | 36 (43.9%) | 11 (11.7%) |
| 3 Vehicles | 0 (0.0%) | 5 (5.3%) |
| 4 Vehicles | 30 (36.6%) | 65 (69.2%) |
| 5 or more Vehicles | 5 (6.1%) | 6 (6.4%) |
| Total | 82 (100.0%) | 94 (100.0%) |
Commute Time in Lake McMurray
The most frequently occuring commute durations in Lake McMurray are 20 to 24 minutes (54 commuters, 31.6%), 35 to 39 minutes (43 commuters, 25.2%), and 25 to 29 minutes (32 commuters, 18.7%).
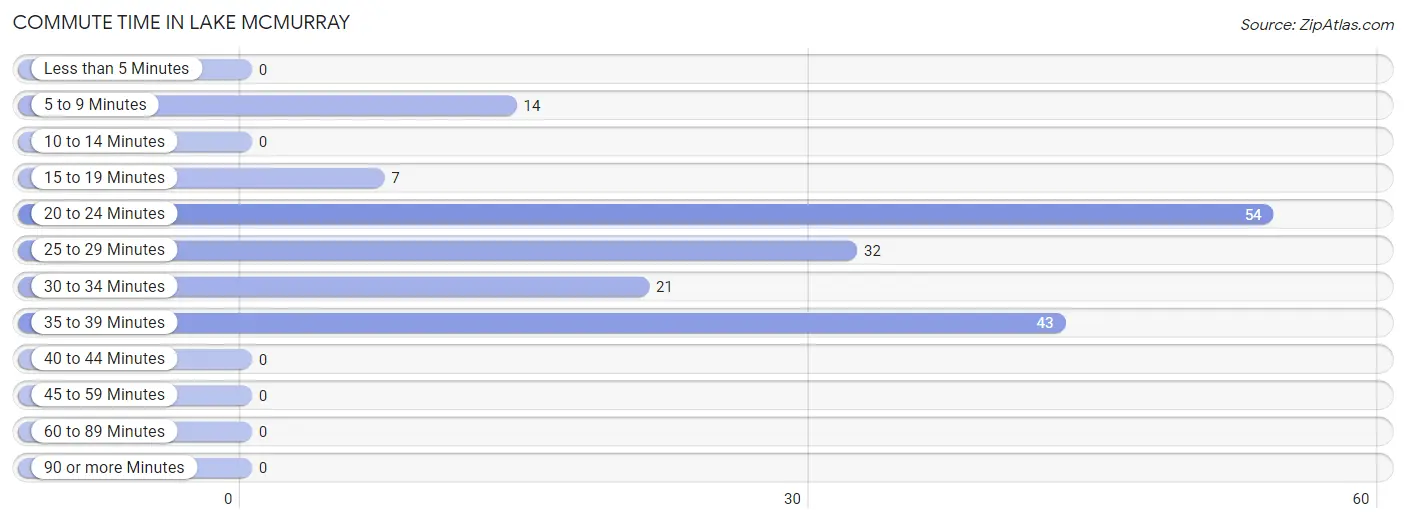
| Commute Time | # Commuters | % Commuters |
| Less than 5 Minutes | 0 | 0.0% |
| 5 to 9 Minutes | 14 | 8.2% |
| 10 to 14 Minutes | 0 | 0.0% |
| 15 to 19 Minutes | 7 | 4.1% |
| 20 to 24 Minutes | 54 | 31.6% |
| 25 to 29 Minutes | 32 | 18.7% |
| 30 to 34 Minutes | 21 | 12.3% |
| 35 to 39 Minutes | 43 | 25.2% |
| 40 to 44 Minutes | 0 | 0.0% |
| 45 to 59 Minutes | 0 | 0.0% |
| 60 to 89 Minutes | 0 | 0.0% |
| 90 or more Minutes | 0 | 0.0% |
Commute Time by Sex in Lake McMurray
The most common commute times in Lake McMurray are 35 to 39 minutes (36 commuters, 43.9%) for males and 20 to 24 minutes (33 commuters, 37.1%) for females.
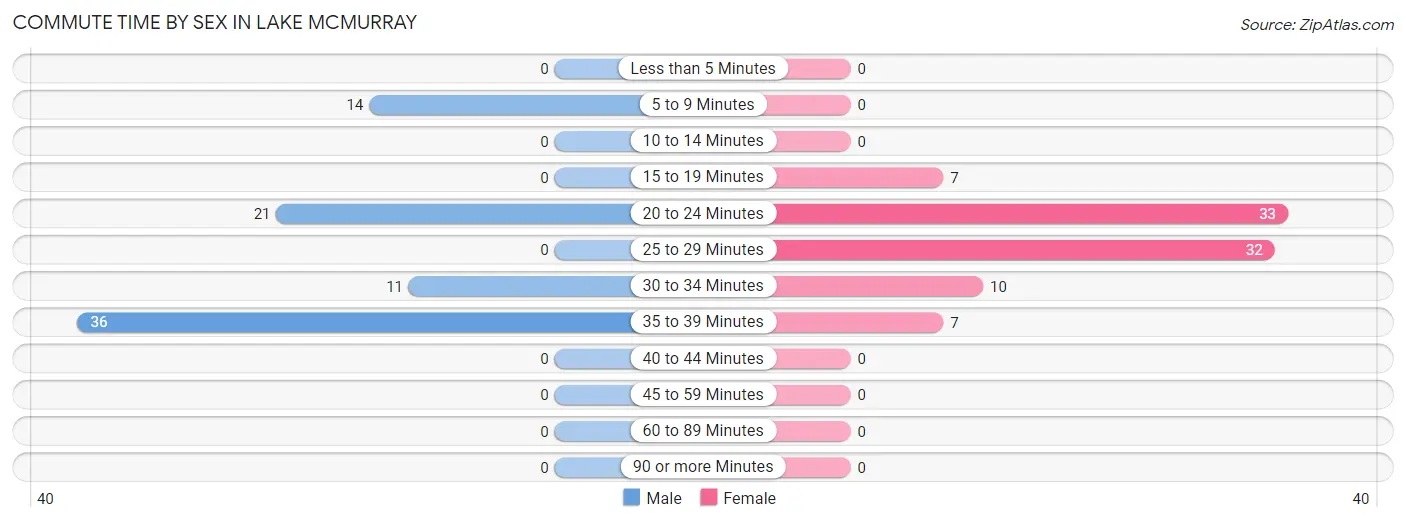
| Commute Time | Male | Female |
| Less than 5 Minutes | 0 (0.0%) | 0 (0.0%) |
| 5 to 9 Minutes | 14 (17.1%) | 0 (0.0%) |
| 10 to 14 Minutes | 0 (0.0%) | 0 (0.0%) |
| 15 to 19 Minutes | 0 (0.0%) | 7 (7.9%) |
| 20 to 24 Minutes | 21 (25.6%) | 33 (37.1%) |
| 25 to 29 Minutes | 0 (0.0%) | 32 (36.0%) |
| 30 to 34 Minutes | 11 (13.4%) | 10 (11.2%) |
| 35 to 39 Minutes | 36 (43.9%) | 7 (7.9%) |
| 40 to 44 Minutes | 0 (0.0%) | 0 (0.0%) |
| 45 to 59 Minutes | 0 (0.0%) | 0 (0.0%) |
| 60 to 89 Minutes | 0 (0.0%) | 0 (0.0%) |
| 90 or more Minutes | 0 (0.0%) | 0 (0.0%) |
Time of Departure to Work by Sex in Lake McMurray
The most frequent times of departure to work in Lake McMurray are 7:30 AM to 7:59 AM (40, 48.8%) for males and 7:30 AM to 7:59 AM (49, 55.1%) for females.
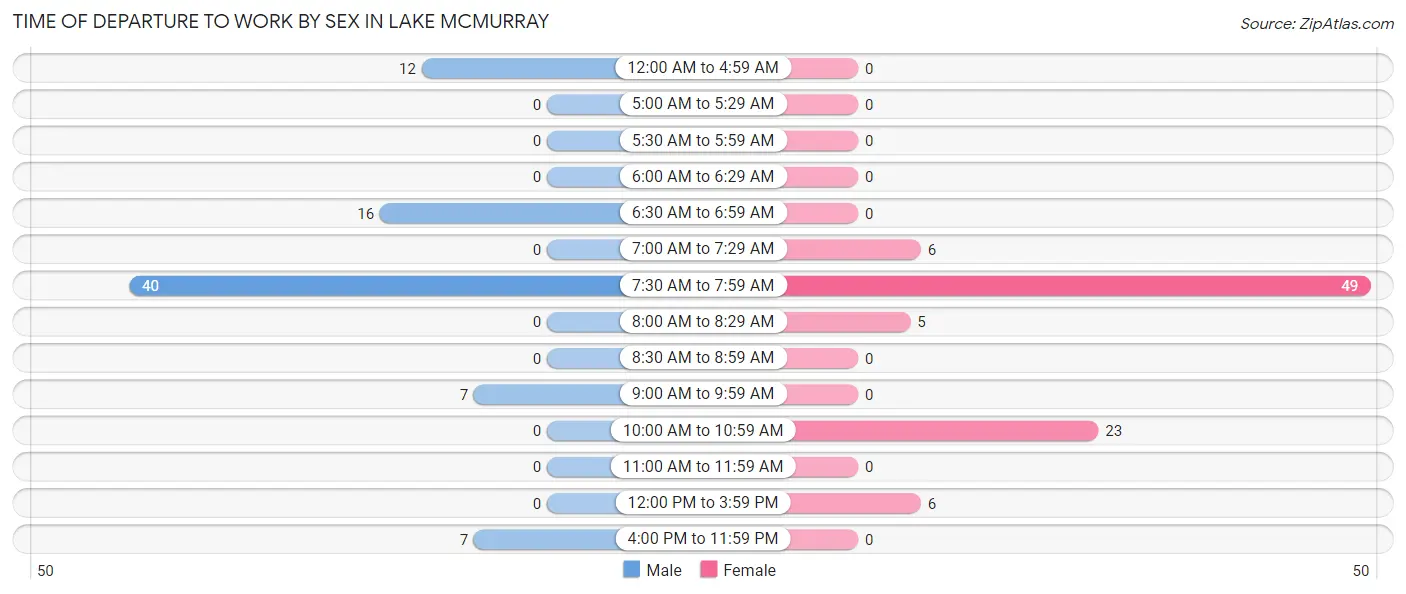
| Time of Departure | Male | Female |
| 12:00 AM to 4:59 AM | 12 (14.6%) | 0 (0.0%) |
| 5:00 AM to 5:29 AM | 0 (0.0%) | 0 (0.0%) |
| 5:30 AM to 5:59 AM | 0 (0.0%) | 0 (0.0%) |
| 6:00 AM to 6:29 AM | 0 (0.0%) | 0 (0.0%) |
| 6:30 AM to 6:59 AM | 16 (19.5%) | 0 (0.0%) |
| 7:00 AM to 7:29 AM | 0 (0.0%) | 6 (6.7%) |
| 7:30 AM to 7:59 AM | 40 (48.8%) | 49 (55.1%) |
| 8:00 AM to 8:29 AM | 0 (0.0%) | 5 (5.6%) |
| 8:30 AM to 8:59 AM | 0 (0.0%) | 0 (0.0%) |
| 9:00 AM to 9:59 AM | 7 (8.5%) | 0 (0.0%) |
| 10:00 AM to 10:59 AM | 0 (0.0%) | 23 (25.8%) |
| 11:00 AM to 11:59 AM | 0 (0.0%) | 0 (0.0%) |
| 12:00 PM to 3:59 PM | 0 (0.0%) | 6 (6.7%) |
| 4:00 PM to 11:59 PM | 7 (8.5%) | 0 (0.0%) |
| Total | 82 (100.0%) | 89 (100.0%) |
Housing Occupancy in Lake McMurray
Occupancy by Ownership in Lake McMurray
Of the total 170 dwellings in Lake McMurray, owner-occupied units account for 170 (100.0%), while renter-occupied units make up 0 (0.0%).
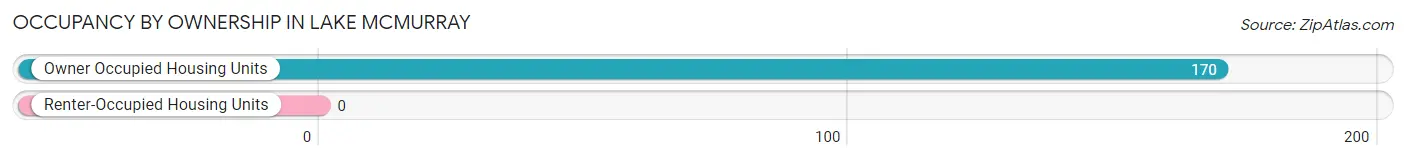
| Occupancy | # Housing Units | % Housing Units |
| Owner Occupied Housing Units | 170 | 100.0% |
| Renter-Occupied Housing Units | 0 | 0.0% |
| Total Occupied Housing Units | 170 | 100.0% |
Occupancy by Household Size in Lake McMurray
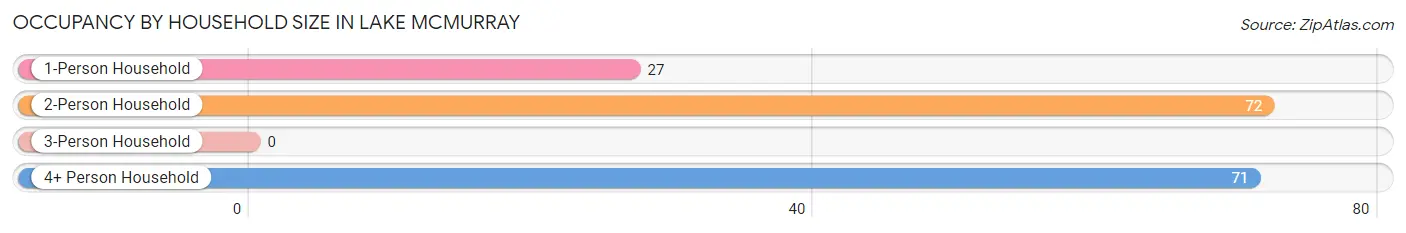
| Household Size | # Housing Units | % Housing Units |
| 1-Person Household | 27 | 15.9% |
| 2-Person Household | 72 | 42.3% |
| 3-Person Household | 0 | 0.0% |
| 4+ Person Household | 71 | 41.8% |
| Total Housing Units | 170 | 100.0% |
Occupancy by Ownership by Household Size in Lake McMurray
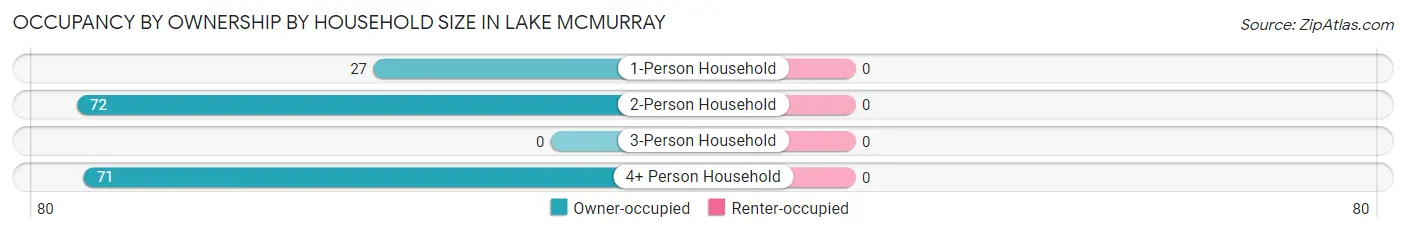
| Household Size | Owner-occupied | Renter-occupied |
| 1-Person Household | 27 (100.0%) | 0 (0.0%) |
| 2-Person Household | 72 (100.0%) | 0 (0.0%) |
| 3-Person Household | 0 (0.0%) | 0 (0.0%) |
| 4+ Person Household | 71 (100.0%) | 0 (0.0%) |
| Total Housing Units | 170 (100.0%) | 0 (0.0%) |
Occupancy by Educational Attainment in Lake McMurray
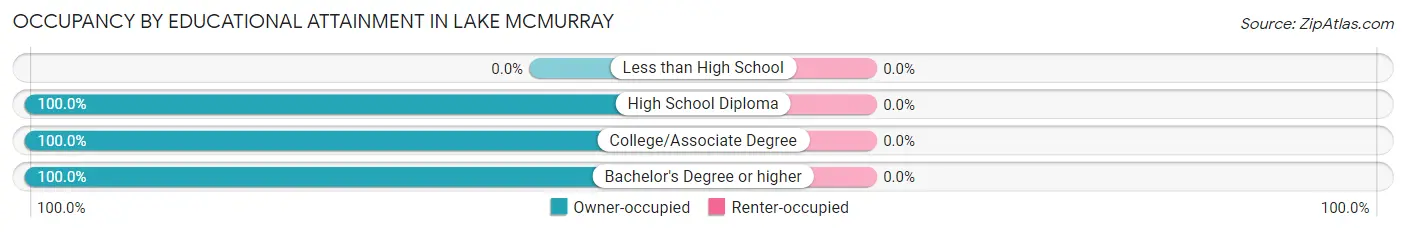
| Household Size | Owner-occupied | Renter-occupied |
| Less than High School | 0 (0.0%) | 0 (0.0%) |
| High School Diploma | 47 (100.0%) | 0 (0.0%) |
| College/Associate Degree | 92 (100.0%) | 0 (0.0%) |
| Bachelor's Degree or higher | 31 (100.0%) | 0 (0.0%) |
Occupancy by Age of Householder in Lake McMurray
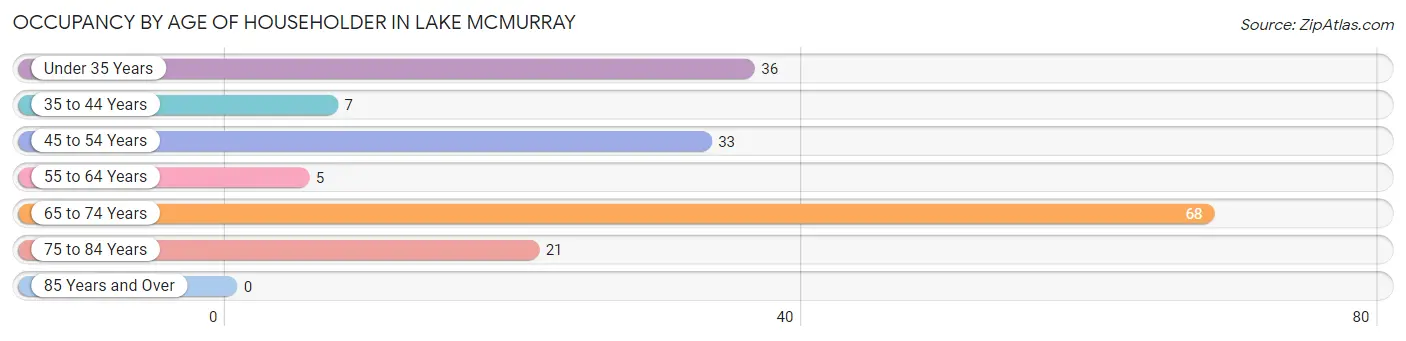
| Age Bracket | # Households | % Households |
| Under 35 Years | 36 | 21.2% |
| 35 to 44 Years | 7 | 4.1% |
| 45 to 54 Years | 33 | 19.4% |
| 55 to 64 Years | 5 | 2.9% |
| 65 to 74 Years | 68 | 40.0% |
| 75 to 84 Years | 21 | 12.3% |
| 85 Years and Over | 0 | 0.0% |
| Total | 170 | 100.0% |
Housing Finances in Lake McMurray
Median Income by Occupancy in Lake McMurray
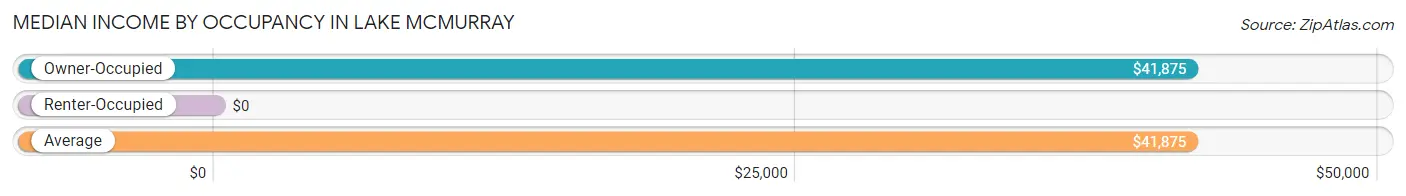
| Occupancy Type | # Households | Median Income |
| Owner-Occupied | 170 (100.0%) | $41,875 |
| Renter-Occupied | 0 (0.0%) | $0 |
| Average | 170 (100.0%) | $41,875 |
Occupancy by Householder Income Bracket in Lake McMurray
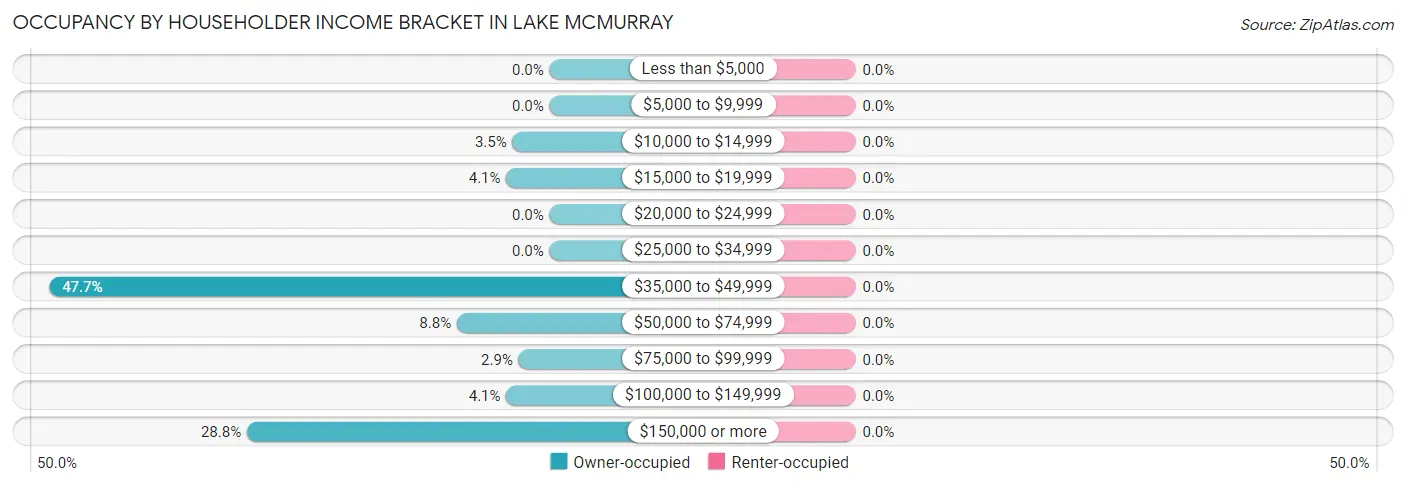
| Income Bracket | Owner-occupied | Renter-occupied |
| Less than $5,000 | 0 (0.0%) | 0 (0.0%) |
| $5,000 to $9,999 | 0 (0.0%) | 0 (0.0%) |
| $10,000 to $14,999 | 6 (3.5%) | 0 (0.0%) |
| $15,000 to $19,999 | 7 (4.1%) | 0 (0.0%) |
| $20,000 to $24,999 | 0 (0.0%) | 0 (0.0%) |
| $25,000 to $34,999 | 0 (0.0%) | 0 (0.0%) |
| $35,000 to $49,999 | 81 (47.6%) | 0 (0.0%) |
| $50,000 to $74,999 | 15 (8.8%) | 0 (0.0%) |
| $75,000 to $99,999 | 5 (2.9%) | 0 (0.0%) |
| $100,000 to $149,999 | 7 (4.1%) | 0 (0.0%) |
| $150,000 or more | 49 (28.8%) | 0 (0.0%) |
| Total | 170 (100.0%) | 0 (0.0%) |
Monthly Housing Cost Tiers in Lake McMurray
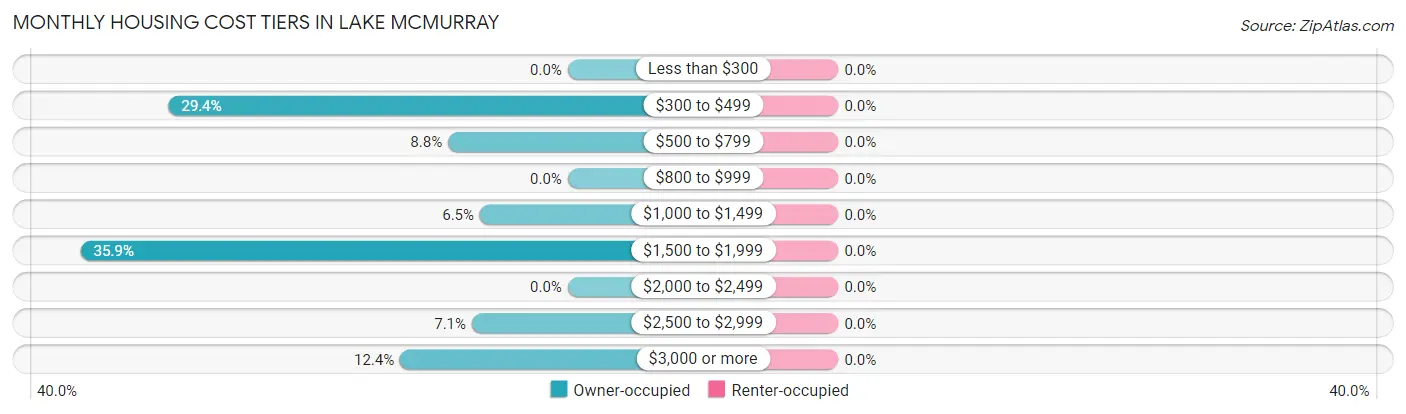
| Monthly Cost | Owner-occupied | Renter-occupied |
| Less than $300 | 0 (0.0%) | 0 (0.0%) |
| $300 to $499 | 50 (29.4%) | 0 (0.0%) |
| $500 to $799 | 15 (8.8%) | 0 (0.0%) |
| $800 to $999 | 0 (0.0%) | 0 (0.0%) |
| $1,000 to $1,499 | 11 (6.5%) | 0 (0.0%) |
| $1,500 to $1,999 | 61 (35.9%) | 0 (0.0%) |
| $2,000 to $2,499 | 0 (0.0%) | 0 (0.0%) |
| $2,500 to $2,999 | 12 (7.1%) | 0 (0.0%) |
| $3,000 or more | 21 (12.3%) | 0 (0.0%) |
| Total | 170 (100.0%) | 0 (0.0%) |
Physical Housing Characteristics in Lake McMurray
Housing Structures in Lake McMurray
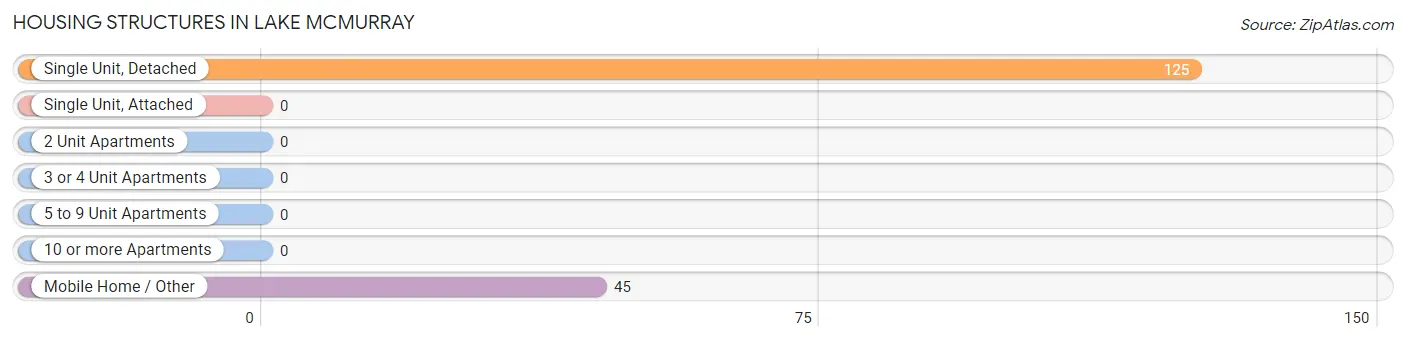
| Structure Type | # Housing Units | % Housing Units |
| Single Unit, Detached | 125 | 73.5% |
| Single Unit, Attached | 0 | 0.0% |
| 2 Unit Apartments | 0 | 0.0% |
| 3 or 4 Unit Apartments | 0 | 0.0% |
| 5 to 9 Unit Apartments | 0 | 0.0% |
| 10 or more Apartments | 0 | 0.0% |
| Mobile Home / Other | 45 | 26.5% |
| Total | 170 | 100.0% |
Housing Structures by Occupancy in Lake McMurray
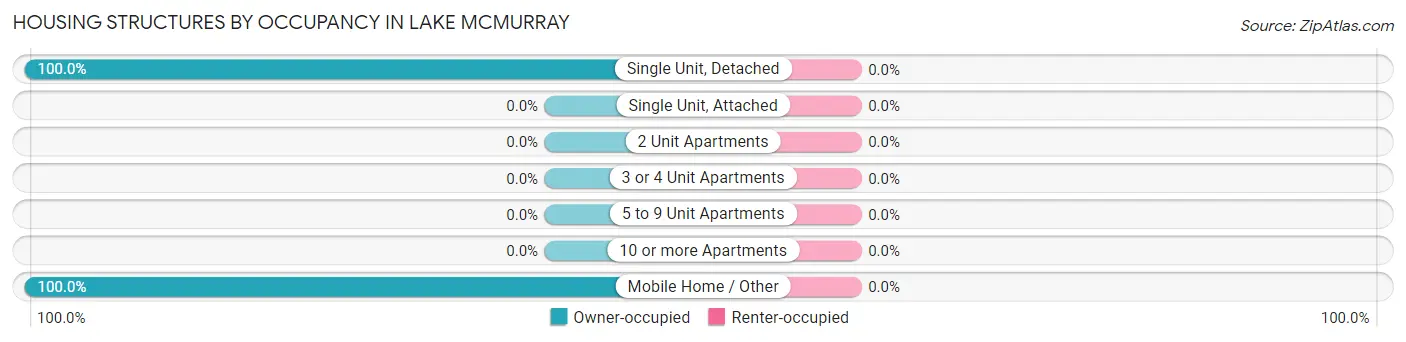
| Structure Type | Owner-occupied | Renter-occupied |
| Single Unit, Detached | 125 (100.0%) | 0 (0.0%) |
| Single Unit, Attached | 0 (0.0%) | 0 (0.0%) |
| 2 Unit Apartments | 0 (0.0%) | 0 (0.0%) |
| 3 or 4 Unit Apartments | 0 (0.0%) | 0 (0.0%) |
| 5 to 9 Unit Apartments | 0 (0.0%) | 0 (0.0%) |
| 10 or more Apartments | 0 (0.0%) | 0 (0.0%) |
| Mobile Home / Other | 45 (100.0%) | 0 (0.0%) |
| Total | 170 (100.0%) | 0 (0.0%) |
Housing Structures by Number of Rooms in Lake McMurray
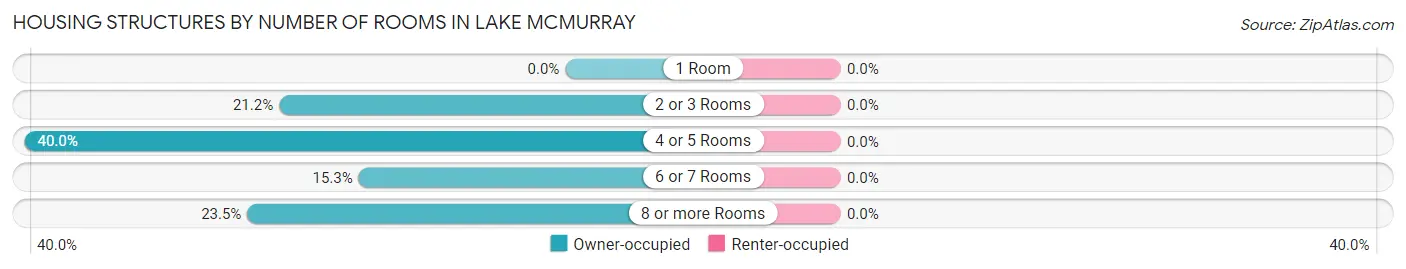
| Number of Rooms | Owner-occupied | Renter-occupied |
| 1 Room | 0 (0.0%) | 0 (0.0%) |
| 2 or 3 Rooms | 36 (21.2%) | 0 (0.0%) |
| 4 or 5 Rooms | 68 (40.0%) | 0 (0.0%) |
| 6 or 7 Rooms | 26 (15.3%) | 0 (0.0%) |
| 8 or more Rooms | 40 (23.5%) | 0 (0.0%) |
| Total | 170 (100.0%) | 0 (0.0%) |
Housing Structure by Heating Type in Lake McMurray
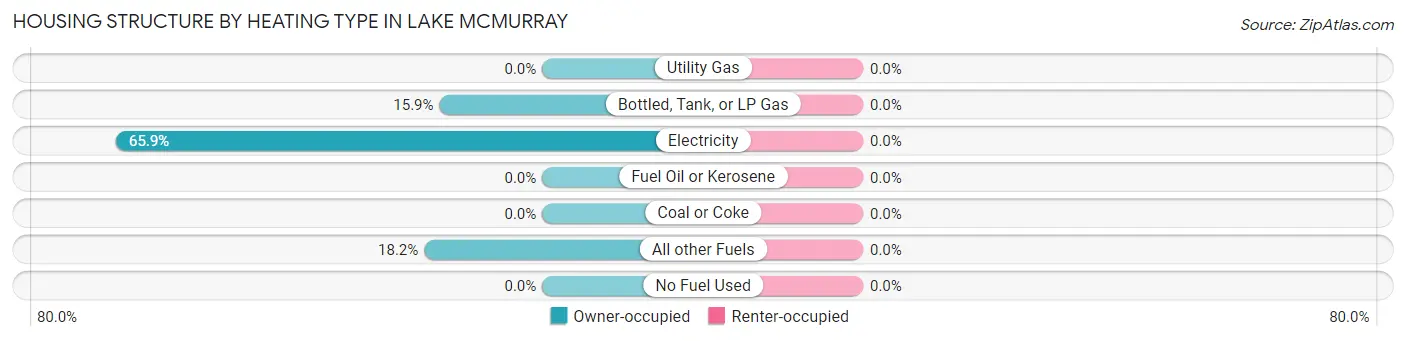
| Heating Type | Owner-occupied | Renter-occupied |
| Utility Gas | 0 (0.0%) | 0 (0.0%) |
| Bottled, Tank, or LP Gas | 27 (15.9%) | 0 (0.0%) |
| Electricity | 112 (65.9%) | 0 (0.0%) |
| Fuel Oil or Kerosene | 0 (0.0%) | 0 (0.0%) |
| Coal or Coke | 0 (0.0%) | 0 (0.0%) |
| All other Fuels | 31 (18.2%) | 0 (0.0%) |
| No Fuel Used | 0 (0.0%) | 0 (0.0%) |
| Total | 170 (100.0%) | 0 (0.0%) |
Household Vehicle Usage in Lake McMurray
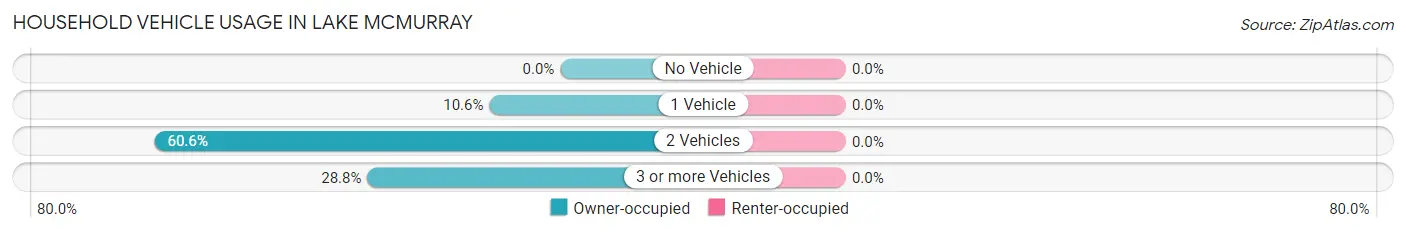
| Vehicles per Household | Owner-occupied | Renter-occupied |
| No Vehicle | 0 (0.0%) | 0 (0.0%) |
| 1 Vehicle | 18 (10.6%) | 0 (0.0%) |
| 2 Vehicles | 103 (60.6%) | 0 (0.0%) |
| 3 or more Vehicles | 49 (28.8%) | 0 (0.0%) |
| Total | 170 (100.0%) | 0 (0.0%) |
Real Estate & Mortgages in Lake McMurray
Real Estate and Mortgage Overview in Lake McMurray
| Characteristic | Without Mortgage | With Mortgage |
| Housing Units | 65 | 105 |
| Median Property Value | $216,100 | $0 |
| Median Household Income | $38,854 | $49 |
| Monthly Housing Costs | $380 | $21 |
| Real Estate Taxes | - | - |
Property Value by Mortgage Status in Lake McMurray
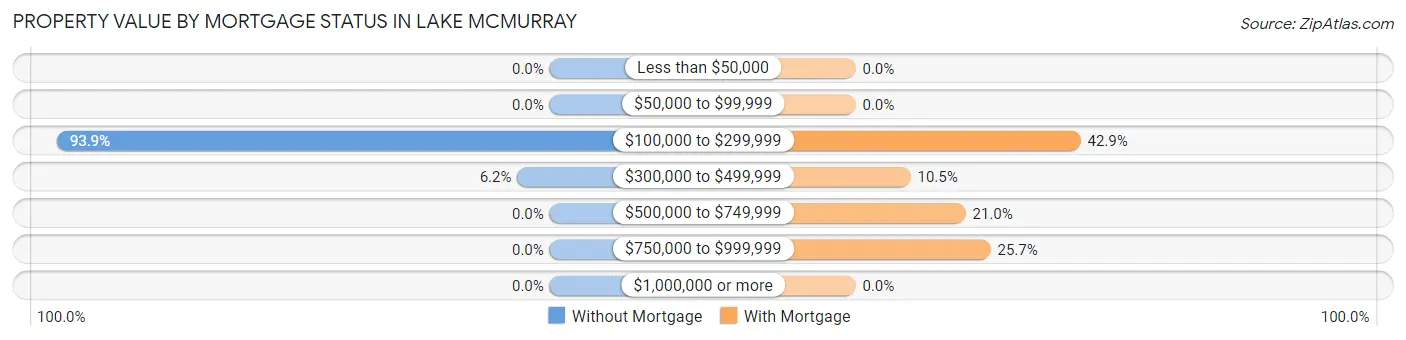
| Property Value | Without Mortgage | With Mortgage |
| Less than $50,000 | 0 (0.0%) | 0 (0.0%) |
| $50,000 to $99,999 | 0 (0.0%) | 0 (0.0%) |
| $100,000 to $299,999 | 61 (93.9%) | 45 (42.9%) |
| $300,000 to $499,999 | 4 (6.1%) | 11 (10.5%) |
| $500,000 to $749,999 | 0 (0.0%) | 22 (20.9%) |
| $750,000 to $999,999 | 0 (0.0%) | 27 (25.7%) |
| $1,000,000 or more | 0 (0.0%) | 0 (0.0%) |
| Total | 65 (100.0%) | 105 (100.0%) |
Household Income by Mortgage Status in Lake McMurray
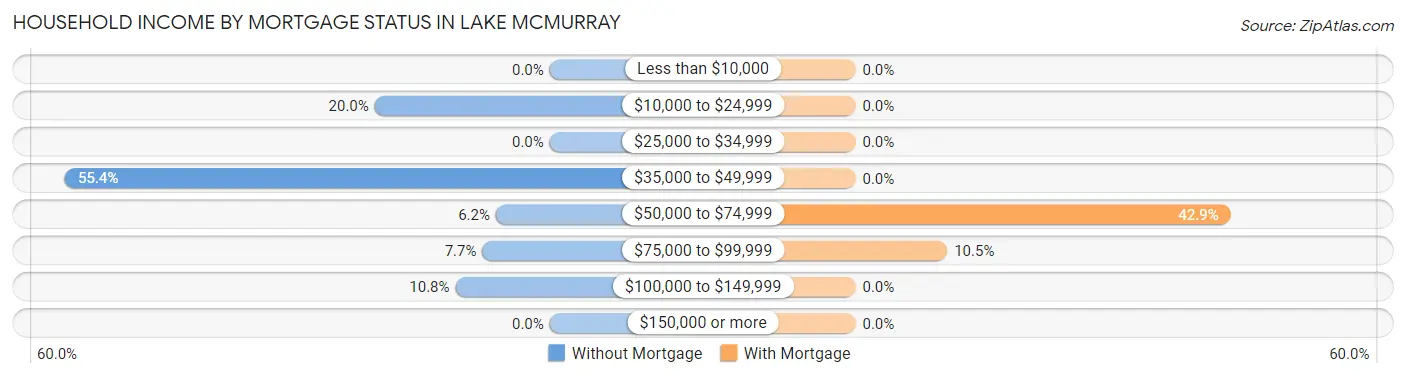
| Household Income | Without Mortgage | With Mortgage |
| Less than $10,000 | 0 (0.0%) | 0 (0.0%) |
| $10,000 to $24,999 | 13 (20.0%) | 0 (0.0%) |
| $25,000 to $34,999 | 0 (0.0%) | 0 (0.0%) |
| $35,000 to $49,999 | 36 (55.4%) | 0 (0.0%) |
| $50,000 to $74,999 | 4 (6.1%) | 45 (42.9%) |
| $75,000 to $99,999 | 5 (7.7%) | 11 (10.5%) |
| $100,000 to $149,999 | 7 (10.8%) | 0 (0.0%) |
| $150,000 or more | 0 (0.0%) | 0 (0.0%) |
| Total | 65 (100.0%) | 105 (100.0%) |
Property Value to Household Income Ratio in Lake McMurray
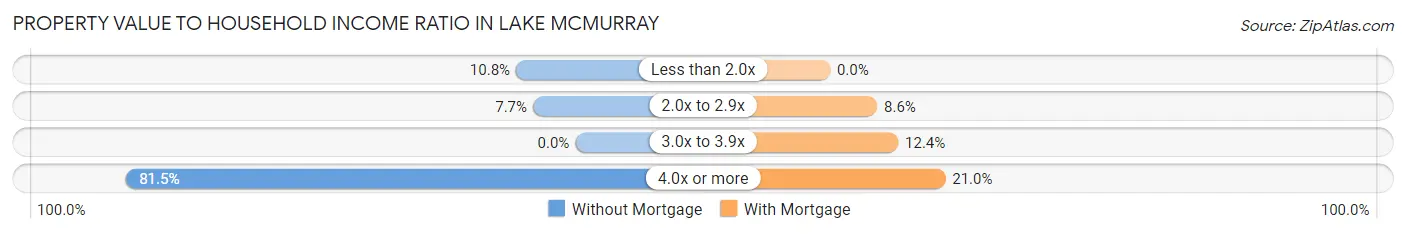
| Value-to-Income Ratio | Without Mortgage | With Mortgage |
| Less than 2.0x | 7 (10.8%) | 0 (0.0%) |
| 2.0x to 2.9x | 5 (7.7%) | 9 (8.6%) |
| 3.0x to 3.9x | 0 (0.0%) | 13 (12.4%) |
| 4.0x or more | 53 (81.5%) | 22 (20.9%) |
| Total | 65 (100.0%) | 105 (100.0%) |
Real Estate Taxes by Mortgage Status in Lake McMurray
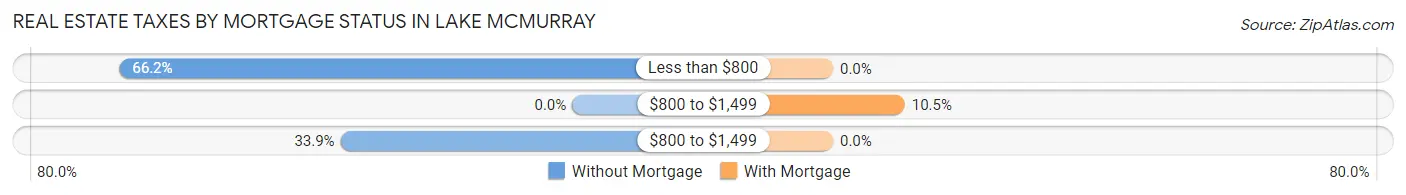
| Property Taxes | Without Mortgage | With Mortgage |
| Less than $800 | 43 (66.1%) | 0 (0.0%) |
| $800 to $1,499 | 0 (0.0%) | 11 (10.5%) |
| $800 to $1,499 | 22 (33.9%) | 0 (0.0%) |
| Total | 65 (100.0%) | 105 (100.0%) |
Health & Disability in Lake McMurray
Health Insurance Coverage by Age in Lake McMurray
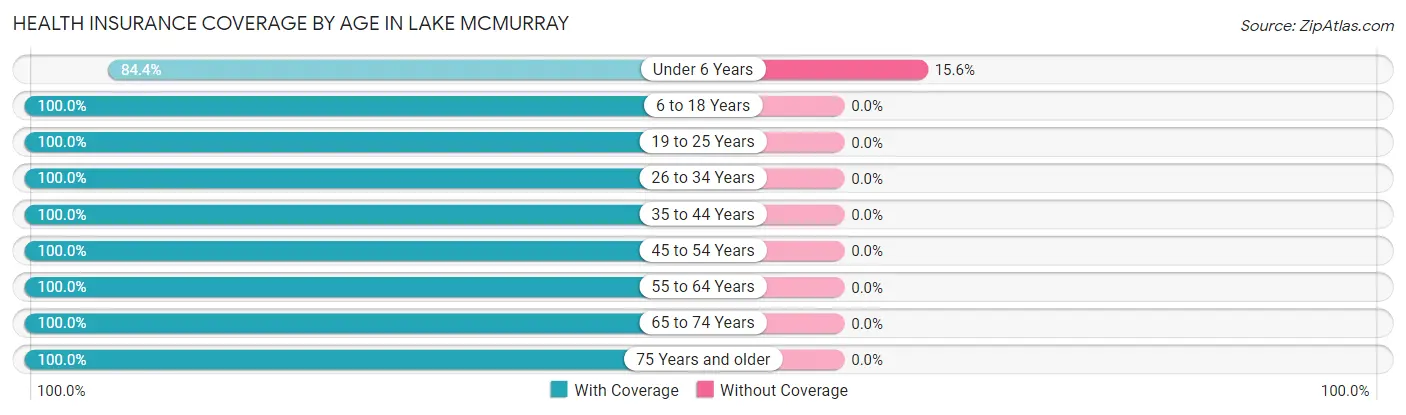
| Age Bracket | With Coverage | Without Coverage |
| Under 6 Years | 38 (84.4%) | 7 (15.6%) |
| 6 to 18 Years | 84 (100.0%) | 0 (0.0%) |
| 19 to 25 Years | 63 (100.0%) | 0 (0.0%) |
| 26 to 34 Years | 35 (100.0%) | 0 (0.0%) |
| 35 to 44 Years | 25 (100.0%) | 0 (0.0%) |
| 45 to 54 Years | 49 (100.0%) | 0 (0.0%) |
| 55 to 64 Years | 10 (100.0%) | 0 (0.0%) |
| 65 to 74 Years | 121 (100.0%) | 0 (0.0%) |
| 75 Years and older | 41 (100.0%) | 0 (0.0%) |
| Total | 466 (98.5%) | 7 (1.5%) |
Health Insurance Coverage by Citizenship Status in Lake McMurray
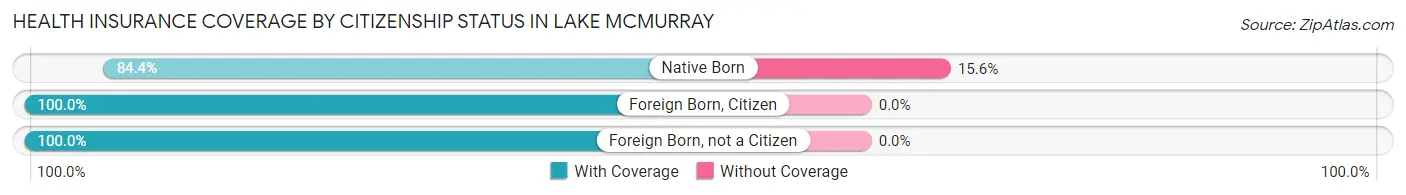
| Citizenship Status | With Coverage | Without Coverage |
| Native Born | 38 (84.4%) | 7 (15.6%) |
| Foreign Born, Citizen | 84 (100.0%) | 0 (0.0%) |
| Foreign Born, not a Citizen | 63 (100.0%) | 0 (0.0%) |
Health Insurance Coverage by Household Income in Lake McMurray
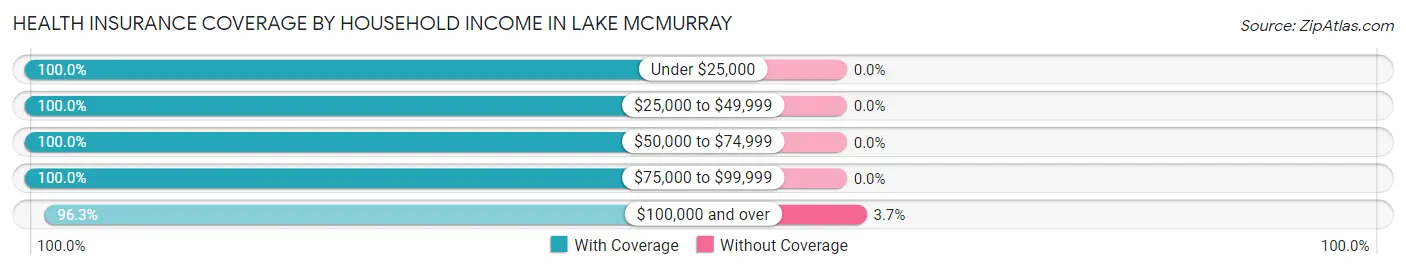
| Household Income | With Coverage | Without Coverage |
| Under $25,000 | 19 (100.0%) | 0 (0.0%) |
| $25,000 to $49,999 | 227 (100.0%) | 0 (0.0%) |
| $50,000 to $74,999 | 27 (100.0%) | 0 (0.0%) |
| $75,000 to $99,999 | 11 (100.0%) | 0 (0.0%) |
| $100,000 and over | 182 (96.3%) | 7 (3.7%) |
Public vs Private Health Insurance Coverage by Age in Lake McMurray
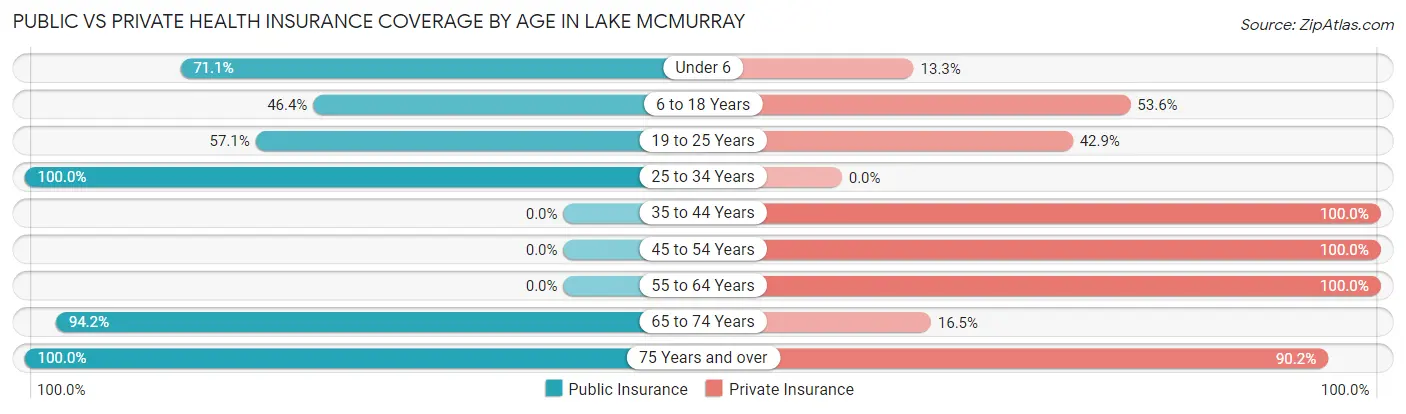
| Age Bracket | Public Insurance | Private Insurance |
| Under 6 | 32 (71.1%) | 6 (13.3%) |
| 6 to 18 Years | 39 (46.4%) | 45 (53.6%) |
| 19 to 25 Years | 36 (57.1%) | 27 (42.9%) |
| 25 to 34 Years | 35 (100.0%) | 0 (0.0%) |
| 35 to 44 Years | 0 (0.0%) | 25 (100.0%) |
| 45 to 54 Years | 0 (0.0%) | 49 (100.0%) |
| 55 to 64 Years | 0 (0.0%) | 10 (100.0%) |
| 65 to 74 Years | 114 (94.2%) | 20 (16.5%) |
| 75 Years and over | 41 (100.0%) | 37 (90.2%) |
| Total | 297 (62.8%) | 219 (46.3%) |
Disability Status by Sex by Age in Lake McMurray
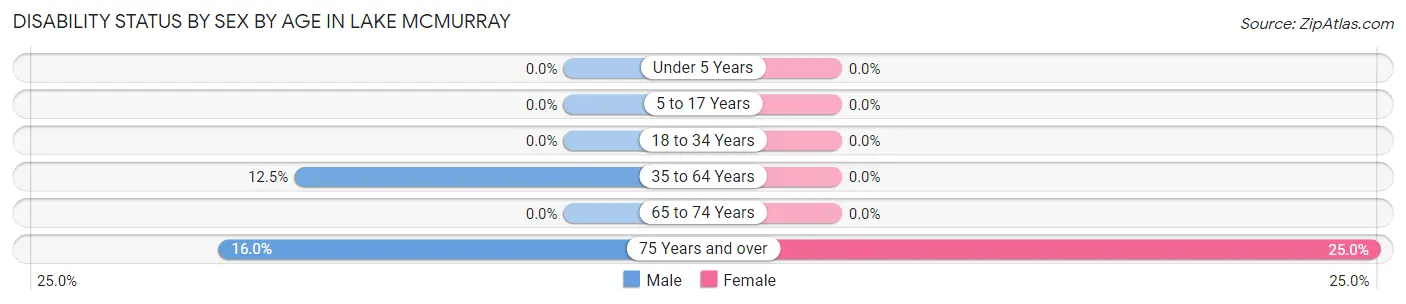
| Age Bracket | Male | Female |
| Under 5 Years | 0 (0.0%) | 0 (0.0%) |
| 5 to 17 Years | 0 (0.0%) | 0 (0.0%) |
| 18 to 34 Years | 0 (0.0%) | 0 (0.0%) |
| 35 to 64 Years | 5 (12.5%) | 0 (0.0%) |
| 65 to 74 Years | 0 (0.0%) | 0 (0.0%) |
| 75 Years and over | 4 (16.0%) | 4 (25.0%) |
Disability Class by Sex by Age in Lake McMurray
Disability Class: Hearing Difficulty
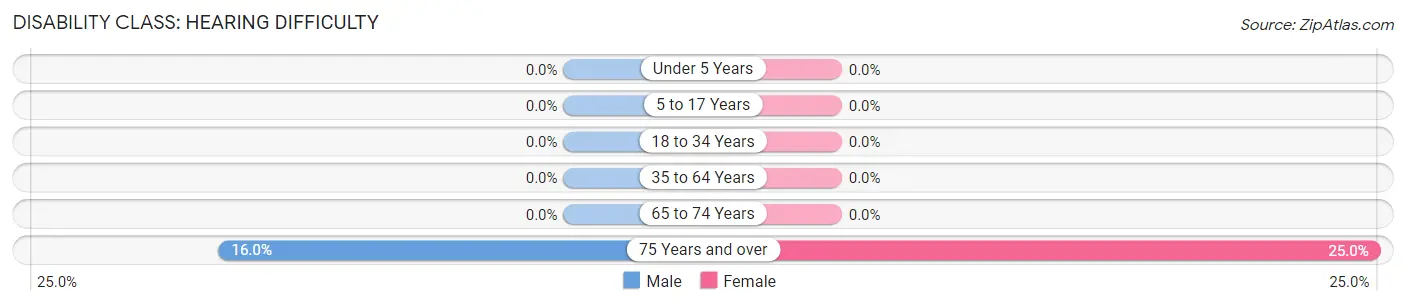
| Age Bracket | Male | Female |
| Under 5 Years | 0 (0.0%) | 0 (0.0%) |
| 5 to 17 Years | 0 (0.0%) | 0 (0.0%) |
| 18 to 34 Years | 0 (0.0%) | 0 (0.0%) |
| 35 to 64 Years | 0 (0.0%) | 0 (0.0%) |
| 65 to 74 Years | 0 (0.0%) | 0 (0.0%) |
| 75 Years and over | 4 (16.0%) | 4 (25.0%) |
Disability Class: Vision Difficulty
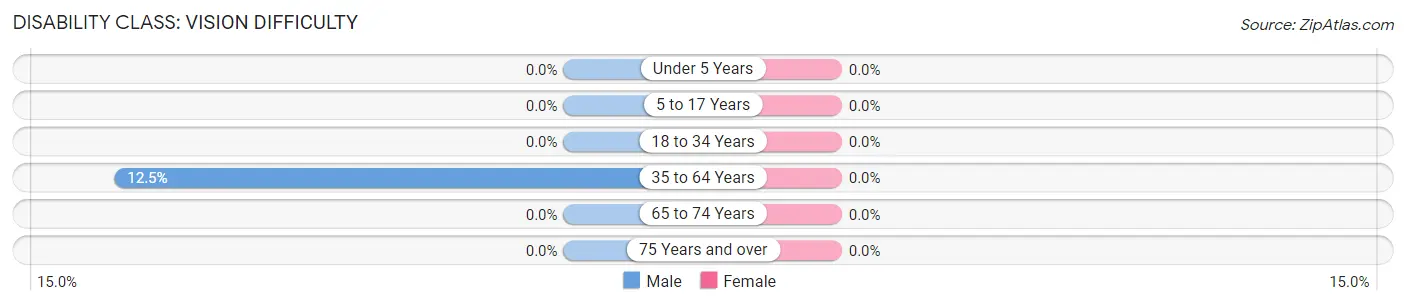
| Age Bracket | Male | Female |
| Under 5 Years | 0 (0.0%) | 0 (0.0%) |
| 5 to 17 Years | 0 (0.0%) | 0 (0.0%) |
| 18 to 34 Years | 0 (0.0%) | 0 (0.0%) |
| 35 to 64 Years | 5 (12.5%) | 0 (0.0%) |
| 65 to 74 Years | 0 (0.0%) | 0 (0.0%) |
| 75 Years and over | 0 (0.0%) | 0 (0.0%) |
Disability Class: Cognitive Difficulty
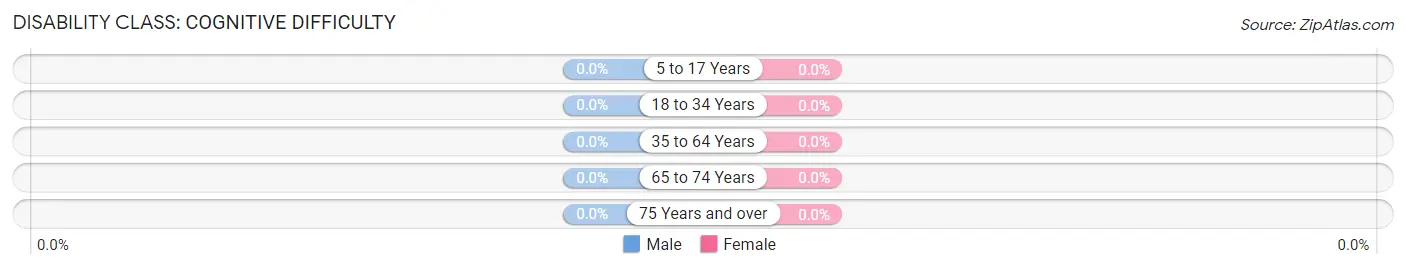
| Age Bracket | Male | Female |
| 5 to 17 Years | 0 (0.0%) | 0 (0.0%) |
| 18 to 34 Years | 0 (0.0%) | 0 (0.0%) |
| 35 to 64 Years | 0 (0.0%) | 0 (0.0%) |
| 65 to 74 Years | 0 (0.0%) | 0 (0.0%) |
| 75 Years and over | 0 (0.0%) | 0 (0.0%) |
Disability Class: Ambulatory Difficulty
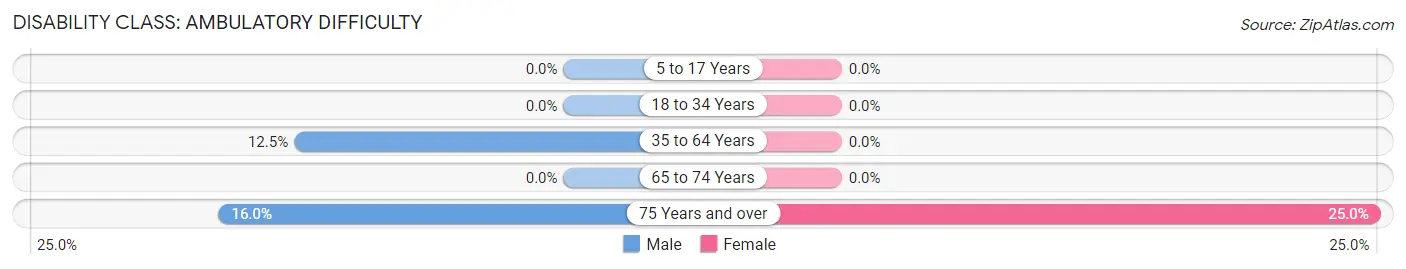
| Age Bracket | Male | Female |
| 5 to 17 Years | 0 (0.0%) | 0 (0.0%) |
| 18 to 34 Years | 0 (0.0%) | 0 (0.0%) |
| 35 to 64 Years | 5 (12.5%) | 0 (0.0%) |
| 65 to 74 Years | 0 (0.0%) | 0 (0.0%) |
| 75 Years and over | 4 (16.0%) | 4 (25.0%) |
Disability Class: Self-Care Difficulty
| Age Bracket | Male | Female |
| 5 to 17 Years | 0 (0.0%) | 0 (0.0%) |
| 18 to 34 Years | 0 (0.0%) | 0 (0.0%) |
| 35 to 64 Years | 0 (0.0%) | 0 (0.0%) |
| 65 to 74 Years | 0 (0.0%) | 0 (0.0%) |
| 75 Years and over | 0 (0.0%) | 0 (0.0%) |
Technology Access in Lake McMurray
Computing Device Access in Lake McMurray
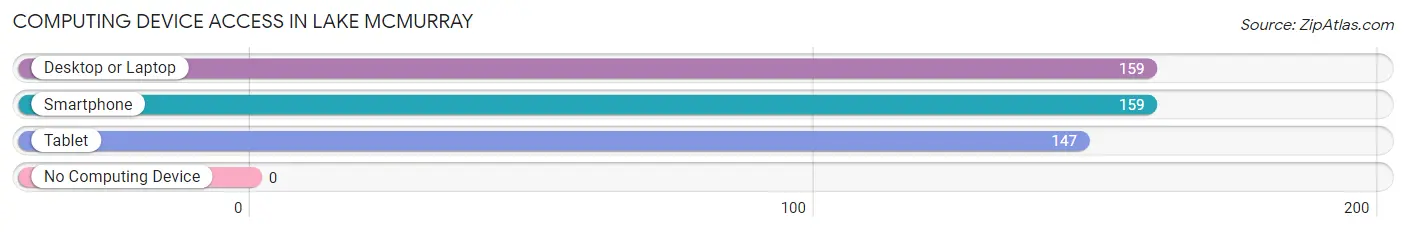
| Device Type | # Households | % Households |
| Desktop or Laptop | 159 | 93.5% |
| Smartphone | 159 | 93.5% |
| Tablet | 147 | 86.5% |
| No Computing Device | 0 | 0.0% |
| Total | 170 | 100.0% |
Internet Access in Lake McMurray
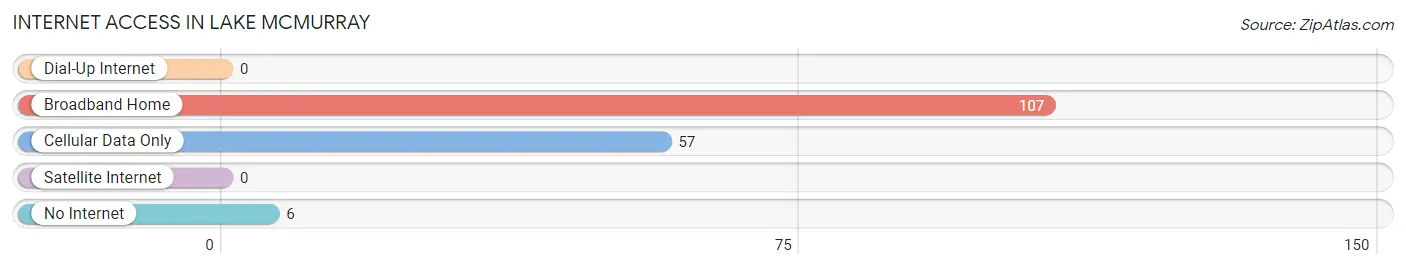
| Internet Type | # Households | % Households |
| Dial-Up Internet | 0 | 0.0% |
| Broadband Home | 107 | 62.9% |
| Cellular Data Only | 57 | 33.5% |
| Satellite Internet | 0 | 0.0% |
| No Internet | 6 | 3.5% |
| Total | 170 | 100.0% |
Lake McMurray Summary
Lake McMurray is a small lake located in the state of Washington, United States. It is located in the Cascade Mountains, about 30 miles east of Seattle. The lake is part of the Skagit River watershed and is fed by several small creeks and streams. The lake is surrounded by a variety of vegetation, including Douglas fir, western hemlock, western red cedar, and alder.
Geography
Lake McMurray is located in the Cascade Mountains of Washington State, about 30 miles east of Seattle. The lake is part of the Skagit River watershed and is fed by several small creeks and streams. The lake is surrounded by a variety of vegetation, including Douglas fir, western hemlock, western red cedar, and alder. The lake is approximately 1,000 acres in size and has a maximum depth of about 40 feet. The lake is located at an elevation of 1,400 feet above sea level.
Economy
The economy of Lake McMurray is largely based on tourism and recreation. The lake is a popular destination for fishing, boating, swimming, and camping. There are several resorts and lodges located on the lake, as well as a number of campgrounds. The lake is also a popular destination for bird watching, as it is home to a variety of waterfowl and other birds.
Demographics
The population of Lake McMurray is estimated to be around 500 people. The majority of the population is white, with a small percentage of African Americans, Native Americans, and Asians. The median household income is estimated to be around $50,000. The median age of the population is around 40 years old.
History
Lake McMurray was first settled in the late 1800s by homesteaders. The lake was originally used for logging and fishing, and the surrounding area was used for farming. In the early 1900s, the lake became a popular destination for recreation and tourism. The lake was also used for hydroelectric power generation in the early 1900s. In the late 1900s, the lake was designated as a protected area and is now managed by the Washington Department of Fish and Wildlife.
Conclusion
Lake McMurray is a small lake located in the Cascade Mountains of Washington State, about 30 miles east of Seattle. The lake is part of the Skagit River watershed and is fed by several small creeks and streams. The lake is surrounded by a variety of vegetation, including Douglas fir, western hemlock, western red cedar, and alder. The economy of Lake McMurray is largely based on tourism and recreation, and the population is estimated to be around 500 people. The lake was first settled in the late 1800s by homesteaders and is now managed by the Washington Department of Fish and Wildlife.
Common Questions
What is Per Capita Income in Lake McMurray?
Per Capita income in Lake McMurray is $32,485.
What is the Median Household income in Lake McMurray?
Median Household Income in Lake McMurray is $41,875.
What is Inequality or Gini Index in Lake McMurray?
Inequality or Gini Index in Lake McMurray is 0.42.
What is the Total Population of Lake McMurray?
Total Population of Lake McMurray is 473.
What is the Total Male Population of Lake McMurray?
Total Male Population of Lake McMurray is 211.
What is the Total Female Population of Lake McMurray?
Total Female Population of Lake McMurray is 262.
What is the Ratio of Males per 100 Females in Lake McMurray?
There are 80.53 Males per 100 Females in Lake McMurray.
What is the Ratio of Females per 100 Males in Lake McMurray?
There are 124.17 Females per 100 Males in Lake McMurray.
What is the Median Population Age in Lake McMurray?
Median Population Age in Lake McMurray is 37.4 Years.
What is the Average Family Size in Lake McMurray
Average Family Size in Lake McMurray is 2.8 People.
What is the Average Household Size in Lake McMurray
Average Household Size in Lake McMurray is 2.8 People.
How Large is the Labor Force in Lake McMurray?
There are 176 People in the Labor Forcein in Lake McMurray.
What is the Percentage of People in the Labor Force in Lake McMurray?
48.1% of People are in the Labor Force in Lake McMurray.