Maplewood, WA Map & Demographics
Maplewood Map
Maplewood Overview
$70,798
PER CAPITA INCOME
$135,875
AVG FAMILY INCOME
$126,615
AVG HOUSEHOLD INCOME
32.5%
WAGE / INCOME GAP [ % ]
67.5¢/ $1
WAGE / INCOME GAP [ $ ]
0.43
INEQUALITY / GINI INDEX
5,518
TOTAL POPULATION
2,453
MALE POPULATION
3,065
FEMALE POPULATION
80.03
MALES / 100 FEMALES
124.95
FEMALES / 100 MALES
48.3
MEDIAN AGE
2.7
AVG FAMILY SIZE
2.5
AVG HOUSEHOLD SIZE
2,740
LABOR FORCE [ PEOPLE ]
60.4%
PERCENT IN LABOR FORCE
7.7%
UNEMPLOYMENT RATE
Income in Maplewood
Income Overview in Maplewood
Per Capita Income in Maplewood is $70,798, while median incomes of families and households are $135,875 and $126,615 respectively.
| Characteristic | Number | Measure |
| Per Capita Income | 5,518 | $70,798 |
| Median Family Income | 1,514 | $135,875 |
| Mean Family Income | 1,514 | $180,341 |
| Median Household Income | 2,199 | $126,615 |
| Mean Household Income | 2,199 | $175,283 |
| Income Deficit | 1,514 | $0 |
| Wage / Income Gap (%) | 5,518 | 32.51% |
| Wage / Income Gap ($) | 5,518 | 67.49¢ per $1 |
| Gini / Inequality Index | 5,518 | 0.43 |
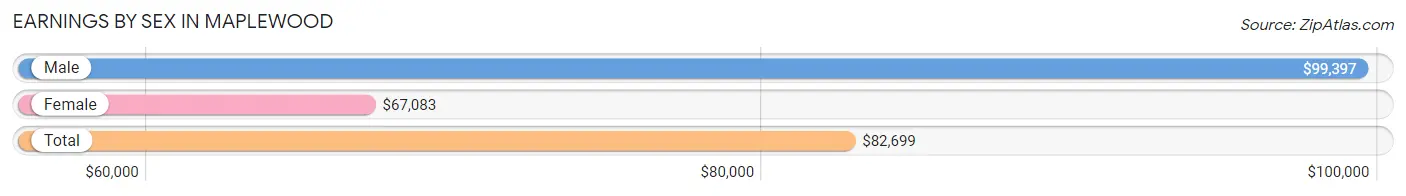
Earnings by Sex in Maplewood
Average Earnings in Maplewood are $82,699, $99,397 for men and $67,083 for women, a difference of 32.5%.
| Sex | Number | Average Earnings |
| Male | 1,502 (53.4%) | $99,397 |
| Female | 1,311 (46.6%) | $67,083 |
| Total | 2,813 (100.0%) | $82,699 |
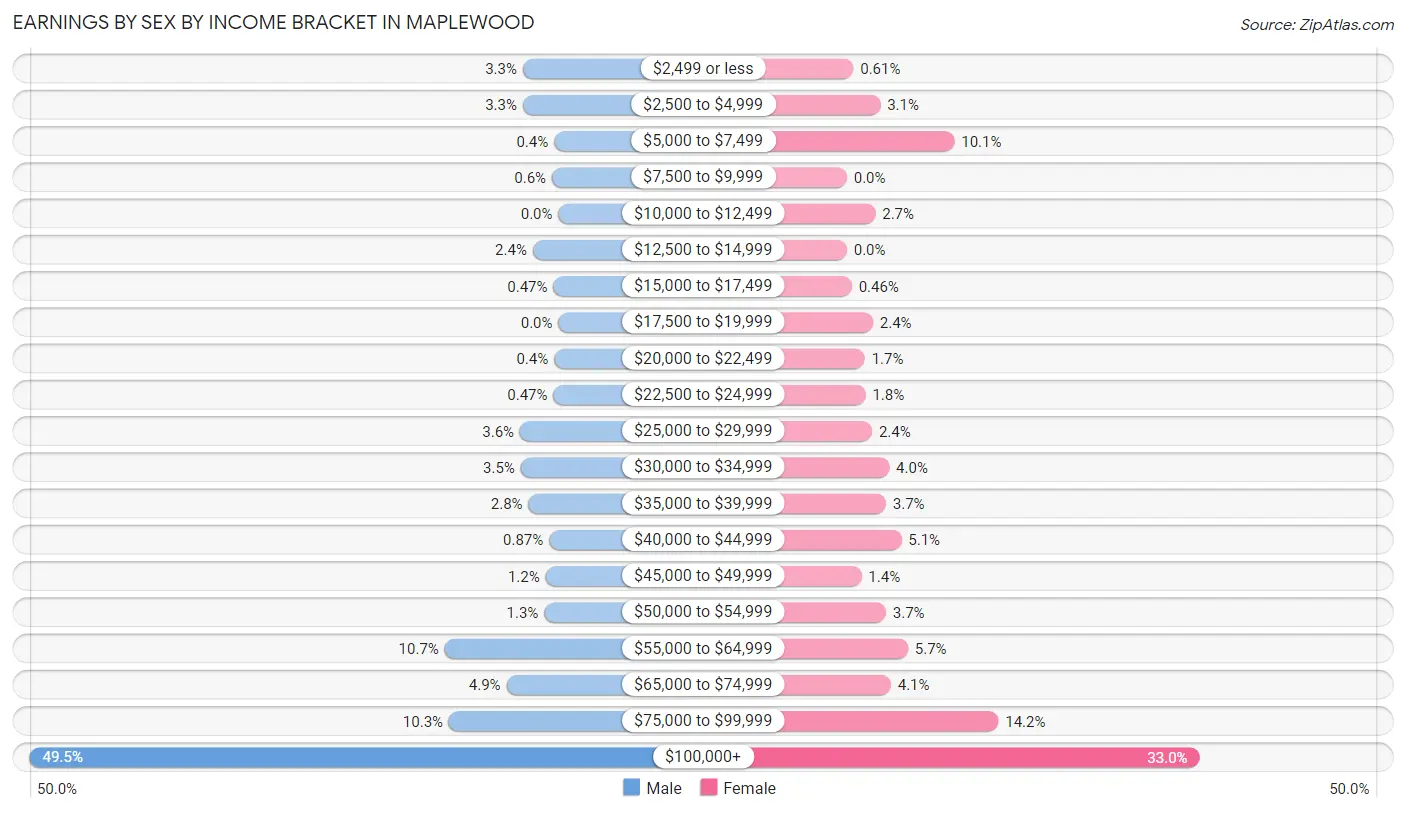
Earnings by Sex by Income Bracket in Maplewood
The most common earnings brackets in Maplewood are $100,000+ for men (744 | 49.5%) and $100,000+ for women (433 | 33.0%).
| Income | Male | Female |
| $2,499 or less | 50 (3.3%) | 8 (0.6%) |
| $2,500 to $4,999 | 50 (3.3%) | 41 (3.1%) |
| $5,000 to $7,499 | 6 (0.4%) | 132 (10.1%) |
| $7,500 to $9,999 | 9 (0.6%) | 0 (0.0%) |
| $10,000 to $12,499 | 0 (0.0%) | 35 (2.7%) |
| $12,500 to $14,999 | 36 (2.4%) | 0 (0.0%) |
| $15,000 to $17,499 | 7 (0.5%) | 6 (0.5%) |
| $17,500 to $19,999 | 0 (0.0%) | 32 (2.4%) |
| $20,000 to $22,499 | 6 (0.4%) | 22 (1.7%) |
| $22,500 to $24,999 | 7 (0.5%) | 23 (1.8%) |
| $25,000 to $29,999 | 54 (3.6%) | 31 (2.4%) |
| $30,000 to $34,999 | 53 (3.5%) | 52 (4.0%) |
| $35,000 to $39,999 | 42 (2.8%) | 48 (3.7%) |
| $40,000 to $44,999 | 13 (0.9%) | 67 (5.1%) |
| $45,000 to $49,999 | 18 (1.2%) | 18 (1.4%) |
| $50,000 to $54,999 | 20 (1.3%) | 48 (3.7%) |
| $55,000 to $64,999 | 160 (10.6%) | 75 (5.7%) |
| $65,000 to $74,999 | 73 (4.9%) | 54 (4.1%) |
| $75,000 to $99,999 | 154 (10.2%) | 186 (14.2%) |
| $100,000+ | 744 (49.5%) | 433 (33.0%) |
| Total | 1,502 (100.0%) | 1,311 (100.0%) |
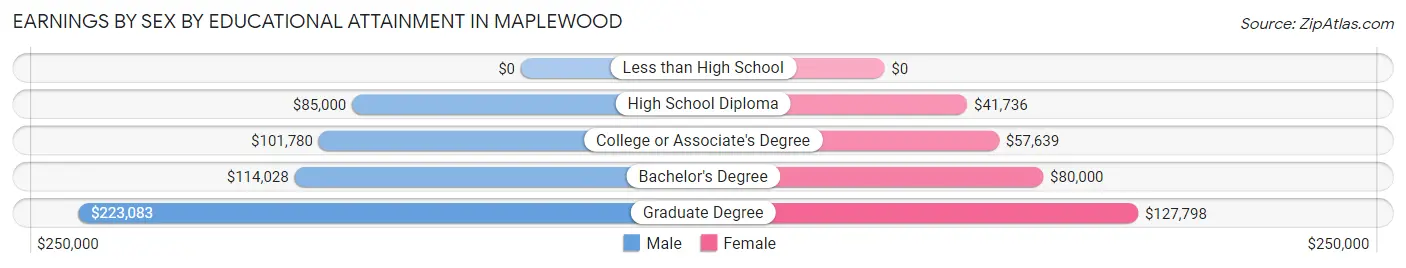
Earnings by Sex by Educational Attainment in Maplewood
Average earnings in Maplewood are $110,972 for men and $73,229 for women, a difference of 34.0%. Men with an educational attainment of graduate degree enjoy the highest average annual earnings of $223,083, while those with high school diploma education earn the least with $85,000. Women with an educational attainment of graduate degree earn the most with the average annual earnings of $127,798, while those with high school diploma education have the smallest earnings of $41,736.
| Educational Attainment | Male Income | Female Income |
| Less than High School | - | - |
| High School Diploma | $85,000 | $41,736 |
| College or Associate's Degree | $101,780 | $57,639 |
| Bachelor's Degree | $114,028 | $80,000 |
| Graduate Degree | $223,083 | $127,798 |
| Total | $110,972 | $73,229 |
Family Income in Maplewood
Family Income Brackets in Maplewood
According to the Maplewood family income data, there are 422 families falling into the $200,000+ income range, which is the most common income bracket and makes up 27.9% of all families.
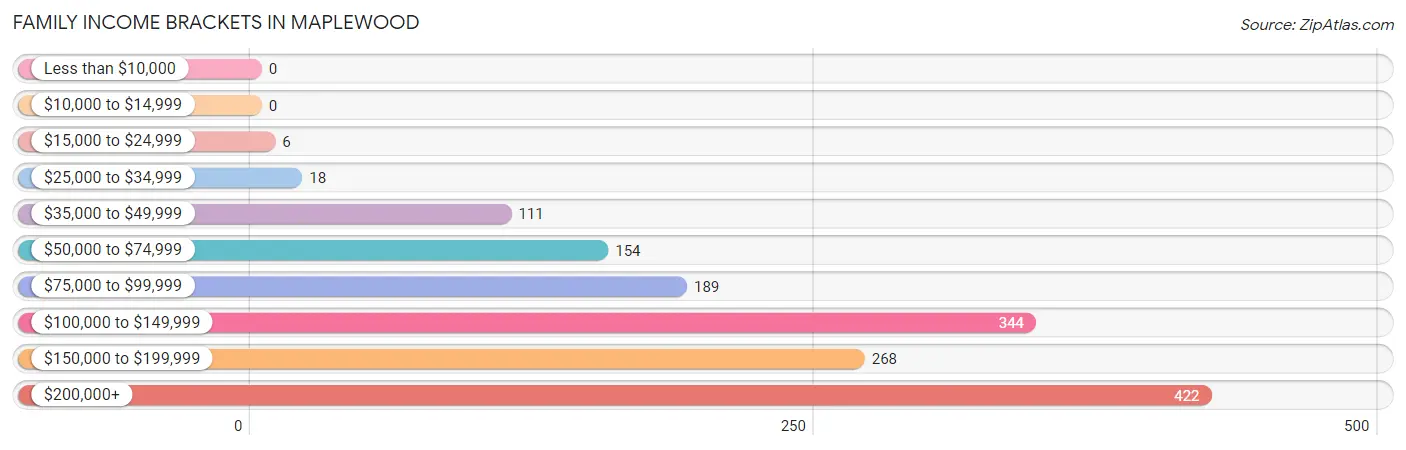
| Income Bracket | # Families | % Families |
| Less than $10,000 | 0 | 0.0% |
| $10,000 to $14,999 | 0 | 0.0% |
| $15,000 to $24,999 | 6 | 0.4% |
| $25,000 to $34,999 | 18 | 1.2% |
| $35,000 to $49,999 | 111 | 7.3% |
| $50,000 to $74,999 | 154 | 10.2% |
| $75,000 to $99,999 | 189 | 12.5% |
| $100,000 to $149,999 | 344 | 22.7% |
| $150,000 to $199,999 | 268 | 17.7% |
| $200,000+ | 422 | 27.9% |
Family Income by Famaliy Size in Maplewood
3-person families (405 | 26.8%) account for the highest median family income in Maplewood with $189,494 per family, while 3-person families (405 | 26.8%) have the highest median income of $63,165 per family member.
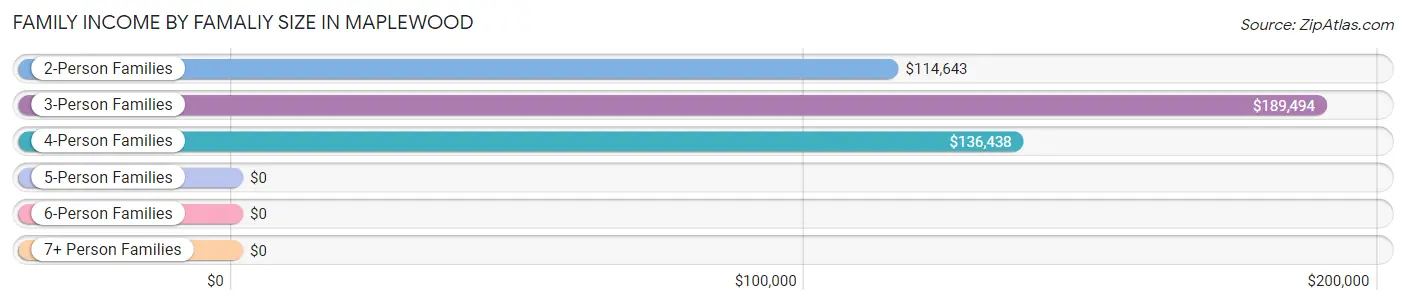
| Income Bracket | # Families | Median Income |
| 2-Person Families | 862 (56.9%) | $114,643 |
| 3-Person Families | 405 (26.8%) | $189,494 |
| 4-Person Families | 203 (13.4%) | $136,438 |
| 5-Person Families | 44 (2.9%) | $0 |
| 6-Person Families | 0 (0.0%) | $0 |
| 7+ Person Families | 0 (0.0%) | $0 |
| Total | 1,514 (100.0%) | $135,875 |
Family Income by Number of Earners in Maplewood
The median family income in Maplewood is $135,875, with families comprising 3+ earners (89) having the highest median family income of $228,125, while families with no earners (280) have the lowest median family income of $90,714, accounting for 5.9% and 18.5% of families, respectively.
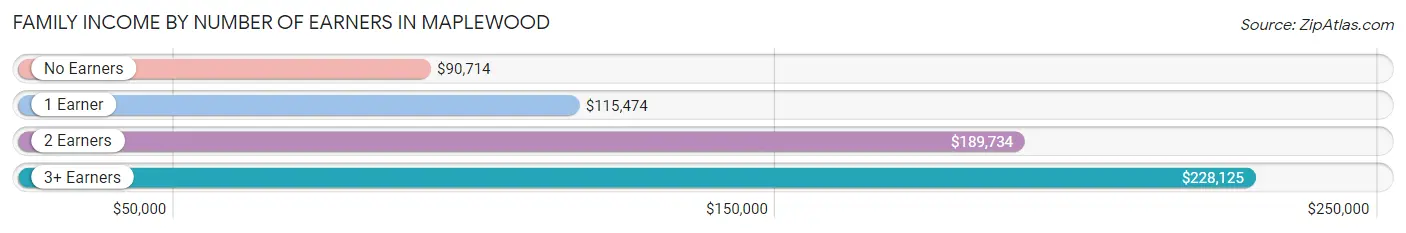
| Number of Earners | # Families | Median Income |
| No Earners | 280 (18.5%) | $90,714 |
| 1 Earner | 559 (36.9%) | $115,474 |
| 2 Earners | 586 (38.7%) | $189,734 |
| 3+ Earners | 89 (5.9%) | $228,125 |
| Total | 1,514 (100.0%) | $135,875 |
Household Income in Maplewood
Household Income Brackets in Maplewood
With 515 households falling in the category, the $200,000+ income range is the most frequent in Maplewood, accounting for 23.4% of all households. In contrast, only 15 households (0.7%) fall into the $10,000 to $14,999 income bracket, making it the least populous group.
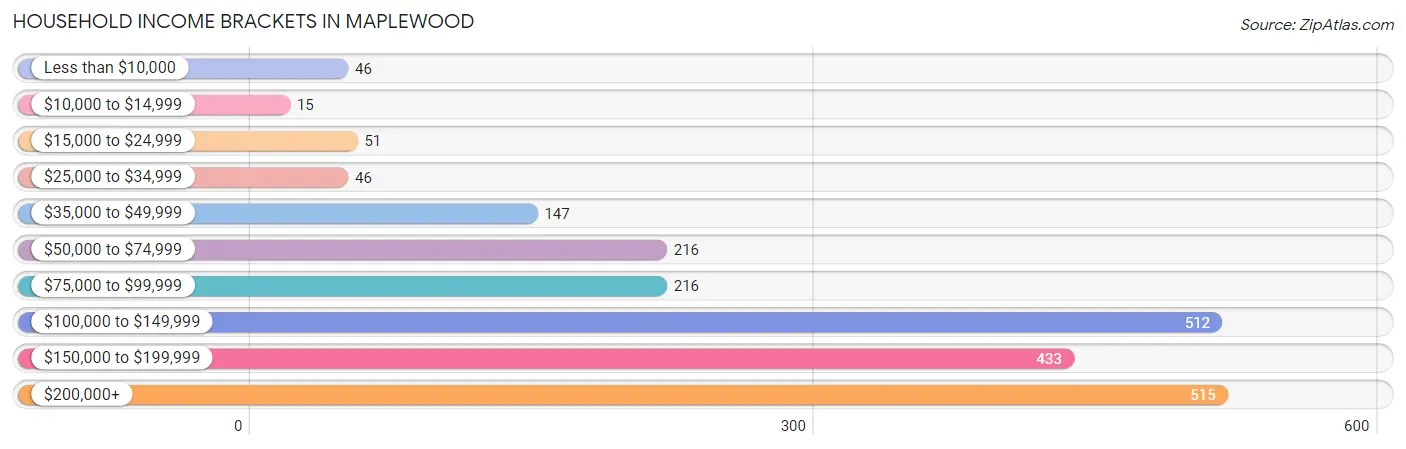
| Income Bracket | # Households | % Households |
| Less than $10,000 | 46 | 2.1% |
| $10,000 to $14,999 | 15 | 0.7% |
| $15,000 to $24,999 | 51 | 2.3% |
| $25,000 to $34,999 | 46 | 2.1% |
| $35,000 to $49,999 | 147 | 6.7% |
| $50,000 to $74,999 | 216 | 9.8% |
| $75,000 to $99,999 | 216 | 9.8% |
| $100,000 to $149,999 | 512 | 23.3% |
| $150,000 to $199,999 | 433 | 19.7% |
| $200,000+ | 515 | 23.4% |
Household Income by Householder Age in Maplewood
The median household income in Maplewood is $126,615, with the highest median household income of $178,958 found in the 45 to 64 years age bracket for the primary householder. A total of 1,039 households (47.2%) fall into this category. Meanwhile, the 15 to 24 years age bracket for the primary householder has the lowest median household income of $0, with 9 households (0.4%) in this group.
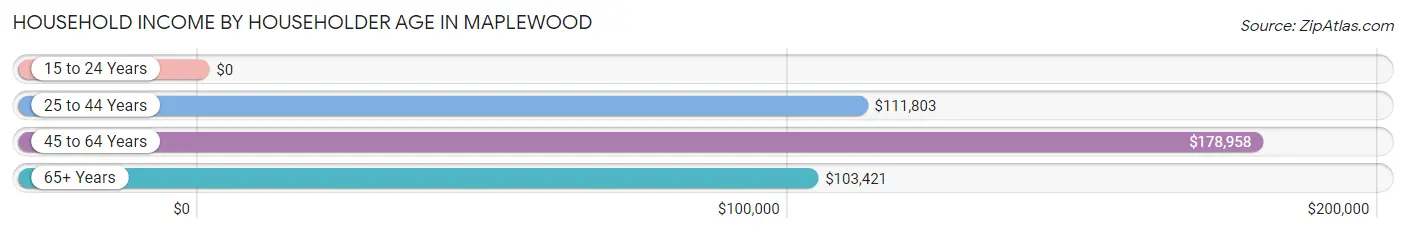
| Income Bracket | # Households | Median Income |
| 15 to 24 Years | 9 (0.4%) | $0 |
| 25 to 44 Years | 493 (22.4%) | $111,803 |
| 45 to 64 Years | 1,039 (47.2%) | $178,958 |
| 65+ Years | 658 (29.9%) | $103,421 |
| Total | 2,199 (100.0%) | $126,615 |
Poverty in Maplewood
Income Below Poverty by Sex and Age in Maplewood
With 0.1% poverty level for males and 9.5% for females among the residents of Maplewood, 45 to 54 year old males and 15 year old females are the most vulnerable to poverty, with 3 males (0.7%) and 75 females (100.0%) in their respective age groups living below the poverty level.
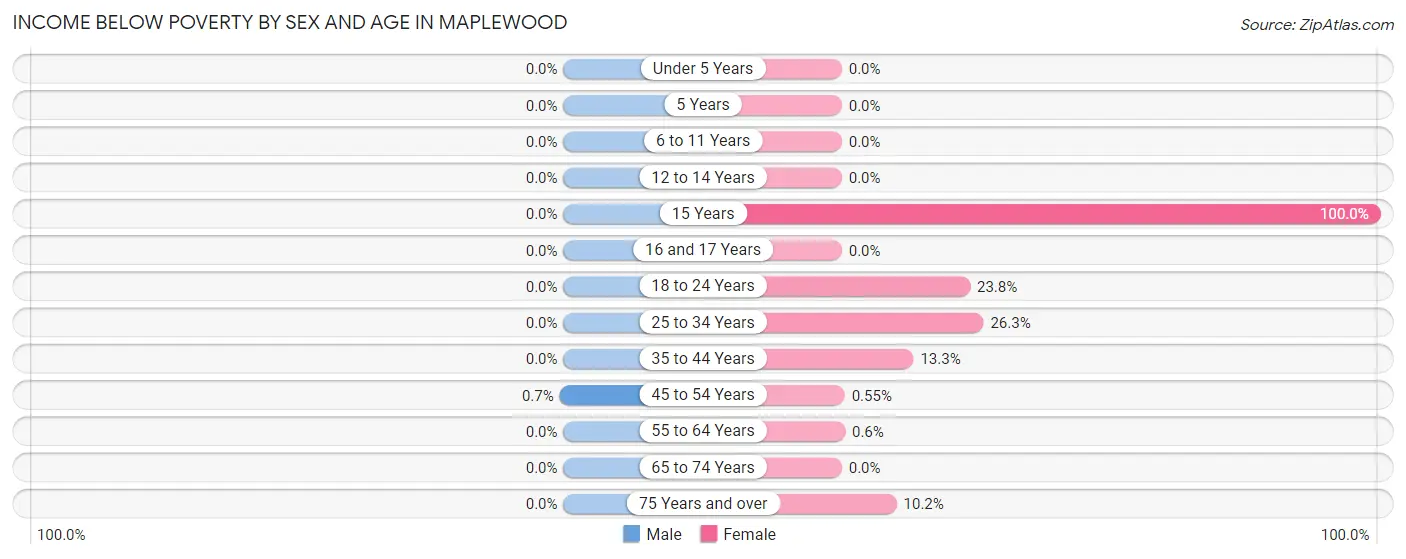
| Age Bracket | Male | Female |
| Under 5 Years | 0 (0.0%) | 0 (0.0%) |
| 5 Years | 0 (0.0%) | 0 (0.0%) |
| 6 to 11 Years | 0 (0.0%) | 0 (0.0%) |
| 12 to 14 Years | 0 (0.0%) | 0 (0.0%) |
| 15 Years | 0 (0.0%) | 75 (100.0%) |
| 16 and 17 Years | 0 (0.0%) | 0 (0.0%) |
| 18 to 24 Years | 0 (0.0%) | 25 (23.8%) |
| 25 to 34 Years | 0 (0.0%) | 96 (26.3%) |
| 35 to 44 Years | 0 (0.0%) | 47 (13.3%) |
| 45 to 54 Years | 3 (0.7%) | 2 (0.5%) |
| 55 to 64 Years | 0 (0.0%) | 3 (0.6%) |
| 65 to 74 Years | 0 (0.0%) | 0 (0.0%) |
| 75 Years and over | 0 (0.0%) | 18 (10.2%) |
| Total | 3 (0.1%) | 266 (9.5%) |
Income Above Poverty by Sex and Age in Maplewood
According to the poverty statistics in Maplewood, males aged under 5 years and females aged under 5 years are the age groups that are most secure financially, with 100.0% of males and 100.0% of females in these age groups living above the poverty line.
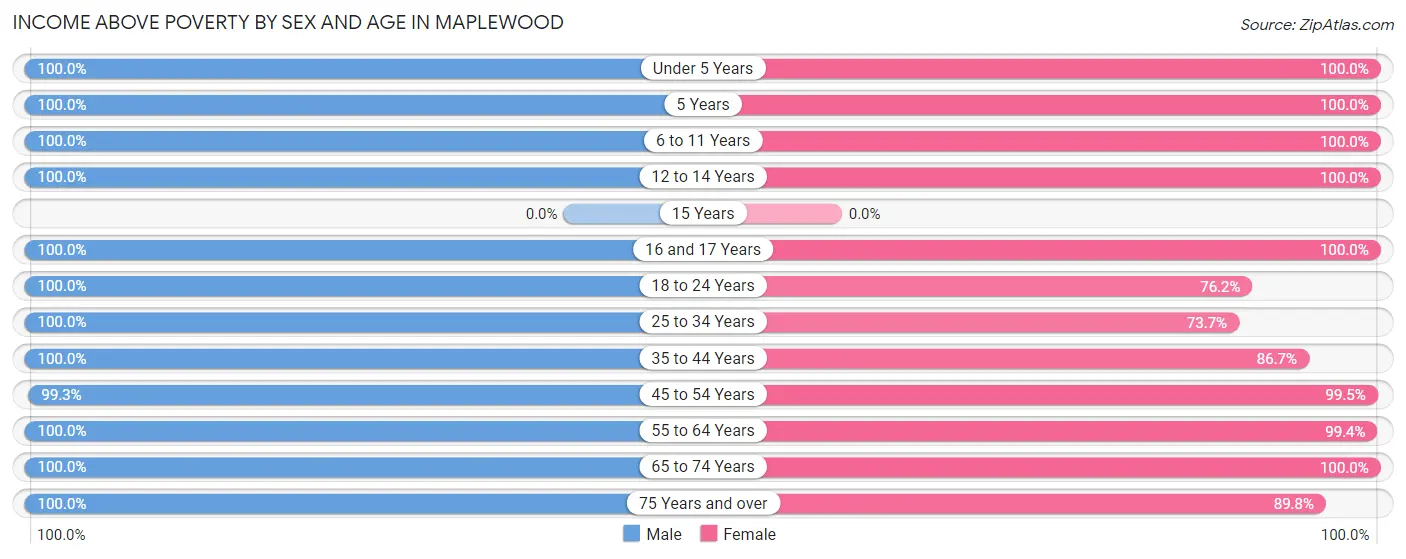
| Age Bracket | Male | Female |
| Under 5 Years | 71 (100.0%) | 146 (100.0%) |
| 5 Years | 19 (100.0%) | 30 (100.0%) |
| 6 to 11 Years | 96 (100.0%) | 99 (100.0%) |
| 12 to 14 Years | 42 (100.0%) | 100 (100.0%) |
| 15 Years | 0 (0.0%) | 0 (0.0%) |
| 16 and 17 Years | 49 (100.0%) | 26 (100.0%) |
| 18 to 24 Years | 131 (100.0%) | 80 (76.2%) |
| 25 to 34 Years | 152 (100.0%) | 269 (73.7%) |
| 35 to 44 Years | 368 (100.0%) | 306 (86.7%) |
| 45 to 54 Years | 425 (99.3%) | 364 (99.5%) |
| 55 to 64 Years | 484 (100.0%) | 499 (99.4%) |
| 65 to 74 Years | 434 (100.0%) | 448 (100.0%) |
| 75 Years and over | 143 (100.0%) | 159 (89.8%) |
| Total | 2,414 (99.9%) | 2,526 (90.5%) |
Income Below Poverty Among Married-Couple Families in Maplewood
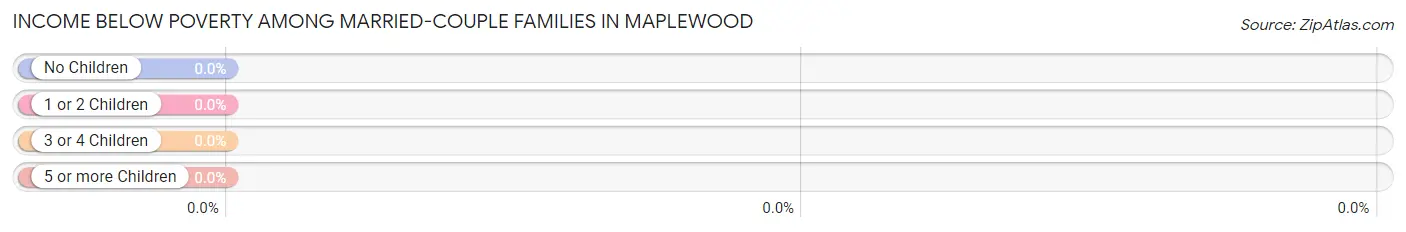
| Children | Above Poverty | Below Poverty |
| No Children | 856 (100.0%) | 0 (0.0%) |
| 1 or 2 Children | 457 (100.0%) | 0 (0.0%) |
| 3 or 4 Children | 0 (0.0%) | 0 (0.0%) |
| 5 or more Children | 0 (0.0%) | 0 (0.0%) |
| Total | 1,313 (100.0%) | 0 (0.0%) |
Income Below Poverty Among Single-Parent Households in Maplewood
| Children | Single Father | Single Mother |
| No Children | 0 (0.0%) | 0 (0.0%) |
| 1 or 2 Children | 0 (0.0%) | 0 (0.0%) |
| 3 or 4 Children | 0 (0.0%) | 0 (0.0%) |
| 5 or more Children | 0 (0.0%) | 0 (0.0%) |
| Total | 0 (0.0%) | 0 (0.0%) |
Income Below Poverty Among Married-Couple vs Single-Parent Households in Maplewood
| Children | Married-Couple Families | Single-Parent Households |
| No Children | 0 (0.0%) | 0 (0.0%) |
| 1 or 2 Children | 0 (0.0%) | 0 (0.0%) |
| 3 or 4 Children | 0 (0.0%) | 0 (0.0%) |
| 5 or more Children | 0 (0.0%) | 0 (0.0%) |
| Total | 0 (0.0%) | 0 (0.0%) |
Race in Maplewood
The most populous races in Maplewood are White / Caucasian (4,966 | 90.0%), Two or more Races (276 | 5.0%), and Asian (216 | 3.9%).
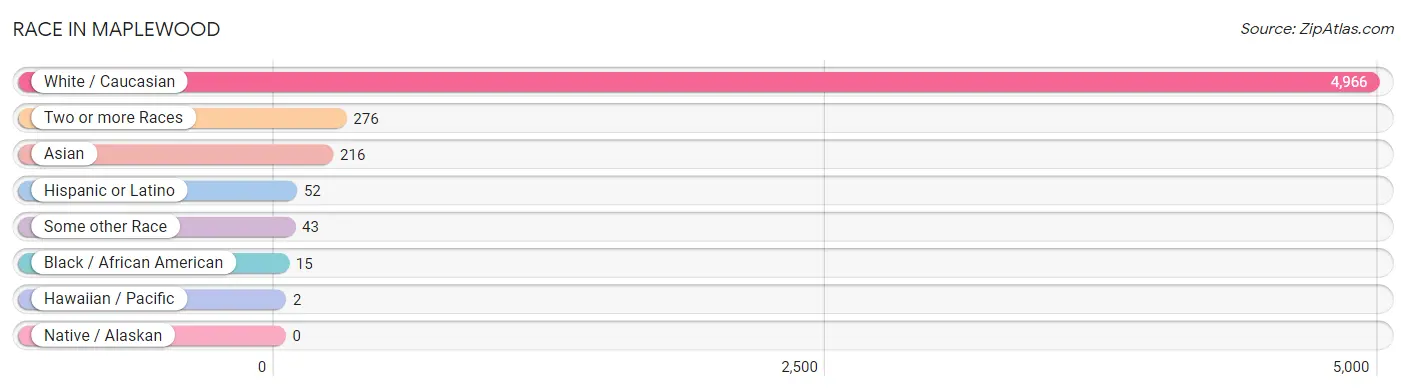
| Race | # Population | % Population |
| Asian | 216 | 3.9% |
| Black / African American | 15 | 0.3% |
| Hawaiian / Pacific | 2 | 0.0% |
| Hispanic or Latino | 52 | 0.9% |
| Native / Alaskan | 0 | 0.0% |
| White / Caucasian | 4,966 | 90.0% |
| Two or more Races | 276 | 5.0% |
| Some other Race | 43 | 0.8% |
| Total | 5,518 | 100.0% |
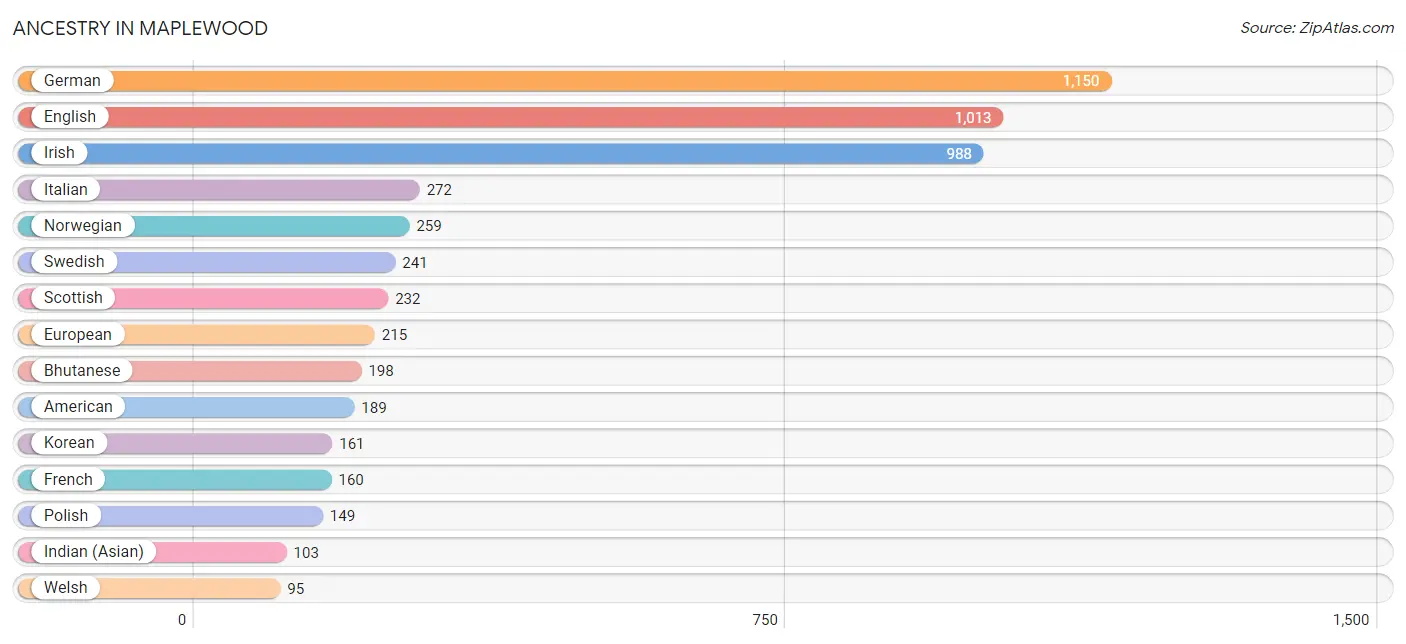
Ancestry in Maplewood
The most populous ancestries reported in Maplewood are German (1,150 | 20.8%), English (1,013 | 18.4%), Irish (988 | 17.9%), Italian (272 | 4.9%), and Norwegian (259 | 4.7%), together accounting for 66.7% of all Maplewood residents.
| Ancestry | # Population | % Population |
| American | 189 | 3.4% |
| Arab | 13 | 0.2% |
| Austrian | 11 | 0.2% |
| Belgian | 7 | 0.1% |
| Bhutanese | 198 | 3.6% |
| Brazilian | 31 | 0.6% |
| British | 27 | 0.5% |
| Burmese | 59 | 1.1% |
| Cherokee | 8 | 0.1% |
| Choctaw | 20 | 0.4% |
| Croatian | 7 | 0.1% |
| Czech | 21 | 0.4% |
| Danish | 89 | 1.6% |
| Dutch | 58 | 1.1% |
| Eastern European | 19 | 0.3% |
| English | 1,013 | 18.4% |
| European | 215 | 3.9% |
| Fijian | 1 | 0.0% |
| Finnish | 74 | 1.3% |
| French | 160 | 2.9% |
| French Canadian | 20 | 0.4% |
| German | 1,150 | 20.8% |
| Guamanian / Chamorro | 2 | 0.0% |
| Hungarian | 11 | 0.2% |
| Indian (Asian) | 103 | 1.9% |
| Irish | 988 | 17.9% |
| Italian | 272 | 4.9% |
| Korean | 161 | 2.9% |
| Lebanese | 7 | 0.1% |
| Mexican | 36 | 0.6% |
| Native Hawaiian | 31 | 0.6% |
| Northern European | 9 | 0.2% |
| Norwegian | 259 | 4.7% |
| Pakistani | 15 | 0.3% |
| Peruvian | 5 | 0.1% |
| Polish | 149 | 2.7% |
| Portuguese | 39 | 0.7% |
| Puerto Rican | 10 | 0.2% |
| Romanian | 8 | 0.1% |
| Russian | 39 | 0.7% |
| Scandinavian | 57 | 1.0% |
| Scotch-Irish | 71 | 1.3% |
| Scottish | 232 | 4.2% |
| Slavic | 18 | 0.3% |
| South American | 5 | 0.1% |
| Spaniard | 1 | 0.0% |
| Swedish | 241 | 4.4% |
| Swiss | 26 | 0.5% |
| Syrian | 6 | 0.1% |
| Thai | 18 | 0.3% |
| Turkish | 7 | 0.1% |
| Ukrainian | 15 | 0.3% |
| Welsh | 95 | 1.7% | View All 53 Rows |
Immigrants in Maplewood
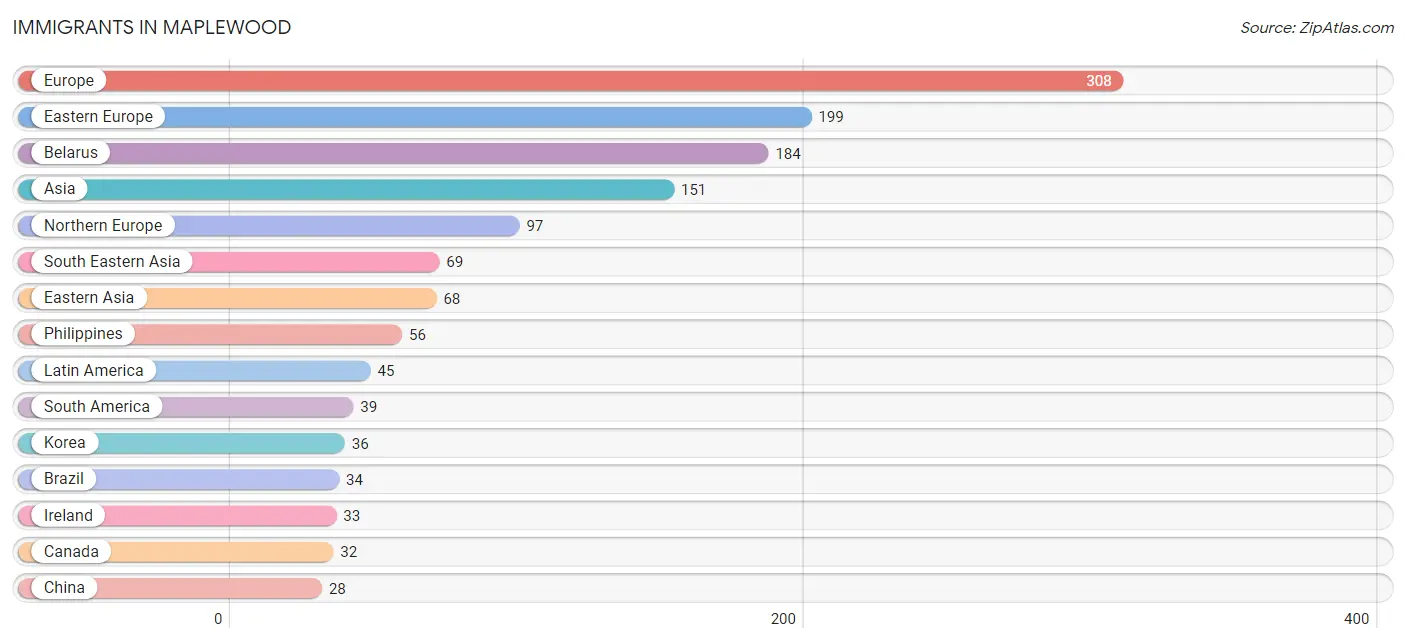
The most numerous immigrant groups reported in Maplewood came from Europe (308 | 5.6%), Eastern Europe (199 | 3.6%), Belarus (184 | 3.3%), Asia (151 | 2.7%), and Northern Europe (97 | 1.8%), together accounting for 17.0% of all Maplewood residents.
| Immigration Origin | # Population | % Population |
| Africa | 11 | 0.2% |
| Asia | 151 | 2.7% |
| Belarus | 184 | 3.3% |
| Brazil | 34 | 0.6% |
| Canada | 32 | 0.6% |
| Central America | 6 | 0.1% |
| China | 28 | 0.5% |
| Croatia | 7 | 0.1% |
| Eastern Asia | 68 | 1.2% |
| Eastern Europe | 199 | 3.6% |
| England | 22 | 0.4% |
| Europe | 308 | 5.6% |
| France | 5 | 0.1% |
| Germany | 6 | 0.1% |
| Hong Kong | 14 | 0.3% |
| Ireland | 33 | 0.6% |
| Japan | 4 | 0.1% |
| Korea | 36 | 0.6% |
| Latin America | 45 | 0.8% |
| Lebanon | 7 | 0.1% |
| Mexico | 6 | 0.1% |
| Northern Europe | 97 | 1.8% |
| Oceania | 1 | 0.0% |
| Philippines | 56 | 1.0% |
| Romania | 8 | 0.1% |
| South Africa | 11 | 0.2% |
| South America | 39 | 0.7% |
| South Eastern Asia | 69 | 1.3% |
| Southern Europe | 1 | 0.0% |
| Spain | 1 | 0.0% |
| Taiwan | 14 | 0.3% |
| Thailand | 13 | 0.2% |
| Turkey | 7 | 0.1% |
| Venezuela | 5 | 0.1% |
| Western Asia | 14 | 0.3% |
| Western Europe | 11 | 0.2% | View All 36 Rows |
Sex and Age in Maplewood
Sex and Age in Maplewood
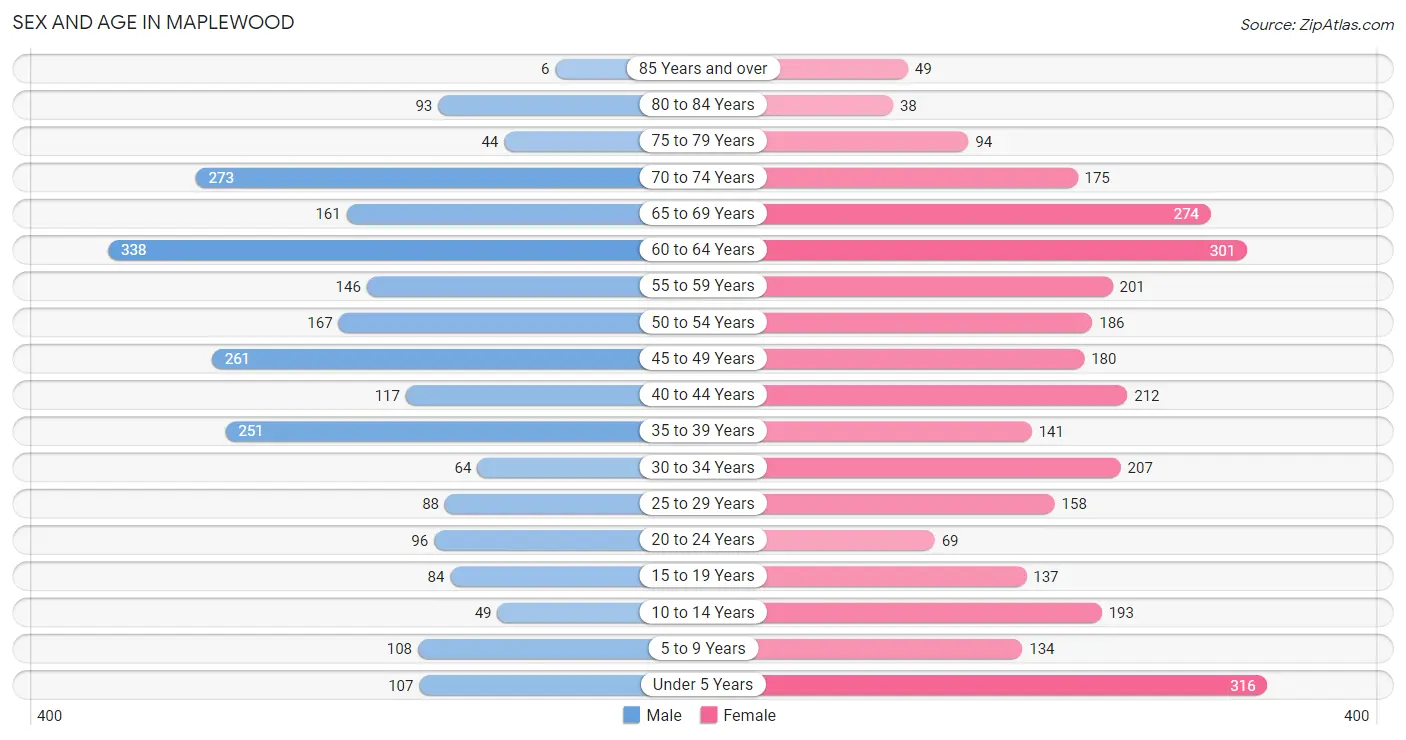
The most populous age groups in Maplewood are 60 to 64 Years (338 | 13.8%) for men and Under 5 Years (316 | 10.3%) for women.
| Age Bracket | Male | Female |
| Under 5 Years | 107 (4.4%) | 316 (10.3%) |
| 5 to 9 Years | 108 (4.4%) | 134 (4.4%) |
| 10 to 14 Years | 49 (2.0%) | 193 (6.3%) |
| 15 to 19 Years | 84 (3.4%) | 137 (4.5%) |
| 20 to 24 Years | 96 (3.9%) | 69 (2.2%) |
| 25 to 29 Years | 88 (3.6%) | 158 (5.1%) |
| 30 to 34 Years | 64 (2.6%) | 207 (6.8%) |
| 35 to 39 Years | 251 (10.2%) | 141 (4.6%) |
| 40 to 44 Years | 117 (4.8%) | 212 (6.9%) |
| 45 to 49 Years | 261 (10.6%) | 180 (5.9%) |
| 50 to 54 Years | 167 (6.8%) | 186 (6.1%) |
| 55 to 59 Years | 146 (5.9%) | 201 (6.6%) |
| 60 to 64 Years | 338 (13.8%) | 301 (9.8%) |
| 65 to 69 Years | 161 (6.6%) | 274 (8.9%) |
| 70 to 74 Years | 273 (11.1%) | 175 (5.7%) |
| 75 to 79 Years | 44 (1.8%) | 94 (3.1%) |
| 80 to 84 Years | 93 (3.8%) | 38 (1.2%) |
| 85 Years and over | 6 (0.2%) | 49 (1.6%) |
| Total | 2,453 (100.0%) | 3,065 (100.0%) |
Families and Households in Maplewood
Median Family Size in Maplewood
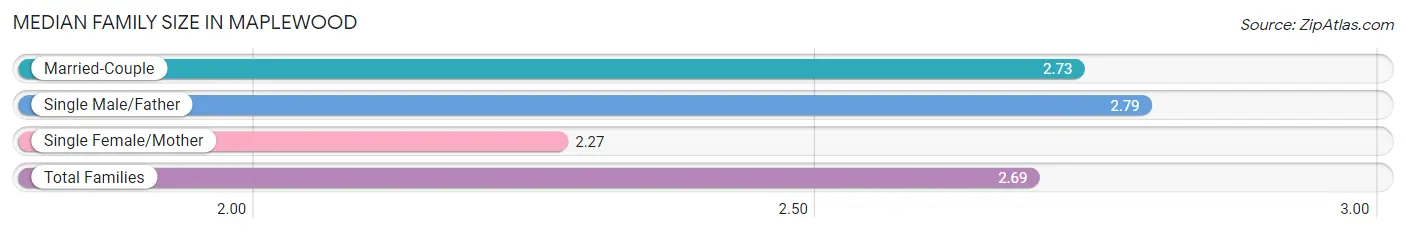
The median family size in Maplewood is 2.69 persons per family, with single male/father families (47 | 3.1%) accounting for the largest median family size of 2.79 persons per family. On the other hand, single female/mother families (154 | 10.2%) represent the smallest median family size with 2.27 persons per family.
| Family Type | # Families | Family Size |
| Married-Couple | 1,313 (86.7%) | 2.73 |
| Single Male/Father | 47 (3.1%) | 2.79 |
| Single Female/Mother | 154 (10.2%) | 2.27 |
| Total Families | 1,514 (100.0%) | 2.69 |
Median Household Size in Maplewood
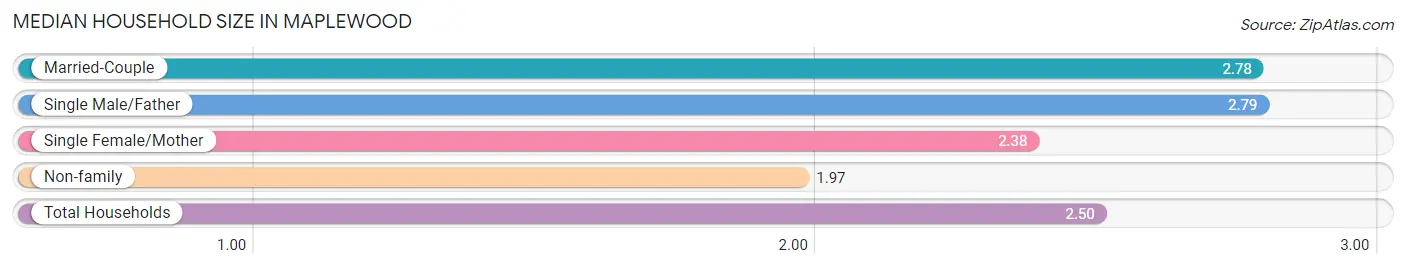
The median household size in Maplewood is 2.50 persons per household, with single male/father households (47 | 2.1%) accounting for the largest median household size of 2.79 persons per household. non-family households (685 | 31.1%) represent the smallest median household size with 1.97 persons per household.
| Household Type | # Households | Household Size |
| Married-Couple | 1,313 (59.7%) | 2.78 |
| Single Male/Father | 47 (2.1%) | 2.79 |
| Single Female/Mother | 154 (7.0%) | 2.38 |
| Non-family | 685 (31.1%) | 1.97 |
| Total Households | 2,199 (100.0%) | 2.50 |
Household Size by Marriage Status in Maplewood
Out of a total of 2,199 households in Maplewood, 1,514 (68.9%) are family households, while 685 (31.1%) are nonfamily households. The most numerous type of family households are 2-person households, comprising 838, and the most common type of nonfamily households are 1-person households, comprising 469.
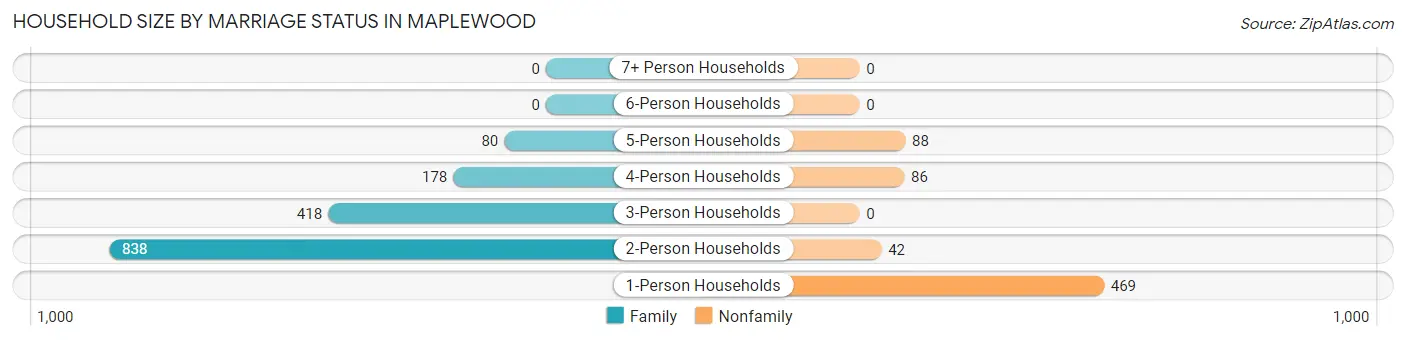
| Household Size | Family Households | Nonfamily Households |
| 1-Person Households | - | 469 (21.3%) |
| 2-Person Households | 838 (38.1%) | 42 (1.9%) |
| 3-Person Households | 418 (19.0%) | 0 (0.0%) |
| 4-Person Households | 178 (8.1%) | 86 (3.9%) |
| 5-Person Households | 80 (3.6%) | 88 (4.0%) |
| 6-Person Households | 0 (0.0%) | 0 (0.0%) |
| 7+ Person Households | 0 (0.0%) | 0 (0.0%) |
| Total | 1,514 (68.9%) | 685 (31.1%) |
Female Fertility in Maplewood
Fertility by Age in Maplewood
Average fertility rate in Maplewood is 164.0 births per 1,000 women. Women in the age bracket of 20 to 34 years have the highest fertility rate with 401.0 births per 1,000 women. Women in the age bracket of 20 to 34 years acount for 95.6% of all women with births.
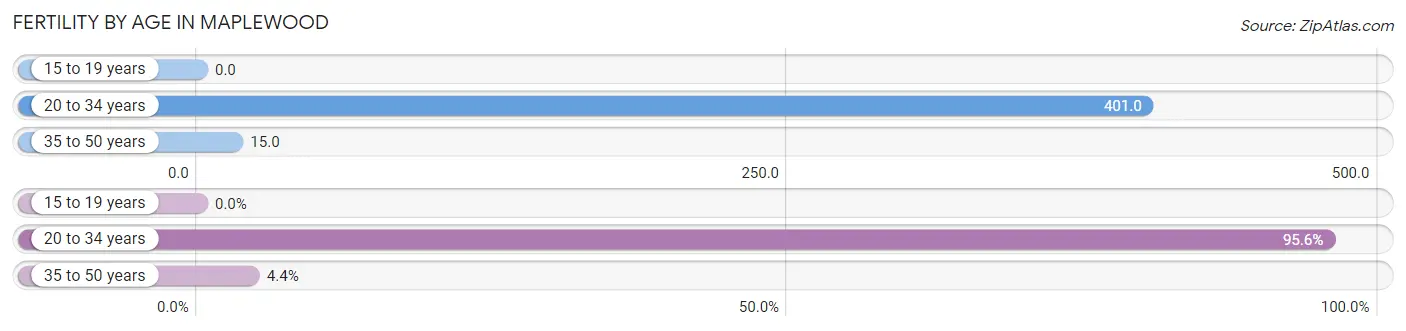
| Age Bracket | Women with Births | Births / 1,000 Women |
| 15 to 19 years | 0 (0.0%) | 0.0 |
| 20 to 34 years | 174 (95.6%) | 401.0 |
| 35 to 50 years | 8 (4.4%) | 15.0 |
| Total | 182 (100.0%) | 164.0 |
Fertility by Age by Marriage Status in Maplewood
76.4% of women with births (182) in Maplewood are married. The highest percentage of unmarried women with births falls into 20 to 34 years age bracket with 24.7% of them unmarried at the time of birth, while the lowest percentage of unmarried women with births belong to 35 to 50 years age bracket with 0.0% of them unmarried.
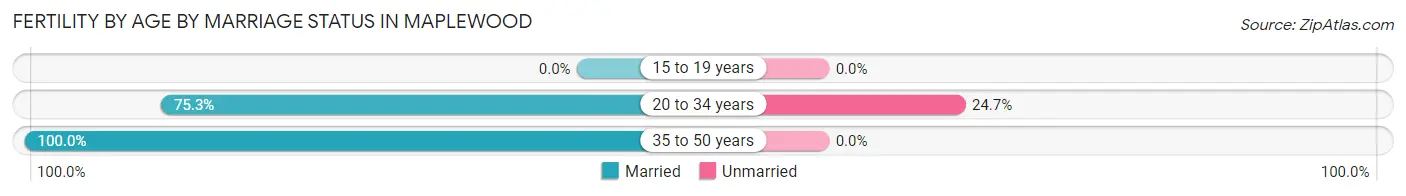
| Age Bracket | Married | Unmarried |
| 15 to 19 years | 0 (0.0%) | 0 (0.0%) |
| 20 to 34 years | 131 (75.3%) | 43 (24.7%) |
| 35 to 50 years | 8 (100.0%) | 0 (0.0%) |
| Total | 139 (76.4%) | 43 (23.6%) |
Fertility by Education in Maplewood
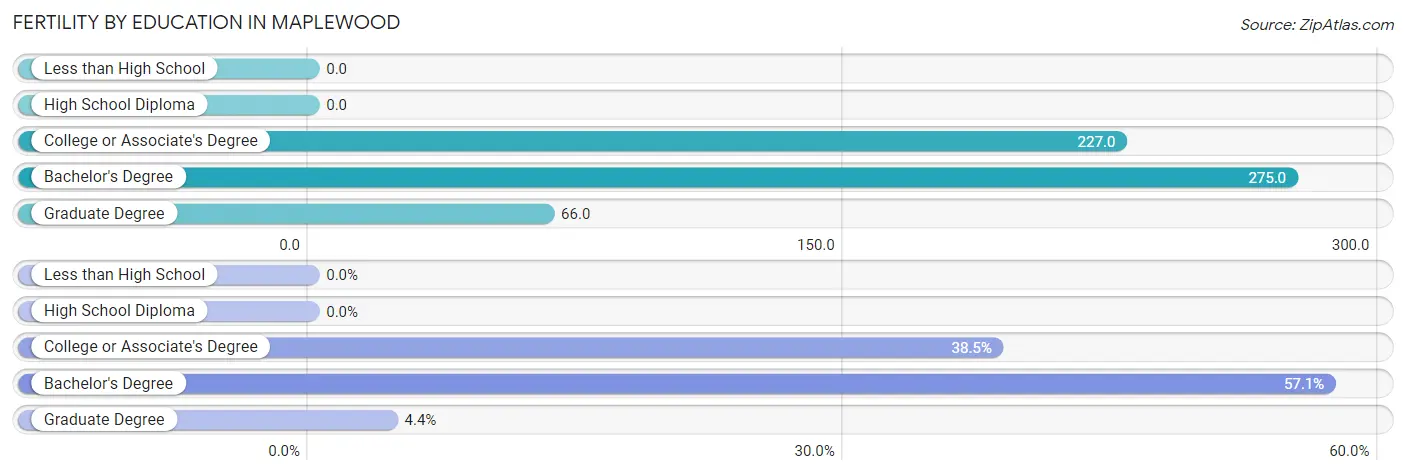
| Educational Attainment | Women with Births | Births / 1,000 Women |
| Less than High School | 0 (0.0%) | 0.0 |
| High School Diploma | 0 (0.0%) | 0.0 |
| College or Associate's Degree | 70 (38.5%) | 227.0 |
| Bachelor's Degree | 104 (57.1%) | 275.0 |
| Graduate Degree | 8 (4.4%) | 66.0 |
| Total | 182 (100.0%) | 164.0 |
Fertility by Education by Marriage Status in Maplewood
23.6% of women with births in Maplewood are unmarried. Women with the educational attainment of bachelor's degree are most likely to be married with 100.0% of them married at childbirth, while women with the educational attainment of college or associate's degree are least likely to be married with 61.4% of them unmarried at childbirth.
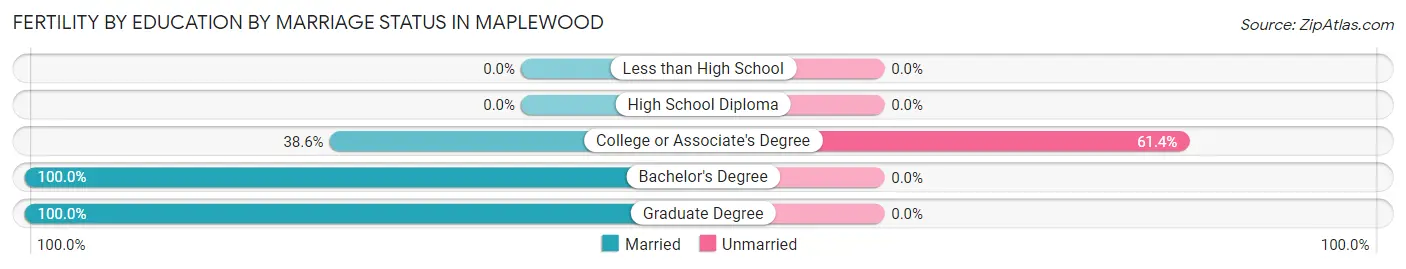
| Educational Attainment | Married | Unmarried |
| Less than High School | 0 (0.0%) | 0 (0.0%) |
| High School Diploma | 0 (0.0%) | 0 (0.0%) |
| College or Associate's Degree | 27 (38.6%) | 43 (61.4%) |
| Bachelor's Degree | 104 (100.0%) | 0 (0.0%) |
| Graduate Degree | 8 (100.0%) | 0 (0.0%) |
| Total | 139 (76.4%) | 43 (23.6%) |
Employment Characteristics in Maplewood
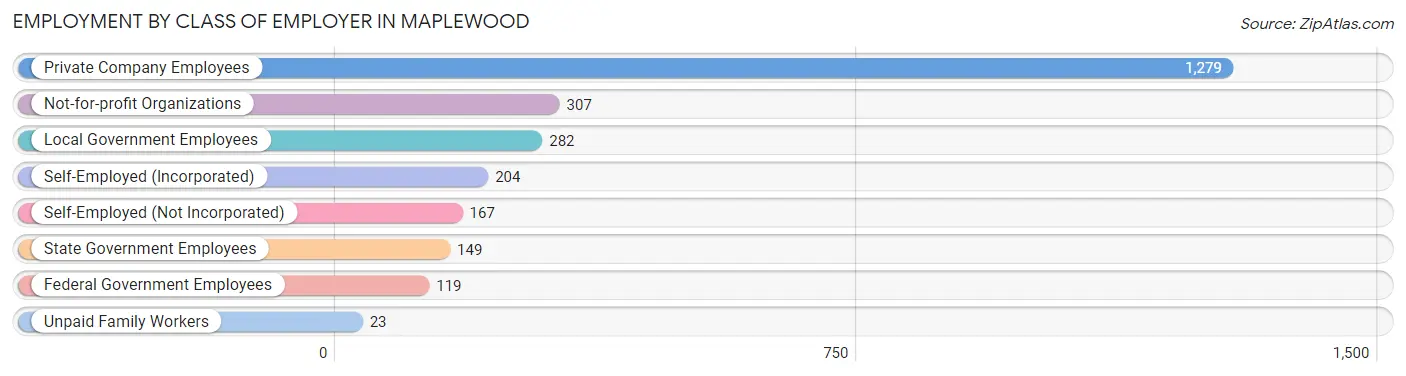
Employment by Class of Employer in Maplewood
Among the 2,530 employed individuals in Maplewood, private company employees (1,279 | 50.5%), not-for-profit organizations (307 | 12.1%), and local government employees (282 | 11.2%) make up the most common classes of employment.
| Employer Class | # Employees | % Employees |
| Private Company Employees | 1,279 | 50.5% |
| Self-Employed (Incorporated) | 204 | 8.1% |
| Self-Employed (Not Incorporated) | 167 | 6.6% |
| Not-for-profit Organizations | 307 | 12.1% |
| Local Government Employees | 282 | 11.2% |
| State Government Employees | 149 | 5.9% |
| Federal Government Employees | 119 | 4.7% |
| Unpaid Family Workers | 23 | 0.9% |
| Total | 2,530 | 100.0% |
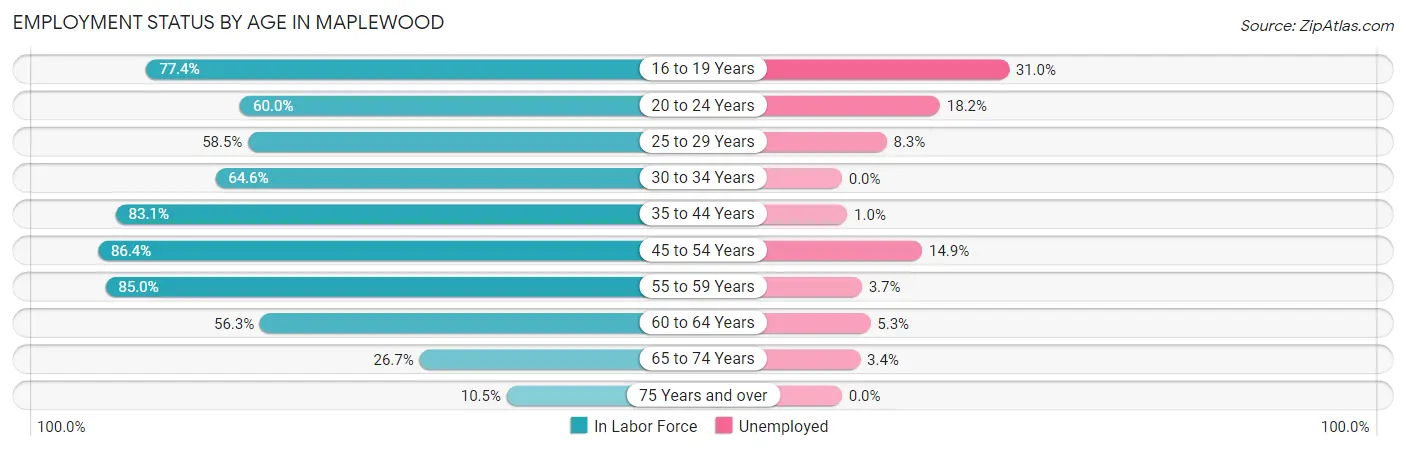
Employment Status by Age in Maplewood
According to the labor force statistics for Maplewood, out of the total population over 16 years of age (4,536), 60.4% or 2,740 individuals are in the labor force, with 7.7% or 211 of them unemployed. The age group with the highest labor force participation rate is 45 to 54 years, with 86.4% or 686 individuals in the labor force. Within the labor force, the 16 to 19 years age range has the highest percentage of unemployed individuals, with 31.0% or 35 of them being unemployed.
| Age Bracket | In Labor Force | Unemployed |
| 16 to 19 Years | 113 (77.4%) | 35 (31.0%) |
| 20 to 24 Years | 99 (60.0%) | 18 (18.2%) |
| 25 to 29 Years | 144 (58.5%) | 12 (8.3%) |
| 30 to 34 Years | 175 (64.6%) | 0 (0.0%) |
| 35 to 44 Years | 599 (83.1%) | 6 (1.0%) |
| 45 to 54 Years | 686 (86.4%) | 102 (14.9%) |
| 55 to 59 Years | 295 (85.0%) | 11 (3.7%) |
| 60 to 64 Years | 360 (56.3%) | 19 (5.3%) |
| 65 to 74 Years | 236 (26.7%) | 8 (3.4%) |
| 75 Years and over | 34 (10.5%) | 0 (0.0%) |
| Total | 2,740 (60.4%) | 211 (7.7%) |
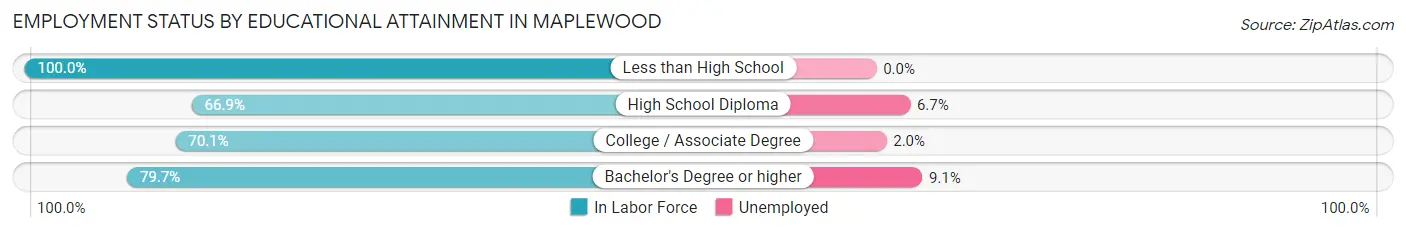
Employment Status by Educational Attainment in Maplewood
According to labor force statistics for Maplewood, 74.9% of individuals (2,260) out of the total population between 25 and 64 years of age (3,018) are in the labor force, with 6.6% or 149 of them being unemployed. The group with the highest labor force participation rate are those with the educational attainment of less than high school, with 100.0% or 3 individuals in the labor force. Within the labor force, individuals with bachelor's degree or higher education have the highest percentage of unemployment, with 9.1% or 118 of them being unemployed.
| Educational Attainment | In Labor Force | Unemployed |
| Less than High School | 3 (100.0%) | 0 (0.0%) |
| High School Diploma | 269 (66.9%) | 27 (6.7%) |
| College / Associate Degree | 695 (70.1%) | 20 (2.0%) |
| Bachelor's Degree or higher | 1,292 (79.7%) | 148 (9.1%) |
| Total | 2,260 (74.9%) | 199 (6.6%) |
Employment Occupations by Sex in Maplewood
Management, Business, Science and Arts Occupations
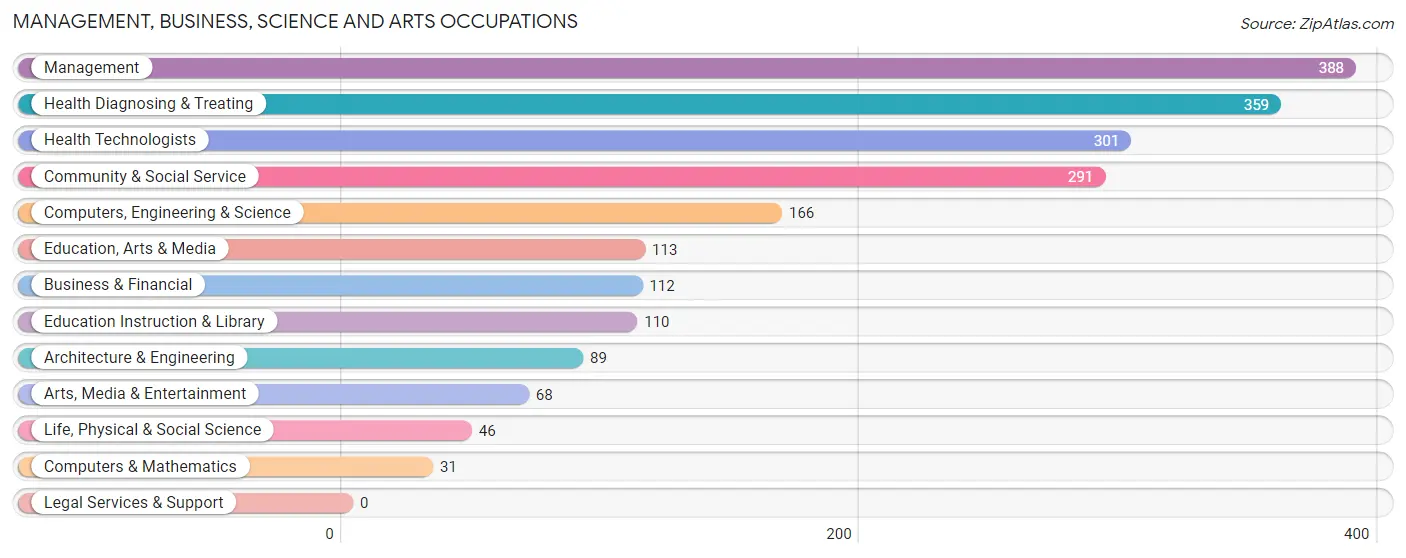
The most common Management, Business, Science and Arts occupations in Maplewood are Management (388 | 15.3%), Health Diagnosing & Treating (359 | 14.2%), Health Technologists (301 | 11.9%), Community & Social Service (291 | 11.5%), and Computers, Engineering & Science (166 | 6.6%).
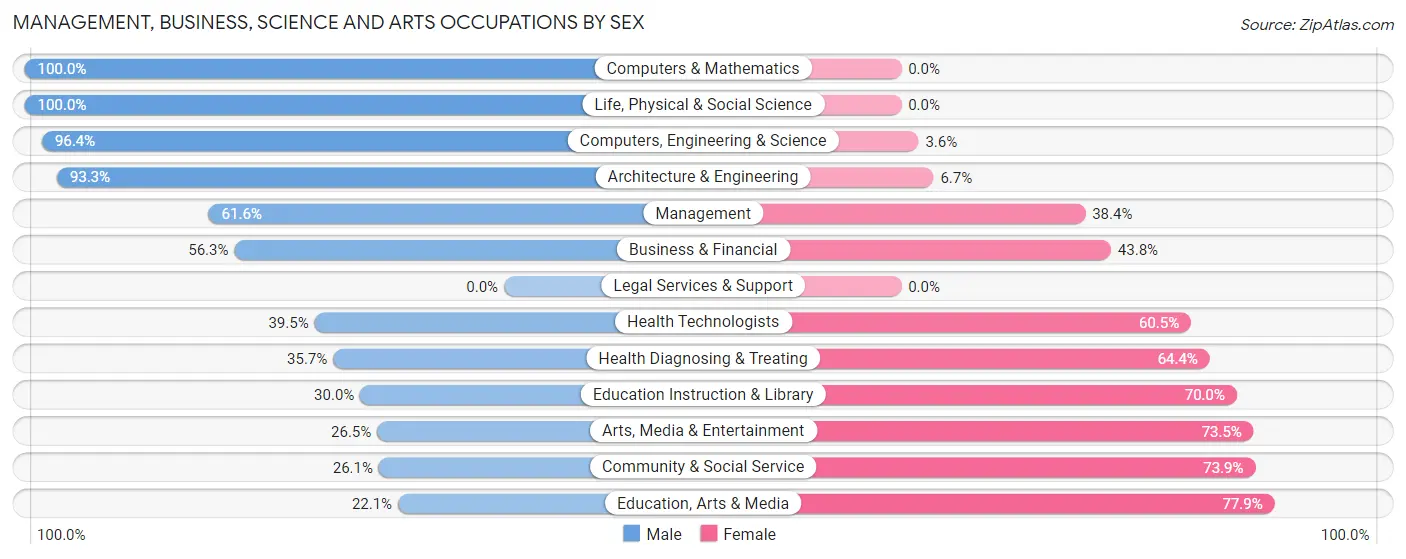
Management, Business, Science and Arts Occupations by Sex
Within the Management, Business, Science and Arts occupations in Maplewood, the most male-oriented occupations are Computers & Mathematics (100.0%), Life, Physical & Social Science (100.0%), and Computers, Engineering & Science (96.4%), while the most female-oriented occupations are Education, Arts & Media (77.9%), Community & Social Service (73.9%), and Arts, Media & Entertainment (73.5%).
| Occupation | Male | Female |
| Management | 239 (61.6%) | 149 (38.4%) |
| Business & Financial | 63 (56.2%) | 49 (43.8%) |
| Computers, Engineering & Science | 160 (96.4%) | 6 (3.6%) |
| Computers & Mathematics | 31 (100.0%) | 0 (0.0%) |
| Architecture & Engineering | 83 (93.3%) | 6 (6.7%) |
| Life, Physical & Social Science | 46 (100.0%) | 0 (0.0%) |
| Community & Social Service | 76 (26.1%) | 215 (73.9%) |
| Education, Arts & Media | 25 (22.1%) | 88 (77.9%) |
| Legal Services & Support | 0 (0.0%) | 0 (0.0%) |
| Education Instruction & Library | 33 (30.0%) | 77 (70.0%) |
| Arts, Media & Entertainment | 18 (26.5%) | 50 (73.5%) |
| Health Diagnosing & Treating | 128 (35.6%) | 231 (64.3%) |
| Health Technologists | 119 (39.5%) | 182 (60.5%) |
| Total (Category) | 666 (50.6%) | 650 (49.4%) |
| Total (Overall) | 1,334 (52.7%) | 1,196 (47.3%) |
Services Occupations
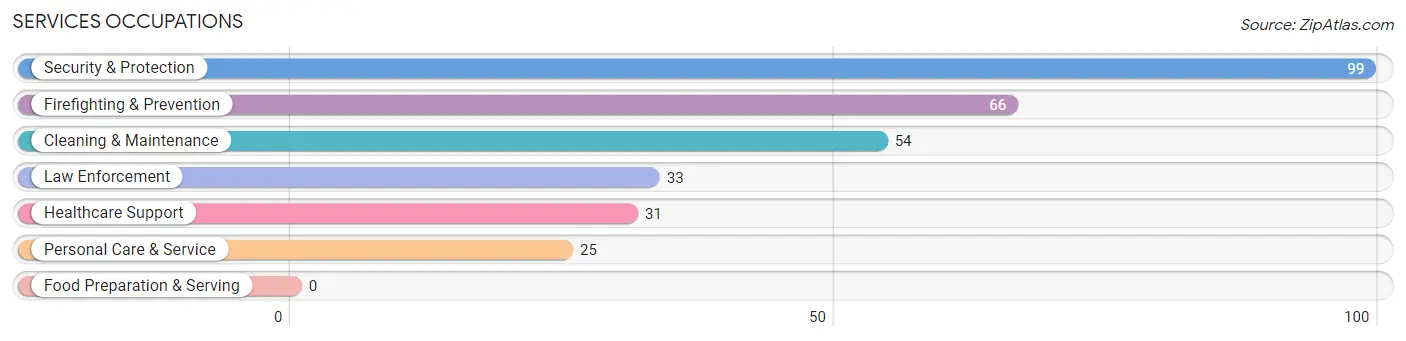
The most common Services occupations in Maplewood are Security & Protection (99 | 3.9%), Firefighting & Prevention (66 | 2.6%), Cleaning & Maintenance (54 | 2.1%), Law Enforcement (33 | 1.3%), and Healthcare Support (31 | 1.2%).
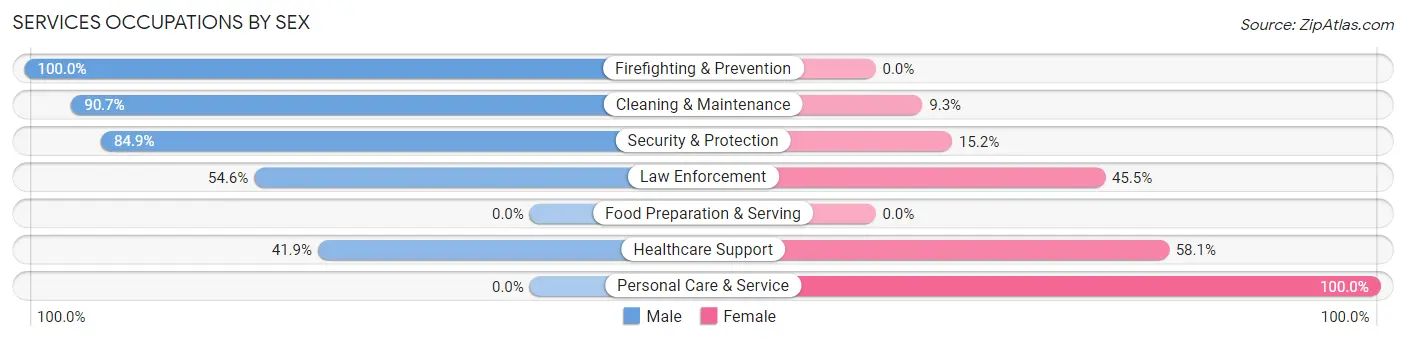
Services Occupations by Sex
Within the Services occupations in Maplewood, the most male-oriented occupations are Firefighting & Prevention (100.0%), Cleaning & Maintenance (90.7%), and Security & Protection (84.9%), while the most female-oriented occupations are Personal Care & Service (100.0%), Healthcare Support (58.1%), and Law Enforcement (45.5%).
| Occupation | Male | Female |
| Healthcare Support | 13 (41.9%) | 18 (58.1%) |
| Security & Protection | 84 (84.9%) | 15 (15.1%) |
| Firefighting & Prevention | 66 (100.0%) | 0 (0.0%) |
| Law Enforcement | 18 (54.5%) | 15 (45.5%) |
| Food Preparation & Serving | 0 (0.0%) | 0 (0.0%) |
| Cleaning & Maintenance | 49 (90.7%) | 5 (9.3%) |
| Personal Care & Service | 0 (0.0%) | 25 (100.0%) |
| Total (Category) | 146 (69.9%) | 63 (30.1%) |
| Total (Overall) | 1,334 (52.7%) | 1,196 (47.3%) |
Sales and Office Occupations
The most common Sales and Office occupations in Maplewood are Sales & Related (293 | 11.6%), and Office & Administration (229 | 9.0%).
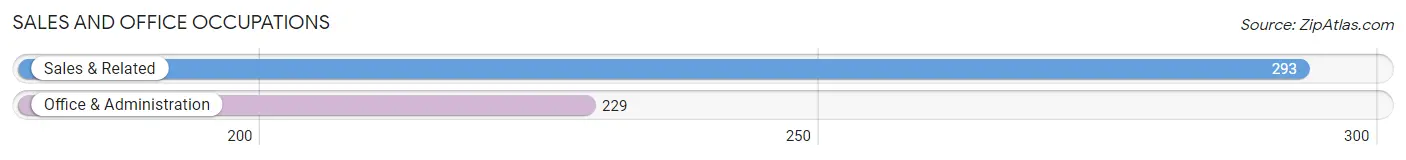
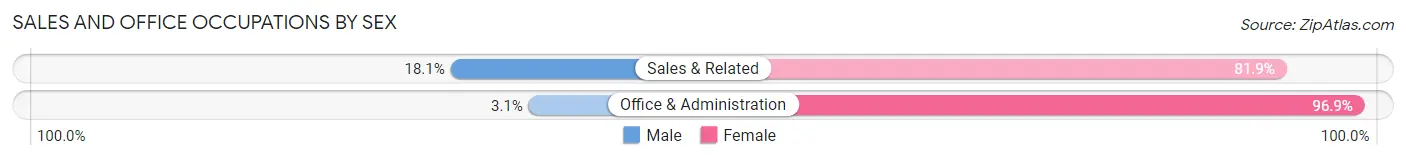
Sales and Office Occupations by Sex
| Occupation | Male | Female |
| Sales & Related | 53 (18.1%) | 240 (81.9%) |
| Office & Administration | 7 (3.1%) | 222 (96.9%) |
| Total (Category) | 60 (11.5%) | 462 (88.5%) |
| Total (Overall) | 1,334 (52.7%) | 1,196 (47.3%) |
Natural Resources, Construction and Maintenance Occupations
The most common Natural Resources, Construction and Maintenance occupations in Maplewood are Construction & Extraction (140 | 5.5%), and Installation, Maintenance & Repair (75 | 3.0%).
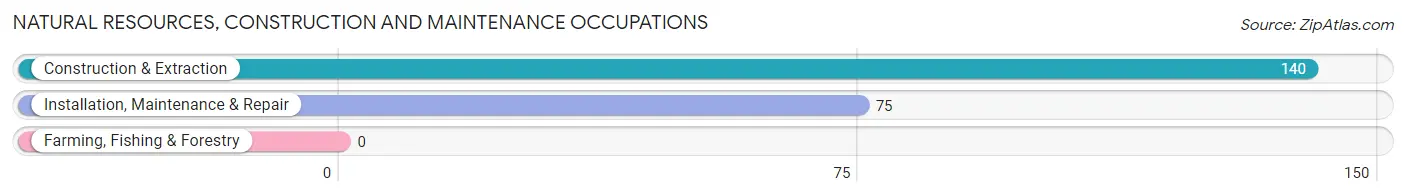
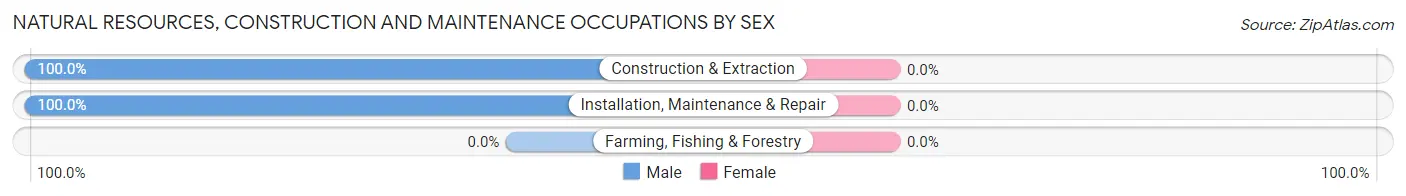
Natural Resources, Construction and Maintenance Occupations by Sex
| Occupation | Male | Female |
| Farming, Fishing & Forestry | 0 (0.0%) | 0 (0.0%) |
| Construction & Extraction | 140 (100.0%) | 0 (0.0%) |
| Installation, Maintenance & Repair | 75 (100.0%) | 0 (0.0%) |
| Total (Category) | 215 (100.0%) | 0 (0.0%) |
| Total (Overall) | 1,334 (52.7%) | 1,196 (47.3%) |
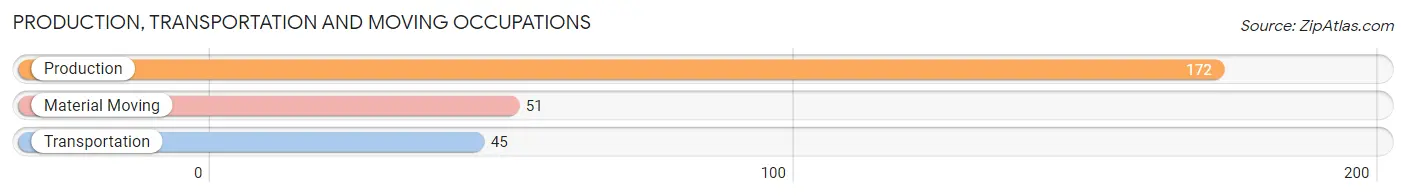
Production, Transportation and Moving Occupations
The most common Production, Transportation and Moving occupations in Maplewood are Production (172 | 6.8%), Material Moving (51 | 2.0%), and Transportation (45 | 1.8%).
Production, Transportation and Moving Occupations by Sex
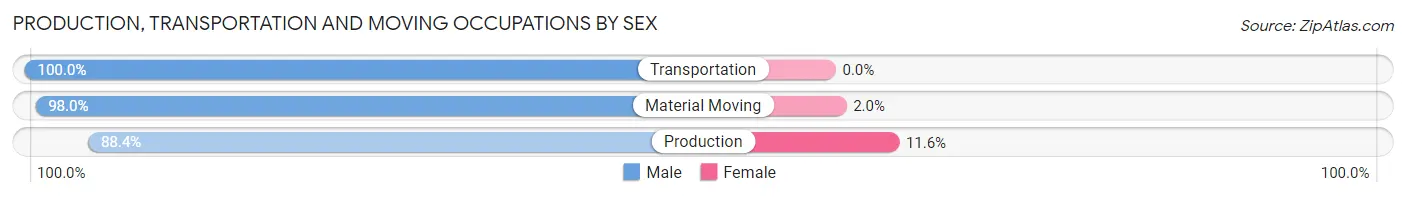
| Occupation | Male | Female |
| Production | 152 (88.4%) | 20 (11.6%) |
| Transportation | 45 (100.0%) | 0 (0.0%) |
| Material Moving | 50 (98.0%) | 1 (2.0%) |
| Total (Category) | 247 (92.2%) | 21 (7.8%) |
| Total (Overall) | 1,334 (52.7%) | 1,196 (47.3%) |
Employment Industries by Sex in Maplewood
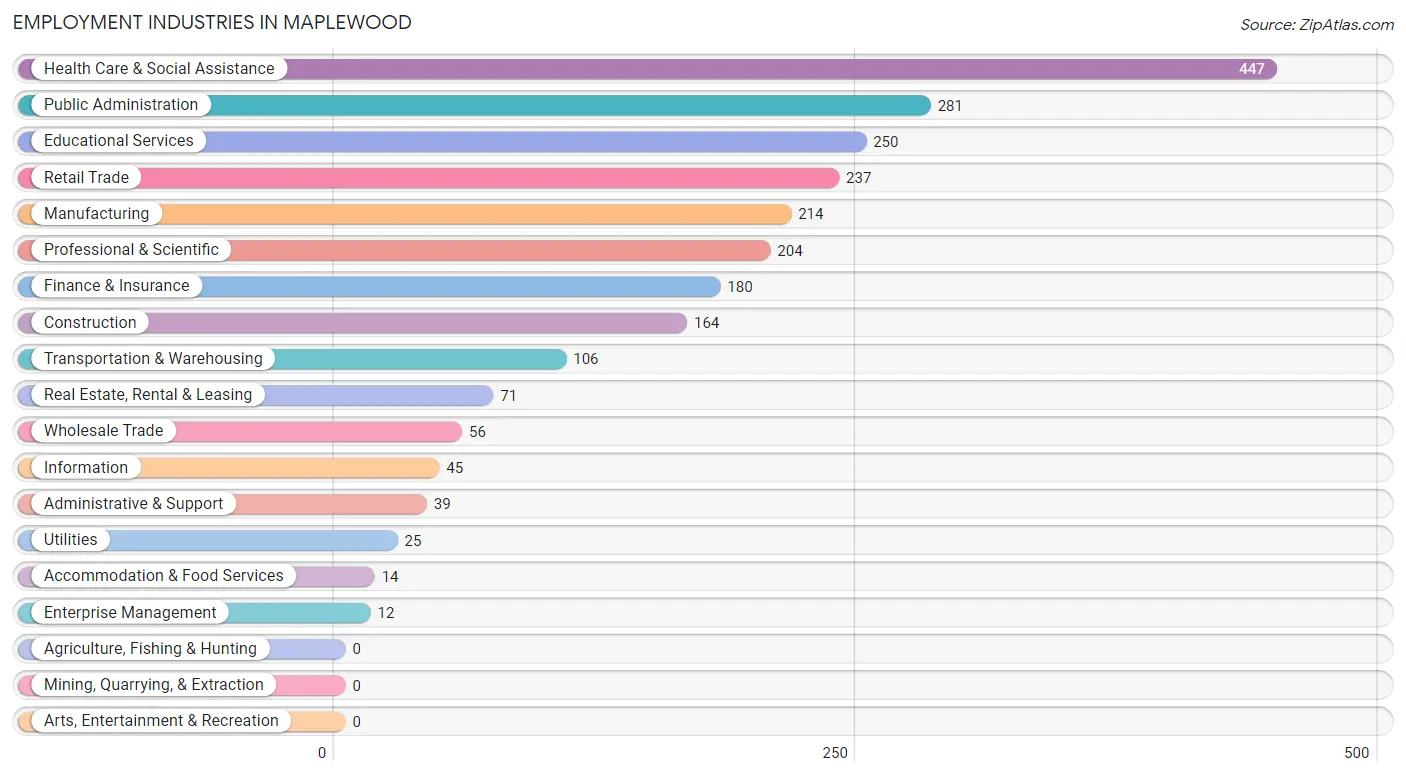
Employment Industries in Maplewood
The major employment industries in Maplewood include Health Care & Social Assistance (447 | 17.7%), Public Administration (281 | 11.1%), Educational Services (250 | 9.9%), Retail Trade (237 | 9.4%), and Manufacturing (214 | 8.5%).
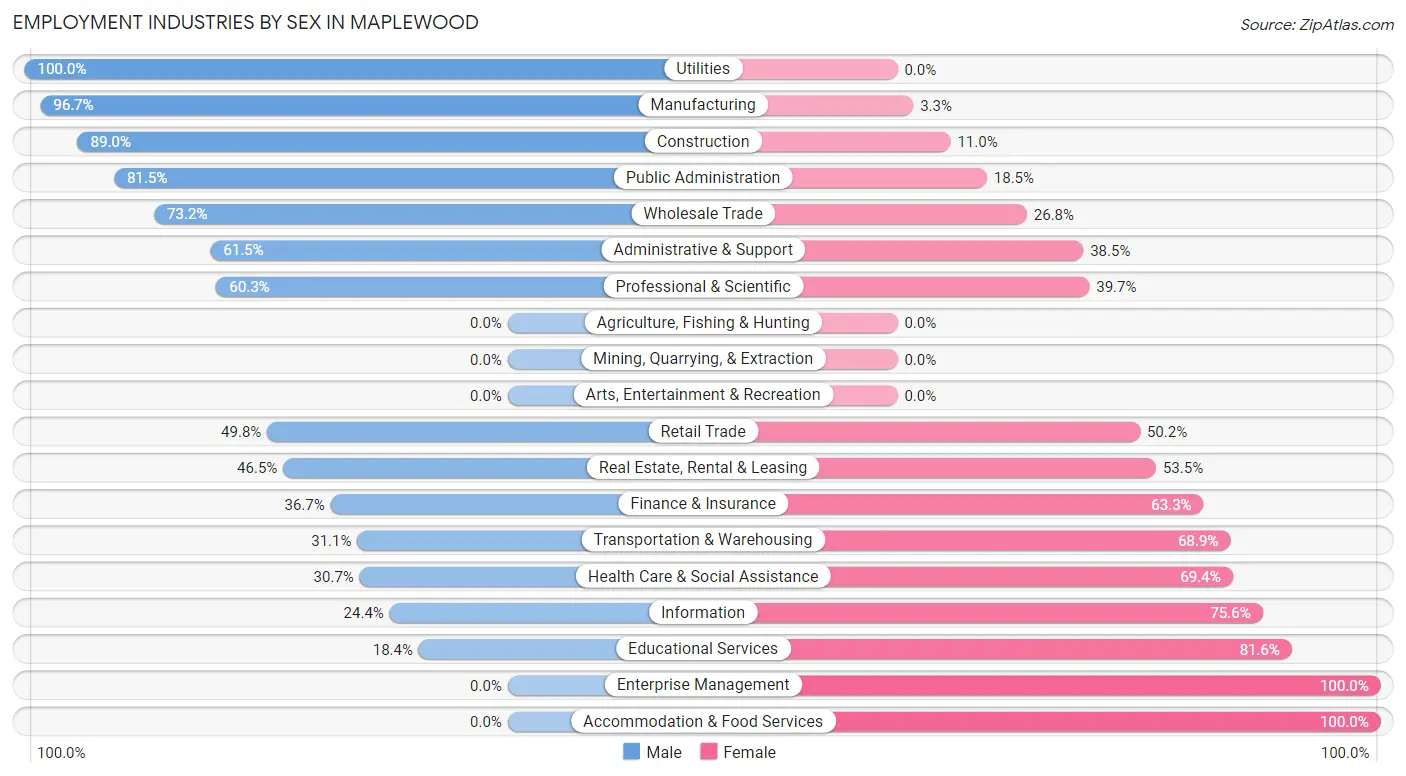
Employment Industries by Sex in Maplewood
The Maplewood industries that see more men than women are Utilities (100.0%), Manufacturing (96.7%), and Construction (89.0%), whereas the industries that tend to have a higher number of women are Enterprise Management (100.0%), Accommodation & Food Services (100.0%), and Educational Services (81.6%).
| Industry | Male | Female |
| Agriculture, Fishing & Hunting | 0 (0.0%) | 0 (0.0%) |
| Mining, Quarrying, & Extraction | 0 (0.0%) | 0 (0.0%) |
| Construction | 146 (89.0%) | 18 (11.0%) |
| Manufacturing | 207 (96.7%) | 7 (3.3%) |
| Wholesale Trade | 41 (73.2%) | 15 (26.8%) |
| Retail Trade | 118 (49.8%) | 119 (50.2%) |
| Transportation & Warehousing | 33 (31.1%) | 73 (68.9%) |
| Utilities | 25 (100.0%) | 0 (0.0%) |
| Information | 11 (24.4%) | 34 (75.6%) |
| Finance & Insurance | 66 (36.7%) | 114 (63.3%) |
| Real Estate, Rental & Leasing | 33 (46.5%) | 38 (53.5%) |
| Professional & Scientific | 123 (60.3%) | 81 (39.7%) |
| Enterprise Management | 0 (0.0%) | 12 (100.0%) |
| Administrative & Support | 24 (61.5%) | 15 (38.5%) |
| Educational Services | 46 (18.4%) | 204 (81.6%) |
| Health Care & Social Assistance | 137 (30.6%) | 310 (69.4%) |
| Arts, Entertainment & Recreation | 0 (0.0%) | 0 (0.0%) |
| Accommodation & Food Services | 0 (0.0%) | 14 (100.0%) |
| Public Administration | 229 (81.5%) | 52 (18.5%) |
| Total | 1,334 (52.7%) | 1,196 (47.3%) |
Education in Maplewood
School Enrollment in Maplewood
The most common levels of schooling among the 761 students in Maplewood are college / undergraduate (215 | 28.2%), elementary school (158 | 20.8%), and high school (141 | 18.5%).
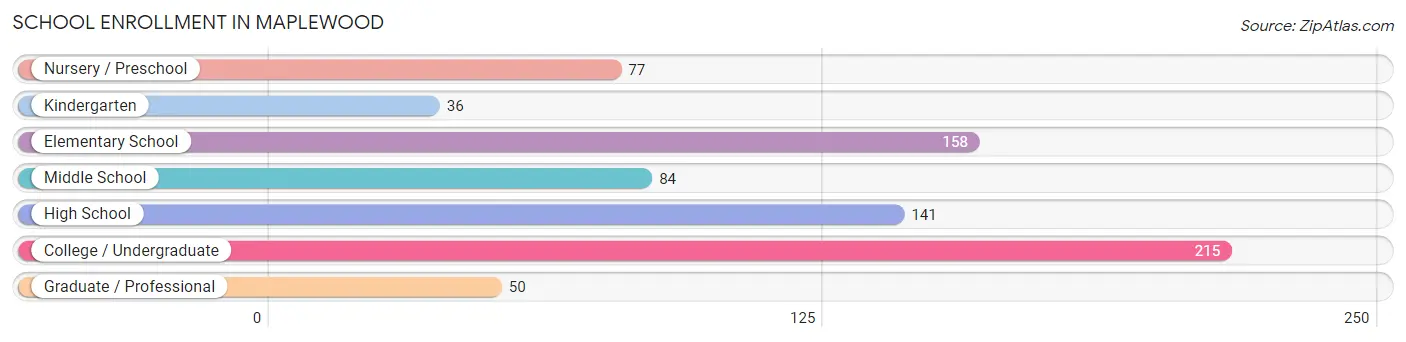
| School Level | # Students | % Students |
| Nursery / Preschool | 77 | 10.1% |
| Kindergarten | 36 | 4.7% |
| Elementary School | 158 | 20.8% |
| Middle School | 84 | 11.0% |
| High School | 141 | 18.5% |
| College / Undergraduate | 215 | 28.2% |
| Graduate / Professional | 50 | 6.6% |
| Total | 761 | 100.0% |
School Enrollment by Age by Funding Source in Maplewood
Out of a total of 761 students who are enrolled in schools in Maplewood, 128 (16.8%) attend a private institution, while the remaining 633 (83.2%) are enrolled in public schools. The age group of 3 to 4 year olds has the highest likelihood of being enrolled in private schools, with 27 (57.5% in the age bracket) enrolled. Conversely, the age group of 15 to 17 year olds has the lowest likelihood of being enrolled in a private school, with 75 (100.0% in the age bracket) attending a public institution.
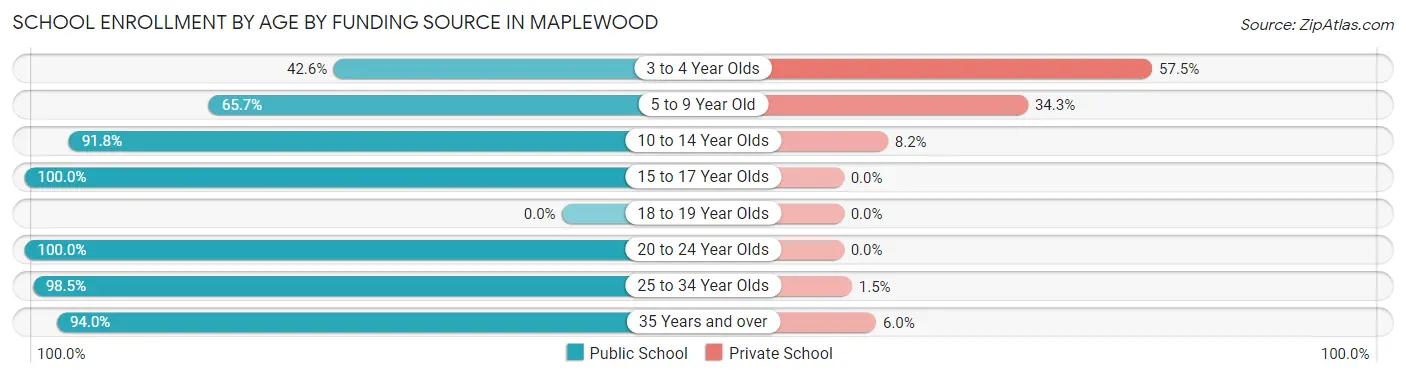
| Age Bracket | Public School | Private School |
| 3 to 4 Year Olds | 20 (42.5%) | 27 (57.5%) |
| 5 to 9 Year Old | 153 (65.7%) | 80 (34.3%) |
| 10 to 14 Year Olds | 145 (91.8%) | 13 (8.2%) |
| 15 to 17 Year Olds | 75 (100.0%) | 0 (0.0%) |
| 18 to 19 Year Olds | 0 (0.0%) | 0 (0.0%) |
| 20 to 24 Year Olds | 66 (100.0%) | 0 (0.0%) |
| 25 to 34 Year Olds | 65 (98.5%) | 1 (1.5%) |
| 35 Years and over | 109 (94.0%) | 7 (6.0%) |
| Total | 633 (83.2%) | 128 (16.8%) |
Educational Attainment by Field of Study in Maplewood
Science & technology (332 | 13.7%), business (315 | 13.0%), education (282 | 11.6%), social sciences (269 | 11.1%), and engineering (262 | 10.8%) are the most common fields of study among 2,424 individuals in Maplewood who have obtained a bachelor's degree or higher.
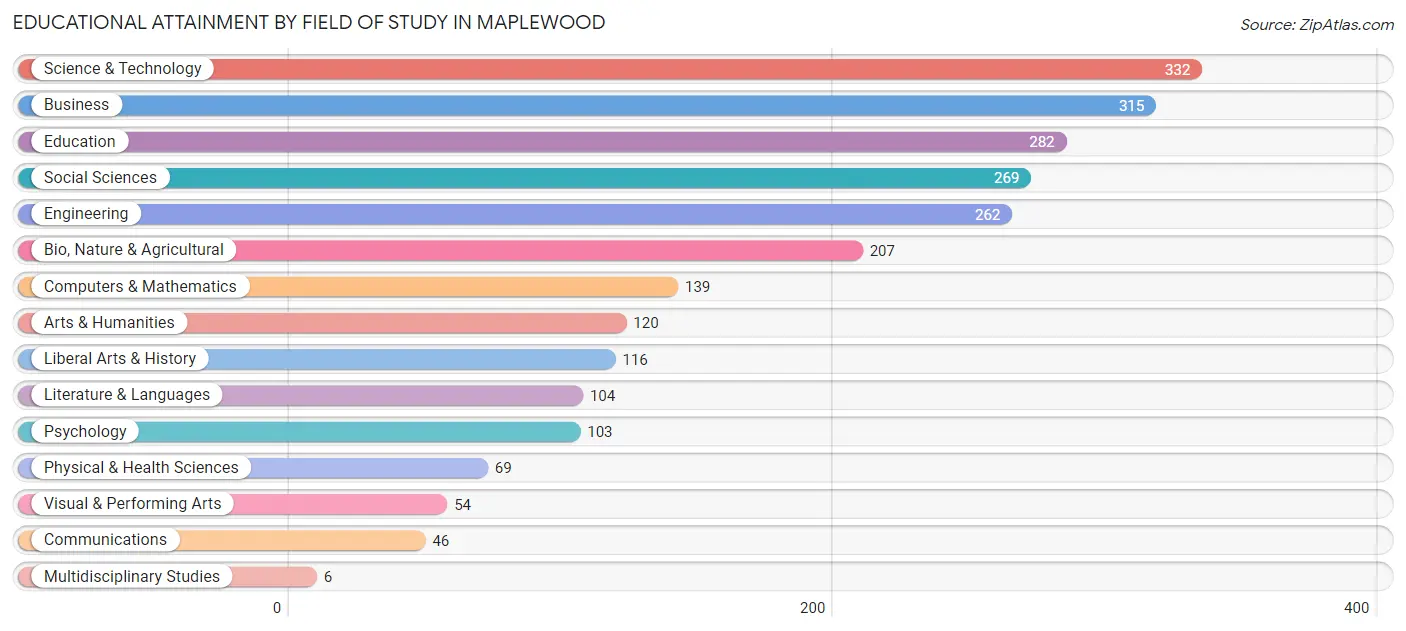
| Field of Study | # Graduates | % Graduates |
| Computers & Mathematics | 139 | 5.7% |
| Bio, Nature & Agricultural | 207 | 8.5% |
| Physical & Health Sciences | 69 | 2.9% |
| Psychology | 103 | 4.3% |
| Social Sciences | 269 | 11.1% |
| Engineering | 262 | 10.8% |
| Multidisciplinary Studies | 6 | 0.3% |
| Science & Technology | 332 | 13.7% |
| Business | 315 | 13.0% |
| Education | 282 | 11.6% |
| Literature & Languages | 104 | 4.3% |
| Liberal Arts & History | 116 | 4.8% |
| Visual & Performing Arts | 54 | 2.2% |
| Communications | 46 | 1.9% |
| Arts & Humanities | 120 | 5.0% |
| Total | 2,424 | 100.0% |
Transportation & Commute in Maplewood
Vehicle Availability by Sex in Maplewood
The most prevalent vehicle ownership categories in Maplewood are males with 2 vehicles (638, accounting for 47.8%) and females with 2 vehicles (542, making up 53.7%).
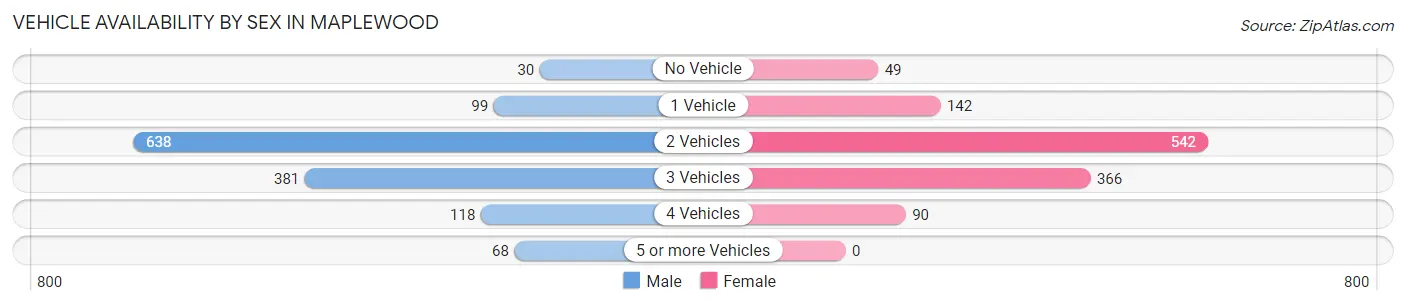
| Vehicles Available | Male | Female |
| No Vehicle | 30 (2.2%) | 49 (4.1%) |
| 1 Vehicle | 99 (7.4%) | 142 (11.9%) |
| 2 Vehicles | 638 (47.8%) | 542 (45.6%) |
| 3 Vehicles | 381 (28.6%) | 366 (30.8%) |
| 4 Vehicles | 118 (8.8%) | 90 (7.6%) |
| 5 or more Vehicles | 68 (5.1%) | 0 (0.0%) |
| Total | 1,334 (100.0%) | 1,189 (100.0%) |
Commute Time in Maplewood
The most frequently occuring commute durations in Maplewood are 30 to 34 minutes (439 commuters, 21.9%), 45 to 59 minutes (315 commuters, 15.7%), and 5 to 9 minutes (209 commuters, 10.4%).
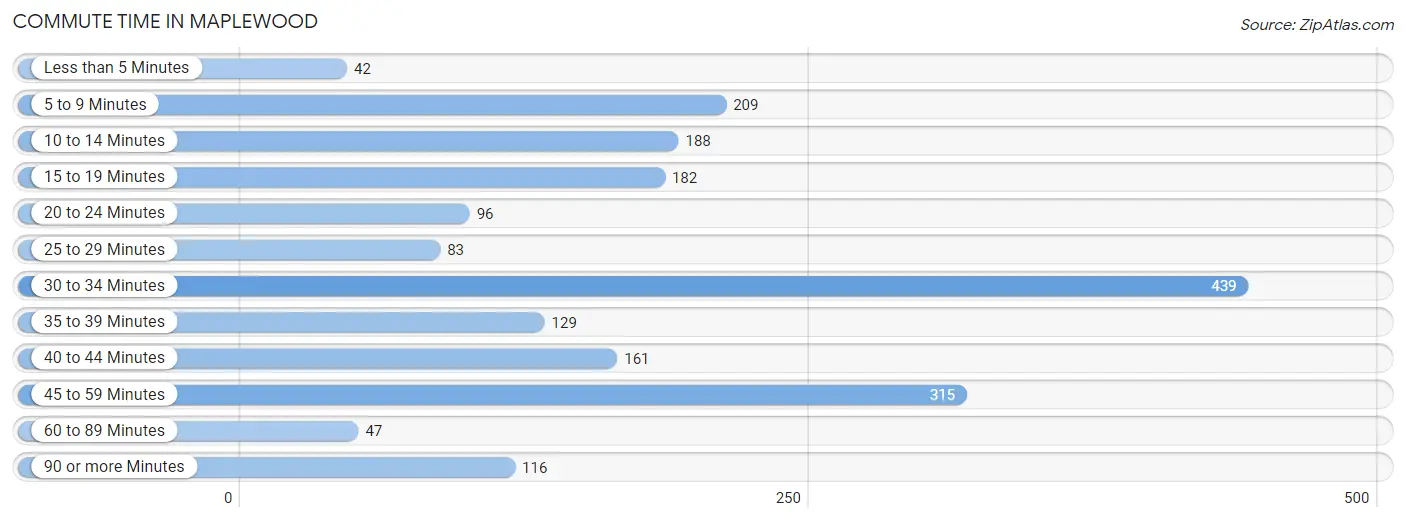
| Commute Time | # Commuters | % Commuters |
| Less than 5 Minutes | 42 | 2.1% |
| 5 to 9 Minutes | 209 | 10.4% |
| 10 to 14 Minutes | 188 | 9.4% |
| 15 to 19 Minutes | 182 | 9.1% |
| 20 to 24 Minutes | 96 | 4.8% |
| 25 to 29 Minutes | 83 | 4.1% |
| 30 to 34 Minutes | 439 | 21.9% |
| 35 to 39 Minutes | 129 | 6.4% |
| 40 to 44 Minutes | 161 | 8.0% |
| 45 to 59 Minutes | 315 | 15.7% |
| 60 to 89 Minutes | 47 | 2.3% |
| 90 or more Minutes | 116 | 5.8% |
Commute Time by Sex in Maplewood
The most common commute times in Maplewood are 45 to 59 minutes (219 commuters, 20.7%) for males and 30 to 34 minutes (242 commuters, 25.5%) for females.
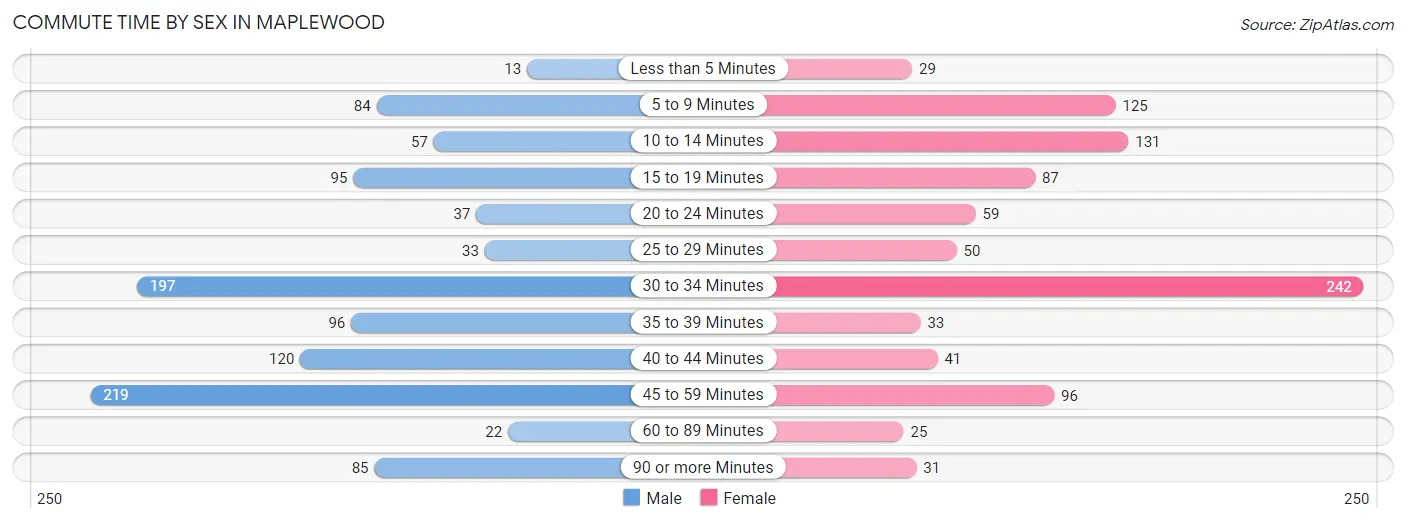
| Commute Time | Male | Female |
| Less than 5 Minutes | 13 (1.2%) | 29 (3.1%) |
| 5 to 9 Minutes | 84 (7.9%) | 125 (13.2%) |
| 10 to 14 Minutes | 57 (5.4%) | 131 (13.8%) |
| 15 to 19 Minutes | 95 (9.0%) | 87 (9.2%) |
| 20 to 24 Minutes | 37 (3.5%) | 59 (6.2%) |
| 25 to 29 Minutes | 33 (3.1%) | 50 (5.3%) |
| 30 to 34 Minutes | 197 (18.6%) | 242 (25.5%) |
| 35 to 39 Minutes | 96 (9.1%) | 33 (3.5%) |
| 40 to 44 Minutes | 120 (11.3%) | 41 (4.3%) |
| 45 to 59 Minutes | 219 (20.7%) | 96 (10.1%) |
| 60 to 89 Minutes | 22 (2.1%) | 25 (2.6%) |
| 90 or more Minutes | 85 (8.0%) | 31 (3.3%) |
Time of Departure to Work by Sex in Maplewood
The most frequent times of departure to work in Maplewood are 7:00 AM to 7:29 AM (192, 18.1%) for males and 6:00 AM to 6:29 AM (159, 16.8%) for females.
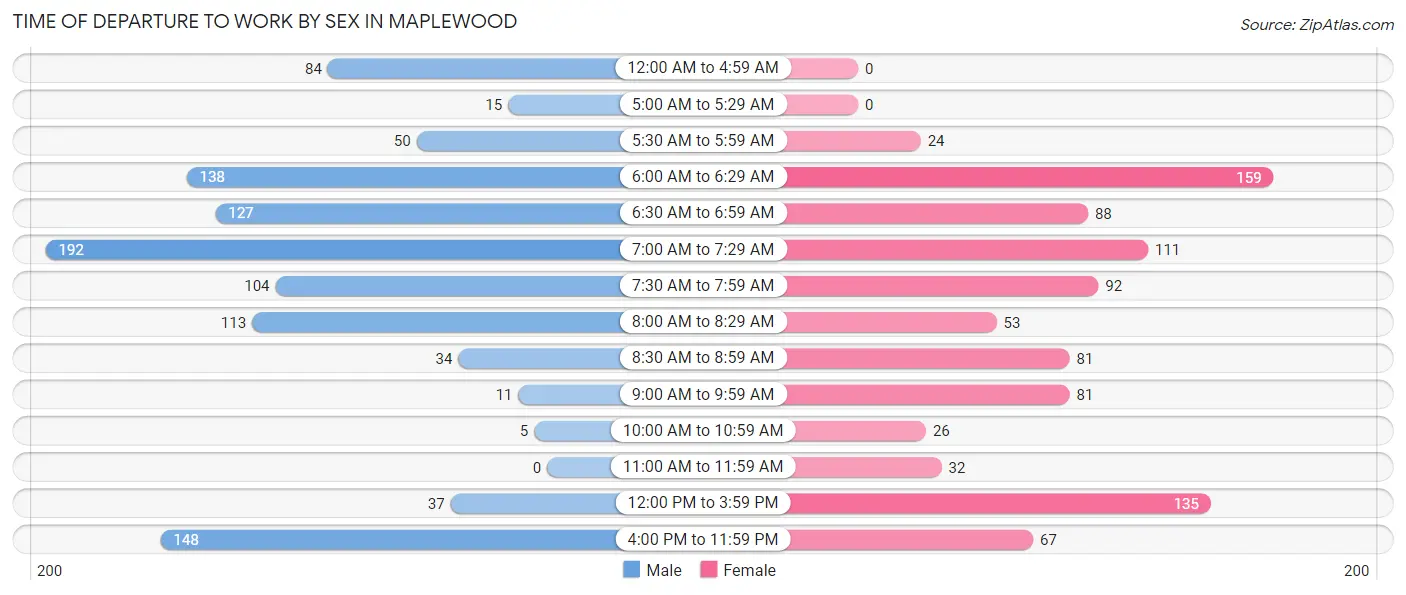
| Time of Departure | Male | Female |
| 12:00 AM to 4:59 AM | 84 (7.9%) | 0 (0.0%) |
| 5:00 AM to 5:29 AM | 15 (1.4%) | 0 (0.0%) |
| 5:30 AM to 5:59 AM | 50 (4.7%) | 24 (2.5%) |
| 6:00 AM to 6:29 AM | 138 (13.0%) | 159 (16.8%) |
| 6:30 AM to 6:59 AM | 127 (12.0%) | 88 (9.3%) |
| 7:00 AM to 7:29 AM | 192 (18.1%) | 111 (11.7%) |
| 7:30 AM to 7:59 AM | 104 (9.8%) | 92 (9.7%) |
| 8:00 AM to 8:29 AM | 113 (10.7%) | 53 (5.6%) |
| 8:30 AM to 8:59 AM | 34 (3.2%) | 81 (8.5%) |
| 9:00 AM to 9:59 AM | 11 (1.0%) | 81 (8.5%) |
| 10:00 AM to 10:59 AM | 5 (0.5%) | 26 (2.7%) |
| 11:00 AM to 11:59 AM | 0 (0.0%) | 32 (3.4%) |
| 12:00 PM to 3:59 PM | 37 (3.5%) | 135 (14.2%) |
| 4:00 PM to 11:59 PM | 148 (14.0%) | 67 (7.1%) |
| Total | 1,058 (100.0%) | 949 (100.0%) |
Housing Occupancy in Maplewood
Occupancy by Ownership in Maplewood
Of the total 2,199 dwellings in Maplewood, owner-occupied units account for 1,967 (89.4%), while renter-occupied units make up 232 (10.5%).
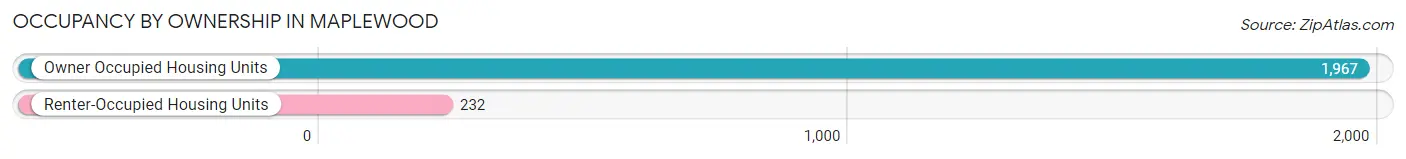
| Occupancy | # Housing Units | % Housing Units |
| Owner Occupied Housing Units | 1,967 | 89.4% |
| Renter-Occupied Housing Units | 232 | 10.5% |
| Total Occupied Housing Units | 2,199 | 100.0% |
Occupancy by Household Size in Maplewood
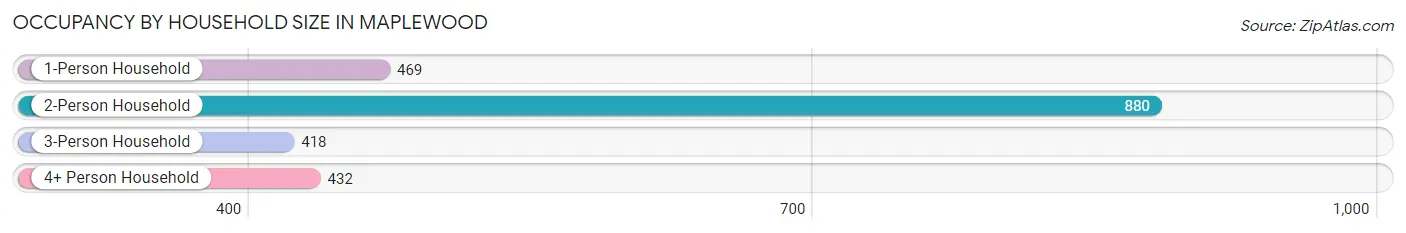
| Household Size | # Housing Units | % Housing Units |
| 1-Person Household | 469 | 21.3% |
| 2-Person Household | 880 | 40.0% |
| 3-Person Household | 418 | 19.0% |
| 4+ Person Household | 432 | 19.7% |
| Total Housing Units | 2,199 | 100.0% |
Occupancy by Ownership by Household Size in Maplewood
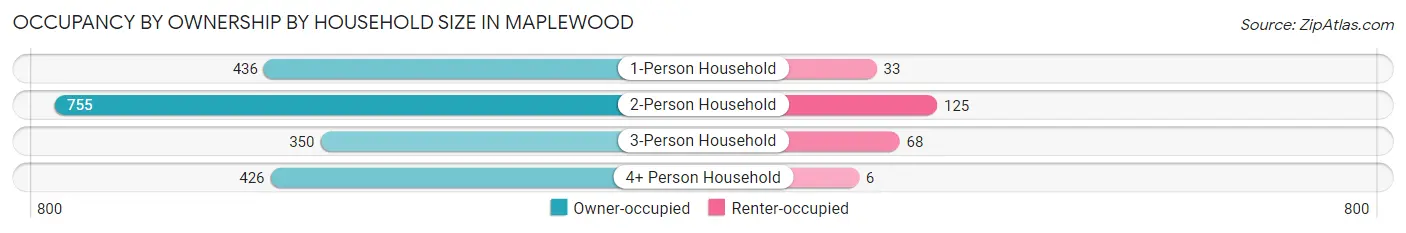
| Household Size | Owner-occupied | Renter-occupied |
| 1-Person Household | 436 (93.0%) | 33 (7.0%) |
| 2-Person Household | 755 (85.8%) | 125 (14.2%) |
| 3-Person Household | 350 (83.7%) | 68 (16.3%) |
| 4+ Person Household | 426 (98.6%) | 6 (1.4%) |
| Total Housing Units | 1,967 (89.4%) | 232 (10.5%) |
Occupancy by Educational Attainment in Maplewood
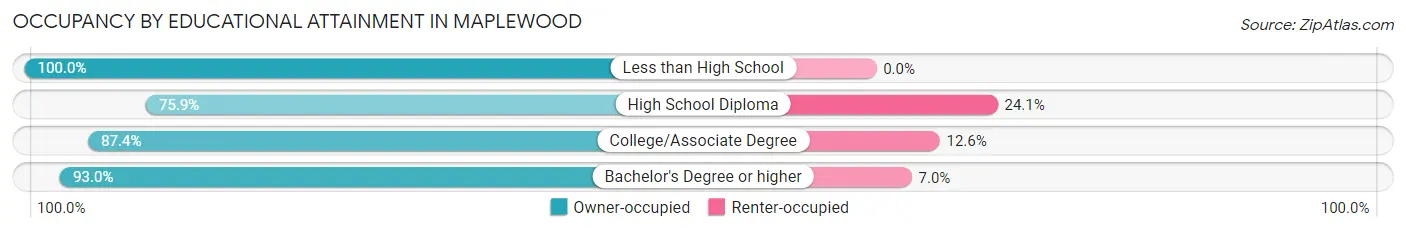
| Household Size | Owner-occupied | Renter-occupied |
| Less than High School | 14 (100.0%) | 0 (0.0%) |
| High School Diploma | 183 (75.9%) | 58 (24.1%) |
| College/Associate Degree | 591 (87.4%) | 85 (12.6%) |
| Bachelor's Degree or higher | 1,179 (93.0%) | 89 (7.0%) |
Occupancy by Age of Householder in Maplewood
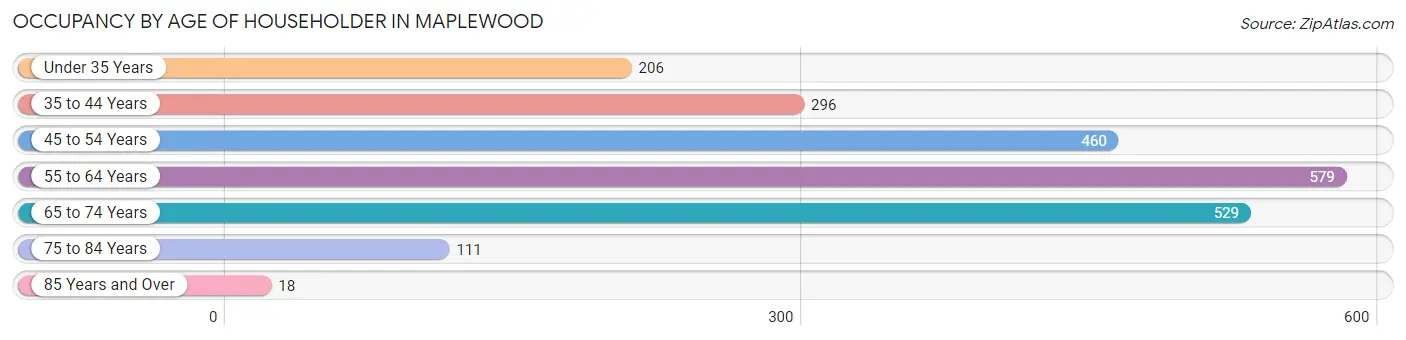
| Age Bracket | # Households | % Households |
| Under 35 Years | 206 | 9.4% |
| 35 to 44 Years | 296 | 13.5% |
| 45 to 54 Years | 460 | 20.9% |
| 55 to 64 Years | 579 | 26.3% |
| 65 to 74 Years | 529 | 24.1% |
| 75 to 84 Years | 111 | 5.1% |
| 85 Years and Over | 18 | 0.8% |
| Total | 2,199 | 100.0% |
Housing Finances in Maplewood
Median Income by Occupancy in Maplewood
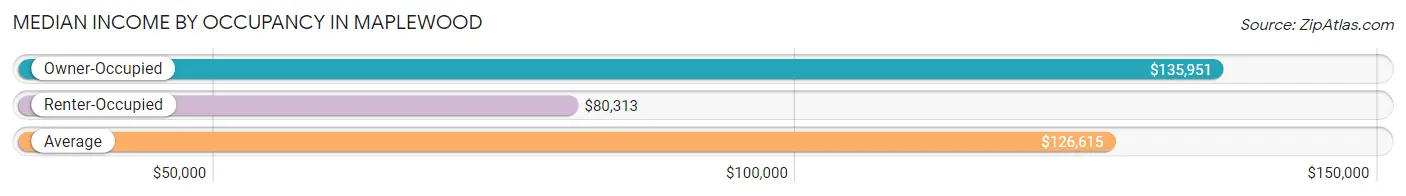
| Occupancy Type | # Households | Median Income |
| Owner-Occupied | 1,967 (89.4%) | $135,951 |
| Renter-Occupied | 232 (10.5%) | $80,313 |
| Average | 2,199 (100.0%) | $126,615 |
Occupancy by Householder Income Bracket in Maplewood
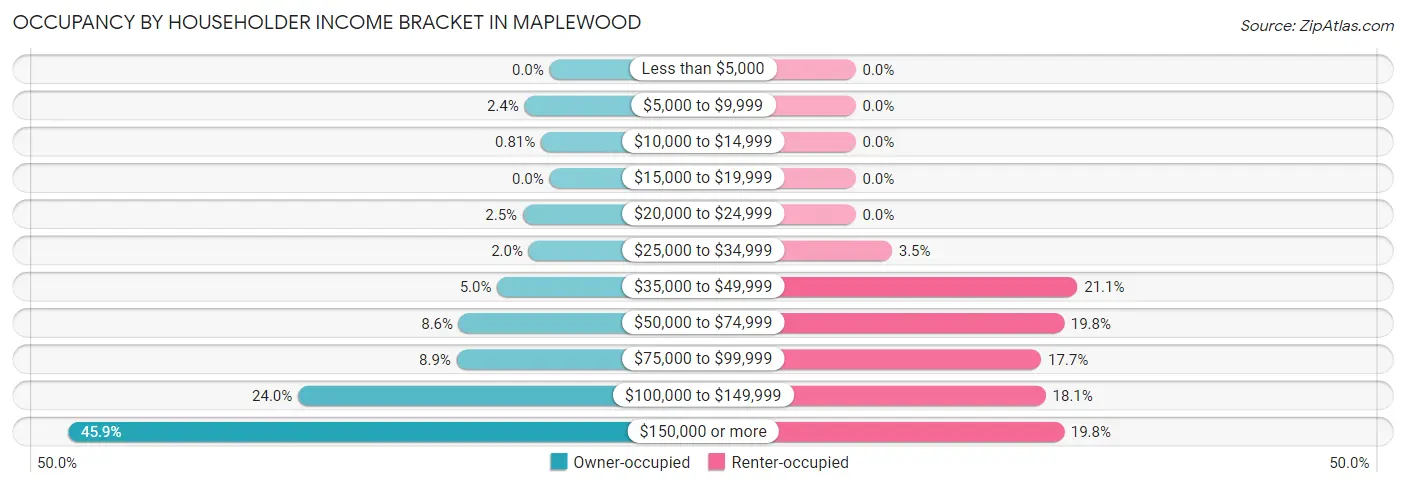
| Income Bracket | Owner-occupied | Renter-occupied |
| Less than $5,000 | 0 (0.0%) | 0 (0.0%) |
| $5,000 to $9,999 | 47 (2.4%) | 0 (0.0%) |
| $10,000 to $14,999 | 16 (0.8%) | 0 (0.0%) |
| $15,000 to $19,999 | 0 (0.0%) | 0 (0.0%) |
| $20,000 to $24,999 | 50 (2.5%) | 0 (0.0%) |
| $25,000 to $34,999 | 39 (2.0%) | 8 (3.5%) |
| $35,000 to $49,999 | 98 (5.0%) | 49 (21.1%) |
| $50,000 to $74,999 | 170 (8.6%) | 46 (19.8%) |
| $75,000 to $99,999 | 174 (8.8%) | 41 (17.7%) |
| $100,000 to $149,999 | 471 (23.9%) | 42 (18.1%) |
| $150,000 or more | 902 (45.9%) | 46 (19.8%) |
| Total | 1,967 (100.0%) | 232 (100.0%) |
Monthly Housing Cost Tiers in Maplewood
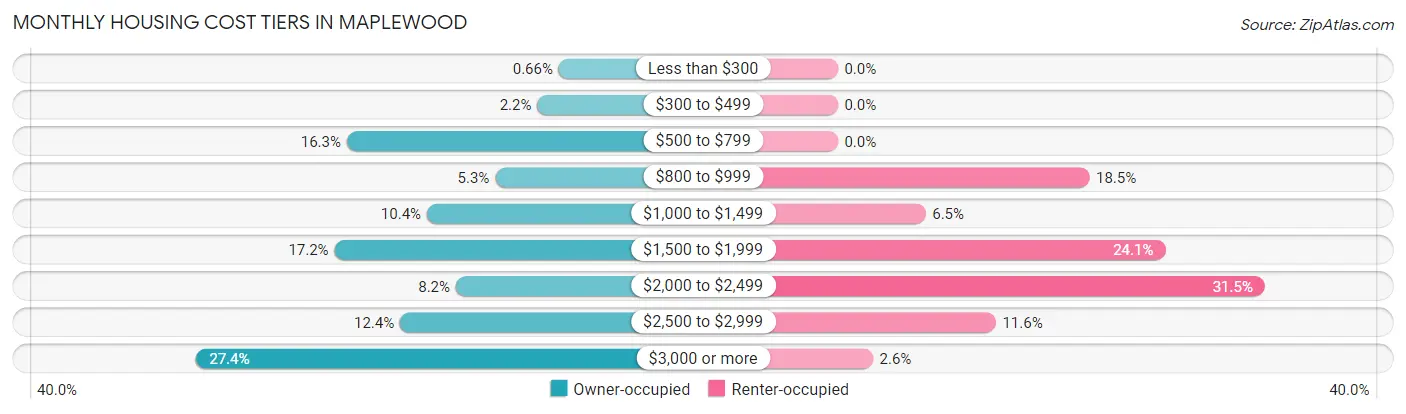
| Monthly Cost | Owner-occupied | Renter-occupied |
| Less than $300 | 13 (0.7%) | 0 (0.0%) |
| $300 to $499 | 44 (2.2%) | 0 (0.0%) |
| $500 to $799 | 320 (16.3%) | 0 (0.0%) |
| $800 to $999 | 105 (5.3%) | 43 (18.5%) |
| $1,000 to $1,499 | 204 (10.4%) | 15 (6.5%) |
| $1,500 to $1,999 | 338 (17.2%) | 56 (24.1%) |
| $2,000 to $2,499 | 162 (8.2%) | 73 (31.5%) |
| $2,500 to $2,999 | 243 (12.3%) | 27 (11.6%) |
| $3,000 or more | 538 (27.4%) | 6 (2.6%) |
| Total | 1,967 (100.0%) | 232 (100.0%) |
Physical Housing Characteristics in Maplewood
Housing Structures in Maplewood
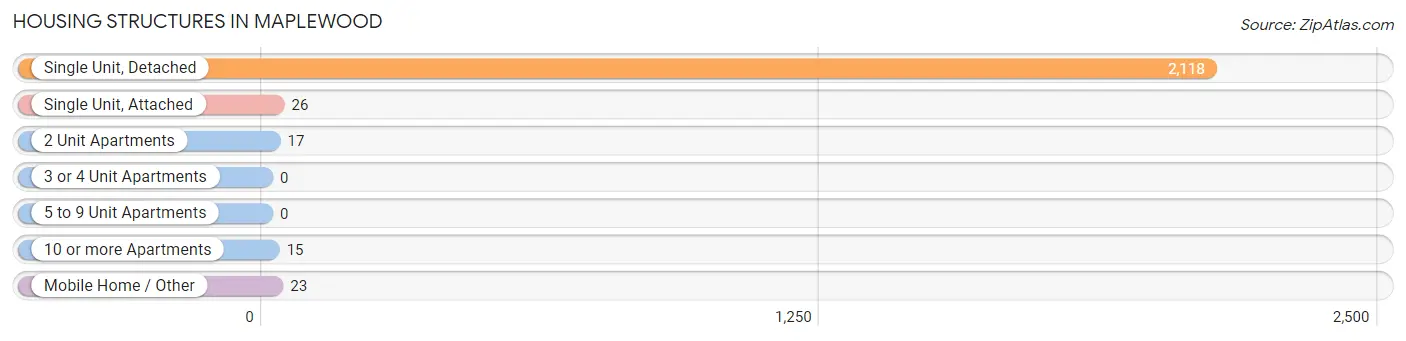
| Structure Type | # Housing Units | % Housing Units |
| Single Unit, Detached | 2,118 | 96.3% |
| Single Unit, Attached | 26 | 1.2% |
| 2 Unit Apartments | 17 | 0.8% |
| 3 or 4 Unit Apartments | 0 | 0.0% |
| 5 to 9 Unit Apartments | 0 | 0.0% |
| 10 or more Apartments | 15 | 0.7% |
| Mobile Home / Other | 23 | 1.1% |
| Total | 2,199 | 100.0% |
Housing Structures by Occupancy in Maplewood
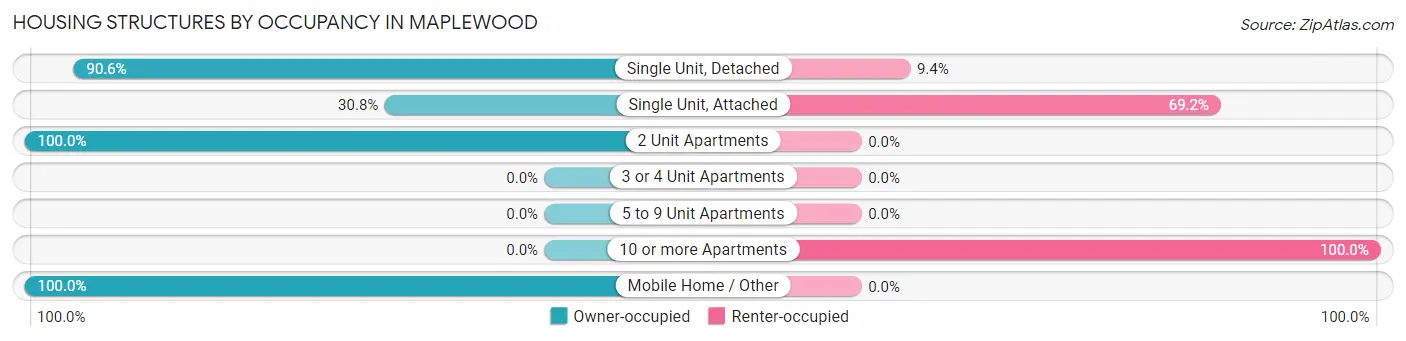
| Structure Type | Owner-occupied | Renter-occupied |
| Single Unit, Detached | 1,919 (90.6%) | 199 (9.4%) |
| Single Unit, Attached | 8 (30.8%) | 18 (69.2%) |
| 2 Unit Apartments | 17 (100.0%) | 0 (0.0%) |
| 3 or 4 Unit Apartments | 0 (0.0%) | 0 (0.0%) |
| 5 to 9 Unit Apartments | 0 (0.0%) | 0 (0.0%) |
| 10 or more Apartments | 0 (0.0%) | 15 (100.0%) |
| Mobile Home / Other | 23 (100.0%) | 0 (0.0%) |
| Total | 1,967 (89.4%) | 232 (10.5%) |
Housing Structures by Number of Rooms in Maplewood
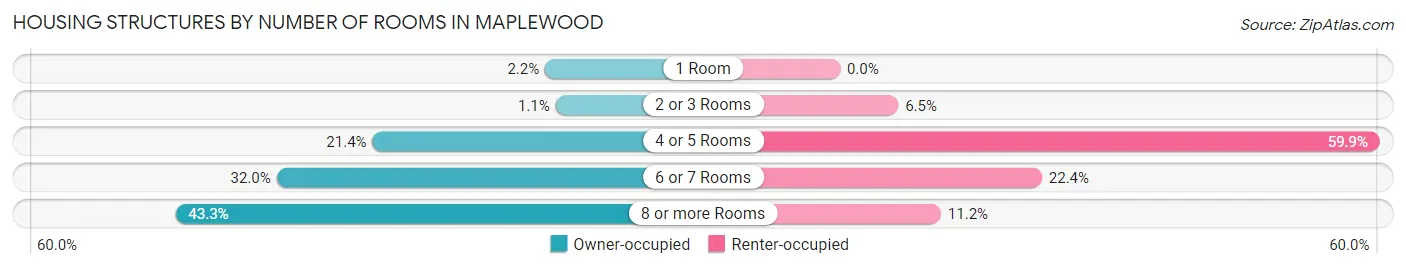
| Number of Rooms | Owner-occupied | Renter-occupied |
| 1 Room | 44 (2.2%) | 0 (0.0%) |
| 2 or 3 Rooms | 21 (1.1%) | 15 (6.5%) |
| 4 or 5 Rooms | 421 (21.4%) | 139 (59.9%) |
| 6 or 7 Rooms | 630 (32.0%) | 52 (22.4%) |
| 8 or more Rooms | 851 (43.3%) | 26 (11.2%) |
| Total | 1,967 (100.0%) | 232 (100.0%) |
Housing Structure by Heating Type in Maplewood
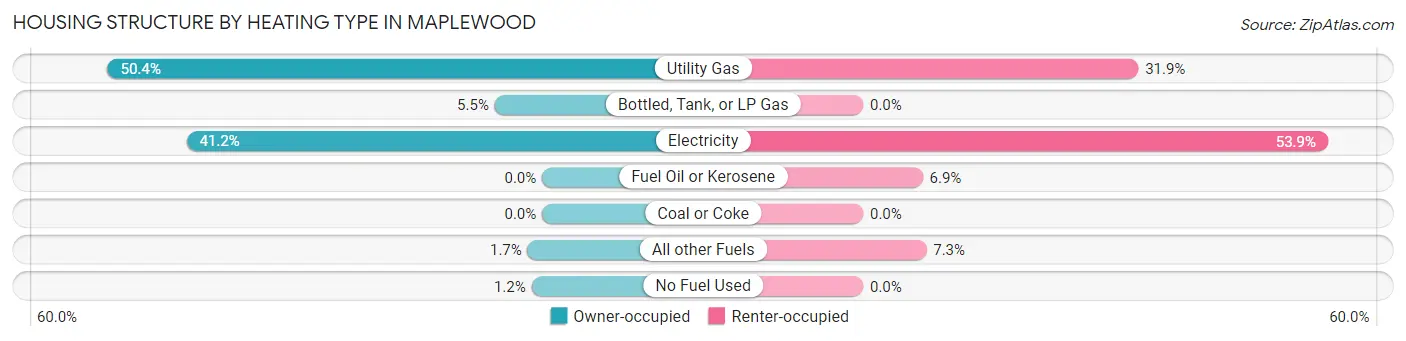
| Heating Type | Owner-occupied | Renter-occupied |
| Utility Gas | 991 (50.4%) | 74 (31.9%) |
| Bottled, Tank, or LP Gas | 108 (5.5%) | 0 (0.0%) |
| Electricity | 811 (41.2%) | 125 (53.9%) |
| Fuel Oil or Kerosene | 0 (0.0%) | 16 (6.9%) |
| Coal or Coke | 0 (0.0%) | 0 (0.0%) |
| All other Fuels | 33 (1.7%) | 17 (7.3%) |
| No Fuel Used | 24 (1.2%) | 0 (0.0%) |
| Total | 1,967 (100.0%) | 232 (100.0%) |
Household Vehicle Usage in Maplewood
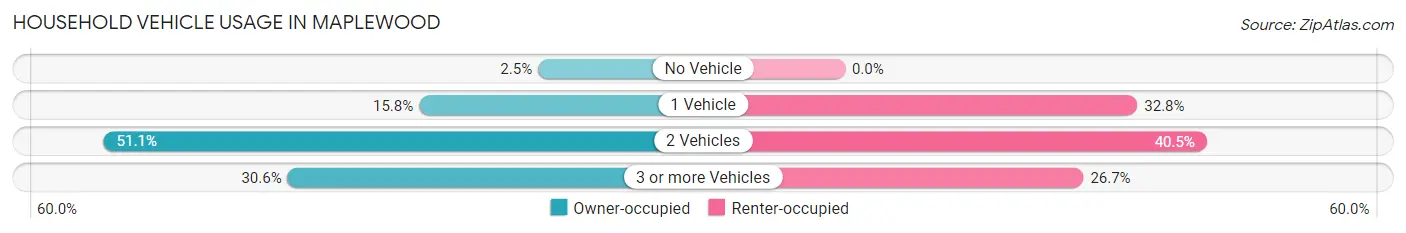
| Vehicles per Household | Owner-occupied | Renter-occupied |
| No Vehicle | 49 (2.5%) | 0 (0.0%) |
| 1 Vehicle | 311 (15.8%) | 76 (32.8%) |
| 2 Vehicles | 1,006 (51.1%) | 94 (40.5%) |
| 3 or more Vehicles | 601 (30.5%) | 62 (26.7%) |
| Total | 1,967 (100.0%) | 232 (100.0%) |
Real Estate & Mortgages in Maplewood
Real Estate and Mortgage Overview in Maplewood
| Characteristic | Without Mortgage | With Mortgage |
| Housing Units | 578 | 1,389 |
| Median Property Value | $566,500 | $649,600 |
| Median Household Income | $103,947 | $757 |
| Monthly Housing Costs | $684 | $530 |
| Real Estate Taxes | $4,620 | $18 |
Property Value by Mortgage Status in Maplewood
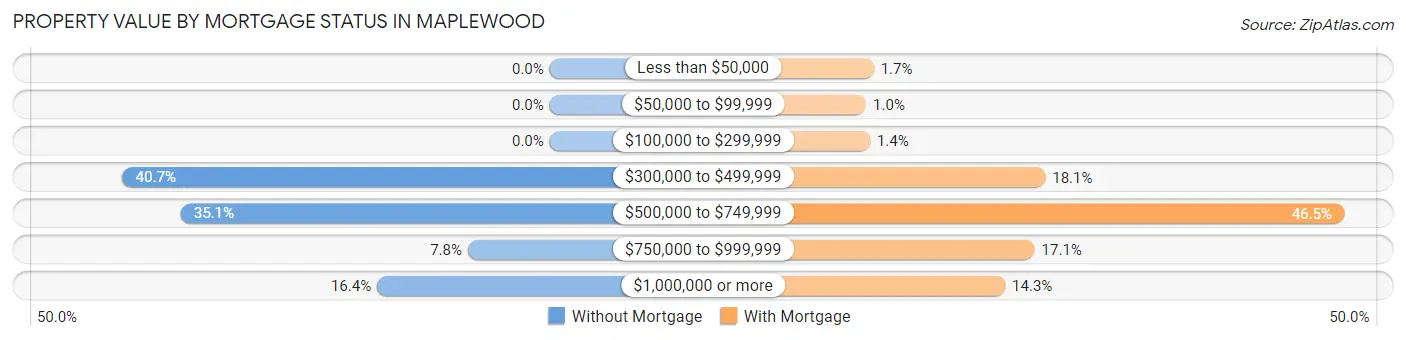
| Property Value | Without Mortgage | With Mortgage |
| Less than $50,000 | 0 (0.0%) | 24 (1.7%) |
| $50,000 to $99,999 | 0 (0.0%) | 14 (1.0%) |
| $100,000 to $299,999 | 0 (0.0%) | 19 (1.4%) |
| $300,000 to $499,999 | 235 (40.7%) | 251 (18.1%) |
| $500,000 to $749,999 | 203 (35.1%) | 646 (46.5%) |
| $750,000 to $999,999 | 45 (7.8%) | 237 (17.1%) |
| $1,000,000 or more | 95 (16.4%) | 198 (14.2%) |
| Total | 578 (100.0%) | 1,389 (100.0%) |
Household Income by Mortgage Status in Maplewood
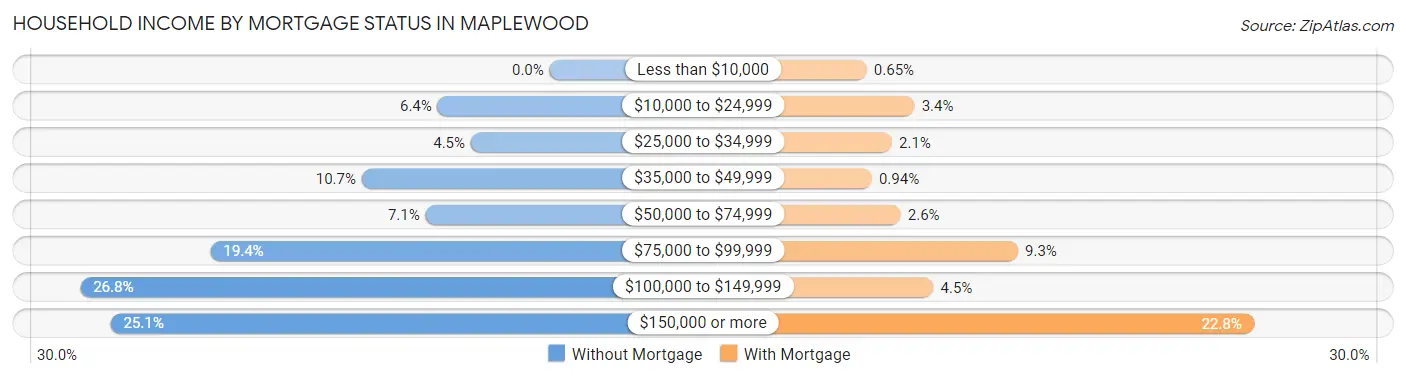
| Household Income | Without Mortgage | With Mortgage |
| Less than $10,000 | 0 (0.0%) | 9 (0.6%) |
| $10,000 to $24,999 | 37 (6.4%) | 47 (3.4%) |
| $25,000 to $34,999 | 26 (4.5%) | 29 (2.1%) |
| $35,000 to $49,999 | 62 (10.7%) | 13 (0.9%) |
| $50,000 to $74,999 | 41 (7.1%) | 36 (2.6%) |
| $75,000 to $99,999 | 112 (19.4%) | 129 (9.3%) |
| $100,000 to $149,999 | 155 (26.8%) | 62 (4.5%) |
| $150,000 or more | 145 (25.1%) | 316 (22.8%) |
| Total | 578 (100.0%) | 1,389 (100.0%) |
Property Value to Household Income Ratio in Maplewood
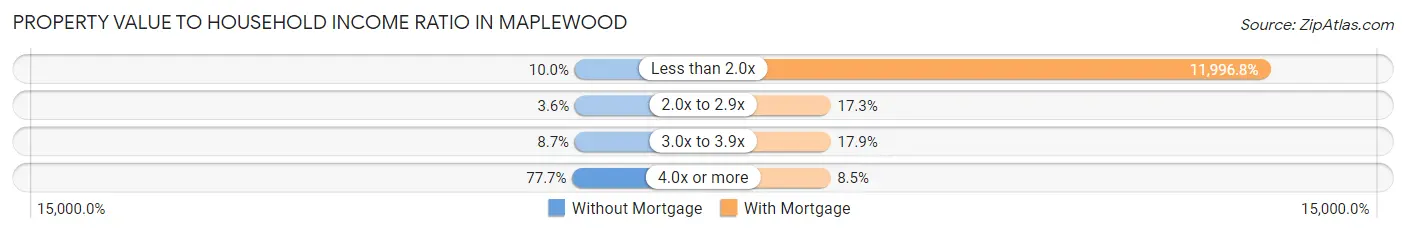
| Value-to-Income Ratio | Without Mortgage | With Mortgage |
| Less than 2.0x | 58 (10.0%) | 166,635 (11,996.8%) |
| 2.0x to 2.9x | 21 (3.6%) | 240 (17.3%) |
| 3.0x to 3.9x | 50 (8.6%) | 249 (17.9%) |
| 4.0x or more | 449 (77.7%) | 118 (8.5%) |
| Total | 578 (100.0%) | 1,389 (100.0%) |
Real Estate Taxes by Mortgage Status in Maplewood
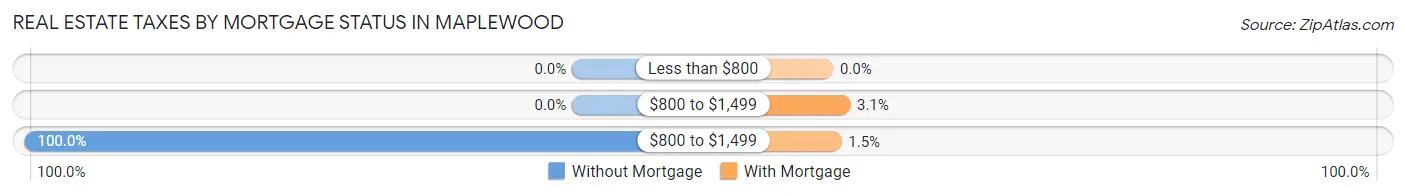
| Property Taxes | Without Mortgage | With Mortgage |
| Less than $800 | 0 (0.0%) | 0 (0.0%) |
| $800 to $1,499 | 0 (0.0%) | 43 (3.1%) |
| $800 to $1,499 | 578 (100.0%) | 21 (1.5%) |
| Total | 578 (100.0%) | 1,389 (100.0%) |
Health & Disability in Maplewood
Health Insurance Coverage by Age in Maplewood
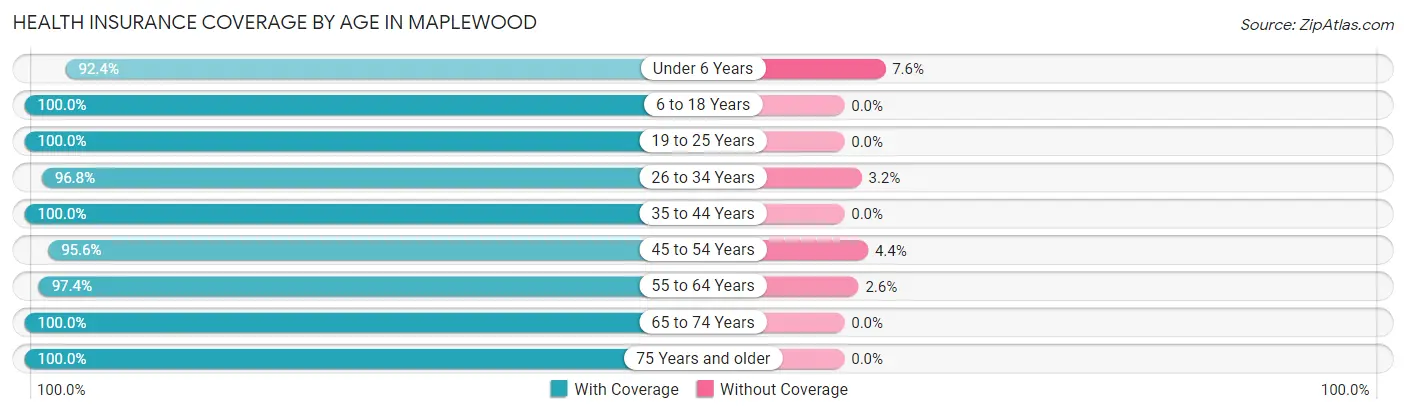
| Age Bracket | With Coverage | Without Coverage |
| Under 6 Years | 436 (92.4%) | 36 (7.6%) |
| 6 to 18 Years | 596 (100.0%) | 0 (0.0%) |
| 19 to 25 Years | 243 (100.0%) | 0 (0.0%) |
| 26 to 34 Years | 483 (96.8%) | 16 (3.2%) |
| 35 to 44 Years | 721 (100.0%) | 0 (0.0%) |
| 45 to 54 Years | 759 (95.6%) | 35 (4.4%) |
| 55 to 64 Years | 960 (97.4%) | 26 (2.6%) |
| 65 to 74 Years | 882 (100.0%) | 0 (0.0%) |
| 75 Years and older | 320 (100.0%) | 0 (0.0%) |
| Total | 5,400 (98.0%) | 113 (2.1%) |
Health Insurance Coverage by Citizenship Status in Maplewood
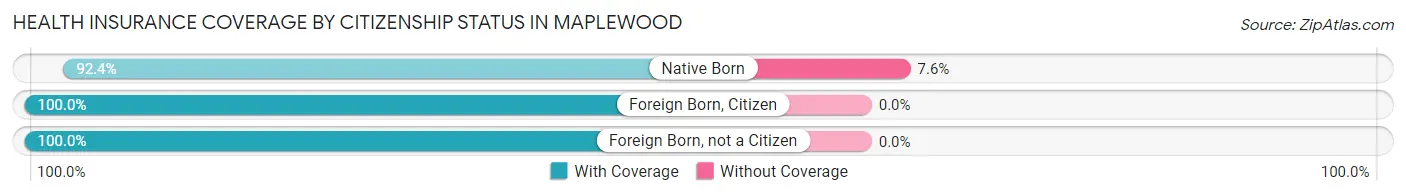
| Citizenship Status | With Coverage | Without Coverage |
| Native Born | 436 (92.4%) | 36 (7.6%) |
| Foreign Born, Citizen | 596 (100.0%) | 0 (0.0%) |
| Foreign Born, not a Citizen | 243 (100.0%) | 0 (0.0%) |
Health Insurance Coverage by Household Income in Maplewood
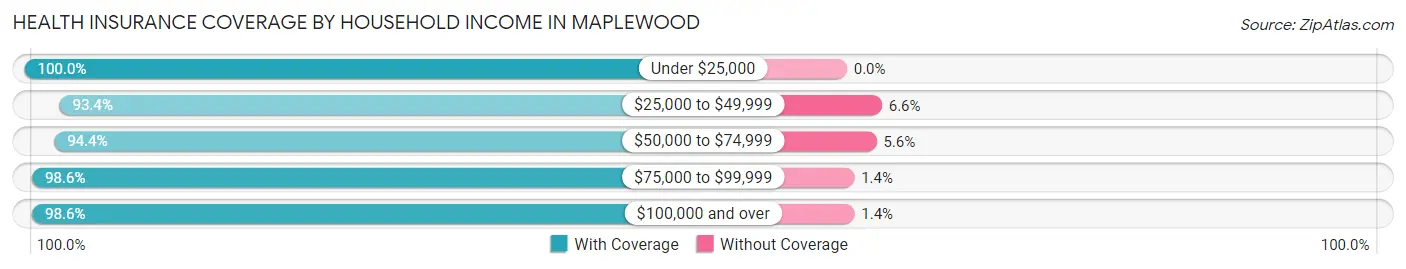
| Household Income | With Coverage | Without Coverage |
| Under $25,000 | 120 (100.0%) | 0 (0.0%) |
| $25,000 to $49,999 | 342 (93.4%) | 24 (6.6%) |
| $50,000 to $74,999 | 408 (94.4%) | 24 (5.6%) |
| $75,000 to $99,999 | 497 (98.6%) | 7 (1.4%) |
| $100,000 and over | 4,014 (98.6%) | 58 (1.4%) |
Public vs Private Health Insurance Coverage by Age in Maplewood
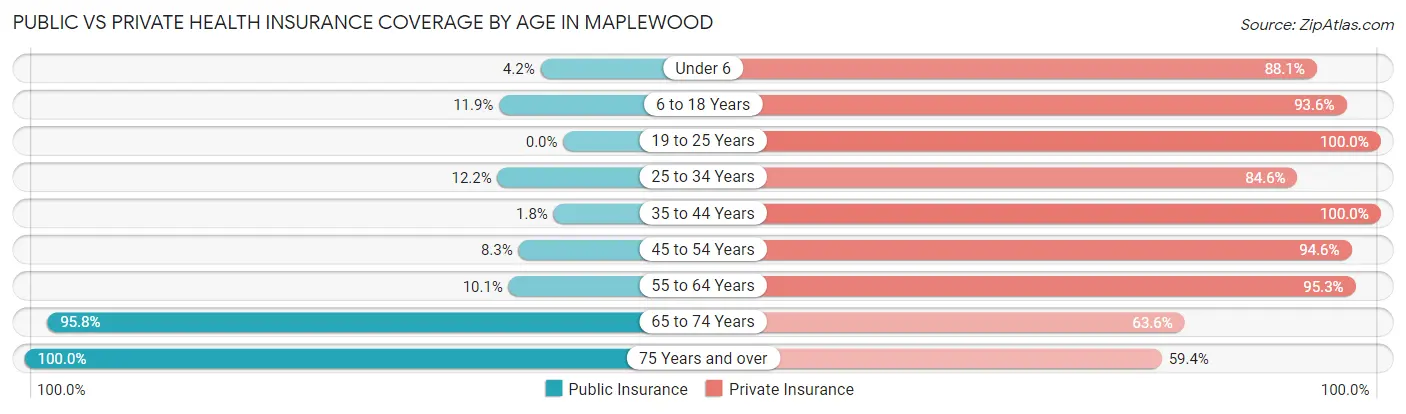
| Age Bracket | Public Insurance | Private Insurance |
| Under 6 | 20 (4.2%) | 416 (88.1%) |
| 6 to 18 Years | 71 (11.9%) | 558 (93.6%) |
| 19 to 25 Years | 0 (0.0%) | 243 (100.0%) |
| 25 to 34 Years | 61 (12.2%) | 422 (84.6%) |
| 35 to 44 Years | 13 (1.8%) | 721 (100.0%) |
| 45 to 54 Years | 66 (8.3%) | 751 (94.6%) |
| 55 to 64 Years | 100 (10.1%) | 940 (95.3%) |
| 65 to 74 Years | 845 (95.8%) | 561 (63.6%) |
| 75 Years and over | 320 (100.0%) | 190 (59.4%) |
| Total | 1,496 (27.1%) | 4,802 (87.1%) |
Disability Status by Sex by Age in Maplewood
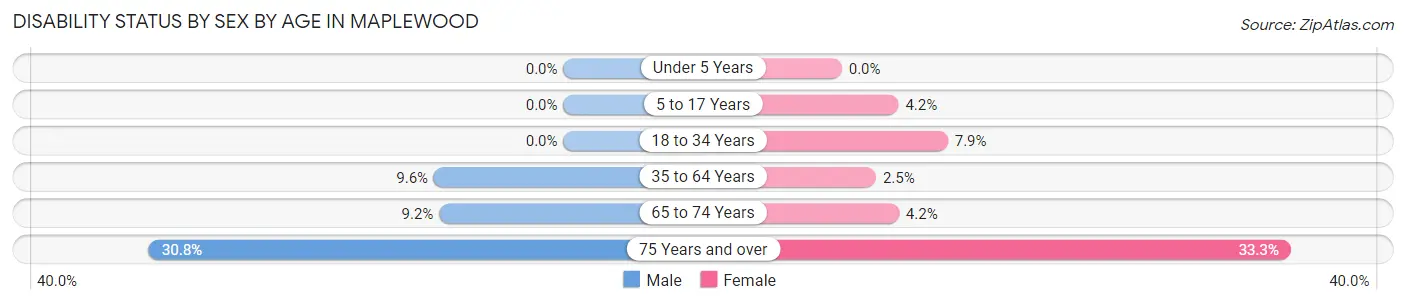
| Age Bracket | Male | Female |
| Under 5 Years | 0 (0.0%) | 0 (0.0%) |
| 5 to 17 Years | 0 (0.0%) | 18 (4.2%) |
| 18 to 34 Years | 0 (0.0%) | 37 (7.9%) |
| 35 to 64 Years | 123 (9.6%) | 31 (2.5%) |
| 65 to 74 Years | 40 (9.2%) | 19 (4.2%) |
| 75 Years and over | 44 (30.8%) | 59 (33.3%) |
Disability Class by Sex by Age in Maplewood
Disability Class: Hearing Difficulty
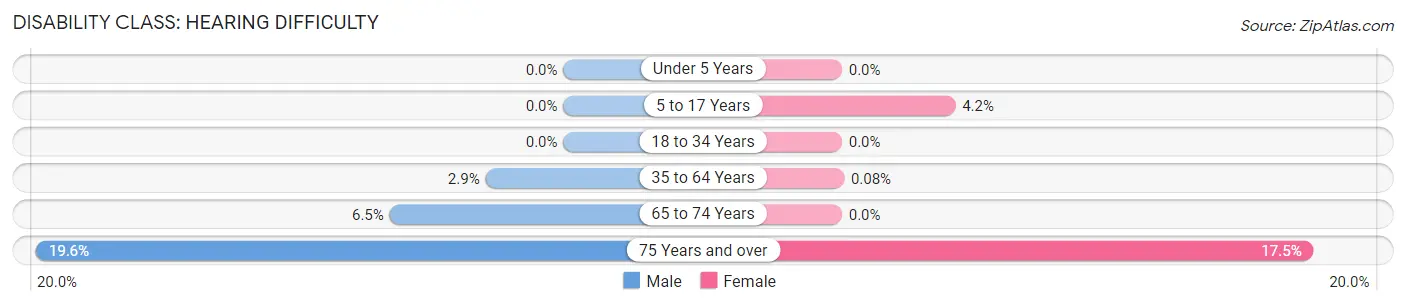
| Age Bracket | Male | Female |
| Under 5 Years | 0 (0.0%) | 0 (0.0%) |
| 5 to 17 Years | 0 (0.0%) | 18 (4.2%) |
| 18 to 34 Years | 0 (0.0%) | 0 (0.0%) |
| 35 to 64 Years | 37 (2.9%) | 1 (0.1%) |
| 65 to 74 Years | 28 (6.5%) | 0 (0.0%) |
| 75 Years and over | 28 (19.6%) | 31 (17.5%) |
Disability Class: Vision Difficulty
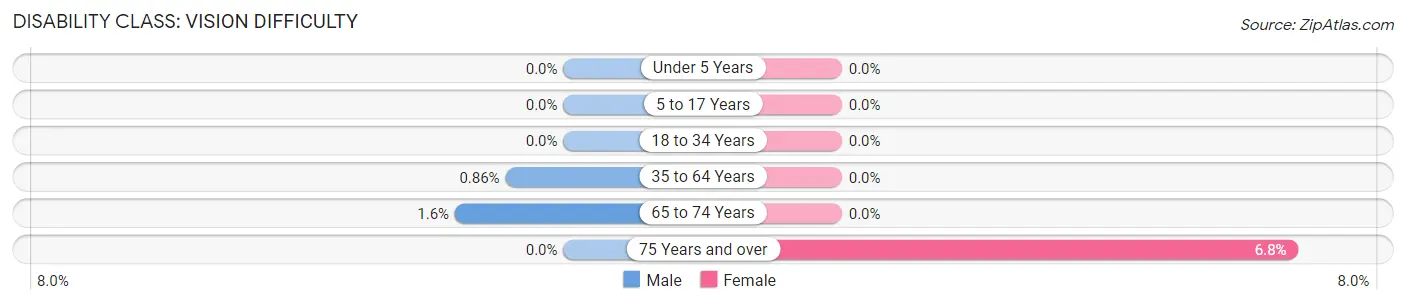
| Age Bracket | Male | Female |
| Under 5 Years | 0 (0.0%) | 0 (0.0%) |
| 5 to 17 Years | 0 (0.0%) | 0 (0.0%) |
| 18 to 34 Years | 0 (0.0%) | 0 (0.0%) |
| 35 to 64 Years | 11 (0.9%) | 0 (0.0%) |
| 65 to 74 Years | 7 (1.6%) | 0 (0.0%) |
| 75 Years and over | 0 (0.0%) | 12 (6.8%) |
Disability Class: Cognitive Difficulty
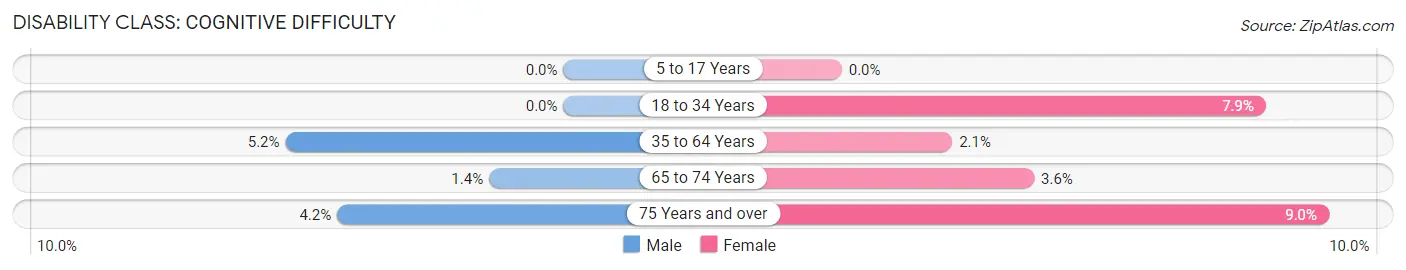
| Age Bracket | Male | Female |
| 5 to 17 Years | 0 (0.0%) | 0 (0.0%) |
| 18 to 34 Years | 0 (0.0%) | 37 (7.9%) |
| 35 to 64 Years | 66 (5.2%) | 25 (2.1%) |
| 65 to 74 Years | 6 (1.4%) | 16 (3.6%) |
| 75 Years and over | 6 (4.2%) | 16 (9.0%) |
Disability Class: Ambulatory Difficulty
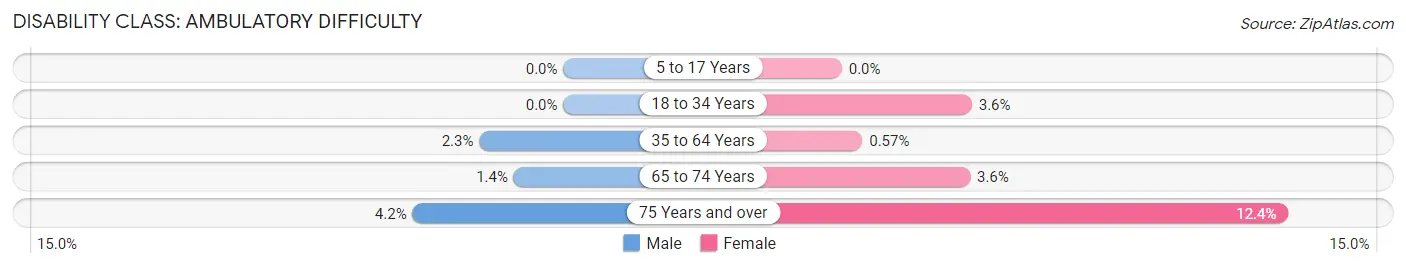
| Age Bracket | Male | Female |
| 5 to 17 Years | 0 (0.0%) | 0 (0.0%) |
| 18 to 34 Years | 0 (0.0%) | 17 (3.6%) |
| 35 to 64 Years | 30 (2.3%) | 7 (0.6%) |
| 65 to 74 Years | 6 (1.4%) | 16 (3.6%) |
| 75 Years and over | 6 (4.2%) | 22 (12.4%) |
Disability Class: Self-Care Difficulty
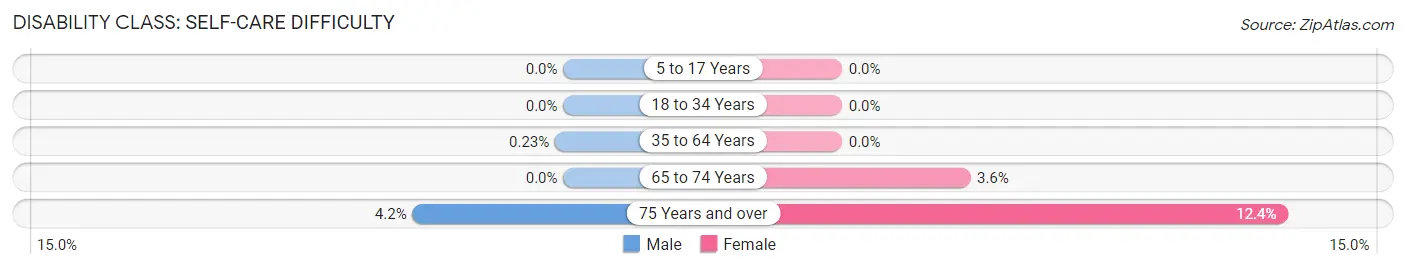
| Age Bracket | Male | Female |
| 5 to 17 Years | 0 (0.0%) | 0 (0.0%) |
| 18 to 34 Years | 0 (0.0%) | 0 (0.0%) |
| 35 to 64 Years | 3 (0.2%) | 0 (0.0%) |
| 65 to 74 Years | 0 (0.0%) | 16 (3.6%) |
| 75 Years and over | 6 (4.2%) | 22 (12.4%) |
Technology Access in Maplewood
Computing Device Access in Maplewood
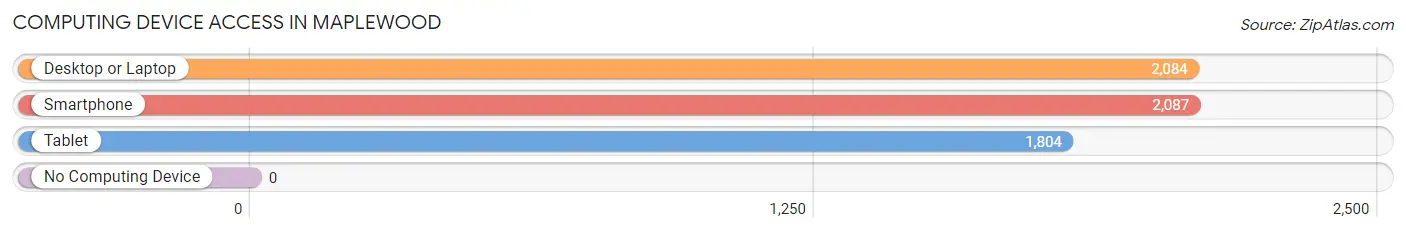
| Device Type | # Households | % Households |
| Desktop or Laptop | 2,084 | 94.8% |
| Smartphone | 2,087 | 94.9% |
| Tablet | 1,804 | 82.0% |
| No Computing Device | 0 | 0.0% |
| Total | 2,199 | 100.0% |
Internet Access in Maplewood
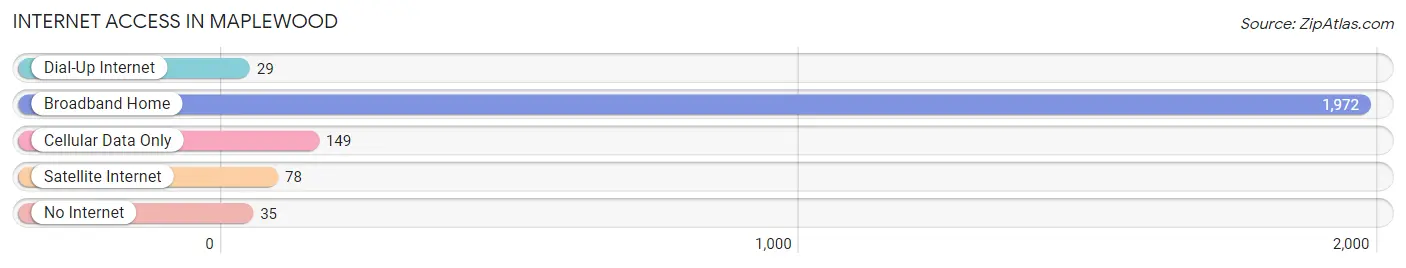
| Internet Type | # Households | % Households |
| Dial-Up Internet | 29 | 1.3% |
| Broadband Home | 1,972 | 89.7% |
| Cellular Data Only | 149 | 6.8% |
| Satellite Internet | 78 | 3.5% |
| No Internet | 35 | 1.6% |
| Total | 2,199 | 100.0% |
Maplewood Summary
Maplewood is a small unincorporated community located in the state of Washington, United States. It is located in the northern part of the state, in Snohomish County, and is situated about 25 miles north of Seattle. The population of Maplewood was estimated to be around 1,000 people in 2020.
History
The area that is now Maplewood was first settled in the late 1800s by a group of Swedish immigrants. The settlers named the area Maplewood after the abundance of maple trees in the area. The settlers built a sawmill and a general store, and the area quickly grew into a small community.
In the early 1900s, the area was home to a number of small farms and businesses, including a dairy, a blacksmith, and a post office. The area was also home to a number of logging camps, which provided employment for many of the residents.
In the 1950s, the area began to experience a population boom as people moved to the area from other parts of the state. This growth continued into the 1960s and 1970s, and the area became a popular destination for people looking for a rural lifestyle.
Geography
Maplewood is located in the northern part of Washington state, in Snohomish County. It is situated about 25 miles north of Seattle, and is bordered by the cities of Everett and Marysville. The area is mostly rural, with rolling hills and forests. The Cascade Mountains are located to the east, and the Olympic Mountains are located to the west.
The climate in Maplewood is mild, with warm summers and cool winters. The average annual temperature is around 50 degrees Fahrenheit, and the average annual precipitation is around 40 inches.
Economy
The economy of Maplewood is largely based on agriculture and forestry. The area is home to a number of small farms, which produce a variety of crops, including apples, cherries, and vegetables. The area is also home to a number of logging camps, which provide employment for many of the residents.
In addition to agriculture and forestry, Maplewood is home to a number of small businesses, including restaurants, shops, and services. The area is also home to a number of small manufacturing companies, which produce a variety of products, including furniture and clothing.
Demographics
The population of Maplewood was estimated to be around 1,000 people in 2020. The population is mostly white, with a small percentage of African Americans, Asians, and Hispanics. The median household income in Maplewood is around $50,000, and the median home value is around $250,000.
The majority of the population is Christian, with a small percentage of other religions, including Judaism and Islam. The area is served by a number of churches, including the Maplewood United Methodist Church and the Maplewood Baptist Church.
Conclusion
Maplewood is a small unincorporated community located in the state of Washington, United States. It is located in the northern part of the state, in Snohomish County, and is situated about 25 miles north of Seattle. The population of Maplewood was estimated to be around 1,000 people in 2020. The economy of Maplewood is largely based on agriculture and forestry, and the area is home to a number of small businesses, including restaurants, shops, and services. The population of Maplewood is mostly white, with a small percentage of African Americans, Asians, and Hispanics. The median household income in Maplewood is around $50,000, and the median home value is around $250,000.
Common Questions
What is Per Capita Income in Maplewood?
Per Capita income in Maplewood is $70,798.
What is the Median Family Income in Maplewood?
Median Family Income in Maplewood is $135,875.
What is the Median Household income in Maplewood?
Median Household Income in Maplewood is $126,615.
What is Income or Wage Gap in Maplewood?
Income or Wage Gap in Maplewood is 32.5%.
Women in Maplewood earn 67.5 cents for every dollar earned by a man.
What is Inequality or Gini Index in Maplewood?
Inequality or Gini Index in Maplewood is 0.43.
What is the Total Population of Maplewood?
Total Population of Maplewood is 5,518.
What is the Total Male Population of Maplewood?
Total Male Population of Maplewood is 2,453.
What is the Total Female Population of Maplewood?
Total Female Population of Maplewood is 3,065.
What is the Ratio of Males per 100 Females in Maplewood?
There are 80.03 Males per 100 Females in Maplewood.
What is the Ratio of Females per 100 Males in Maplewood?
There are 124.95 Females per 100 Males in Maplewood.
What is the Median Population Age in Maplewood?
Median Population Age in Maplewood is 48.3 Years.
What is the Average Family Size in Maplewood
Average Family Size in Maplewood is 2.7 People.
What is the Average Household Size in Maplewood
Average Household Size in Maplewood is 2.5 People.
How Large is the Labor Force in Maplewood?
There are 2,740 People in the Labor Forcein in Maplewood.
What is the Percentage of People in the Labor Force in Maplewood?
60.4% of People are in the Labor Force in Maplewood.
What is the Unemployment Rate in Maplewood?
Unemployment Rate in Maplewood is 7.7%.